
Abstract
Commercial industries which employ metallurgical extraction, cement manufacturing and fuel cells expulse heavy volumes of fluoride-containing wastewater into the natural environment posing grave threats to public health. In the current study, a locally available plant known as Jamun (Eugenia Jambolana), was used as an adsorbent for fluoride removal from aqueous solutions. Physico-chemical experiments were conducted to reveal the size and surface distribution of natural fluoride adsorption on the adsorbent surface using SEM, XRD, and FT- IR. Effects of different parameters such as solution pH, adsorbent dosage (m), co-ions contact time (t), fluoride concentration, and flow rates were investigated. Additionally, the adsorption efficiency of competing ions like Cl-,
Introduction
Water is indeed a vital natural gift for maintaining lives in the environment and any contamination of the water bodies poses serious threats to humanity. Most importantly, the mineral compositions on the surface or ground level are a key critical factor in deciding water suitability for domestic, agricultural, or industry consumption. Due to the heavy discharge of heavy waste into groundwater, water management disinfection of such is still a question. Especially, in rural India, it meets 80 % of the overall potable water demand and 50% of the agricultural need. However, as a result of urbanization and industrialization, groundwater quality is heavily contaminated due to solid and liquid waste disposal (wastewater systems, sludge, and other organic or inorganic sources) resulting in intense percolation and a drop in per capita availability globally [1, 2]. Fluoride, a chemical element found in the groundwater is considered to be one of the major toxicological environmental hazards globally due to persistent leaching from waste materials. Fluorinated water has long been a technical challenge, and defluorination devices have taken a lot of time and effort to be developed [3]. It is also noteworthy to report that common inorganic pollutants are identified in the groundwater in India [4, 5] and traditional methods such as ion adsorption, electrocoagulation, precipitation, electro-dialysis, reverse osmosis, and ion exchange have been used to remove fluoride from water [6].
A major approach by Tikki et al. [7] showed the effects of various forms of fluoride on human health along with various control measures. The fluoride concentration in wastewater has been studied to facilitate the best path for fluoride removal in industrial effluents [8]. More recently, the adsorption capability of adsorbents to fluoride in wastewater has recently fallen short of our expectations due to the demand for high adsorption capacity. Significantly, the maximal removal of fluoride ions from the water is achieved by the sorption characteristic nature of the adsorbent [9]. The general state and applicable prospects of the specific adsorbents, as well as the equilibrium and kinetic parameters of fluoride uptake, were thoroughly summarized [10]. The fluoride removal from drinking water is a herculean task that can be accomplished in a number of ways [11]. The use of natural calcium-rich attapulgite and modified attapulgite as adsorbent was also investigated [12]. Although the extensive study has been reviewed in recent years, most of the adsorbents used poses serious disadvantages in robustness and cost-effectivity. One such example is the fabrication of thermally activated natural calcium-rich attapulgite [13, 14] which required external stimuli and pronounced manufacturing charges. Moreover, the subsurface water in India has been found to hold a great number of co-ions such as arsenate, nitrate, sulphate, pesticides, and other toxic substances which may interfere with the adsorbent filtration performances [15, 16].
Our current work will rely on designing a novel natural adsorbent called Eugenia Jambolana and studying its operating parameters, adsorption performances, and isothermal/ kinetic analysis of the rate of removal of fluoride from wastewater [17–22]. It is also expected that our current study will bridge the gap between fluoride removal technologies adapted via fluorine-rich effluent-generating identities and natural adsorbents.
Experimental
Preparation of stock solution
The stock solution of 0.221 gm of NaF (AR grade, E-Merck) in 1 L of double-distilled water (100 mg / L) is prepared and further diluted for adsorption studies. From the stock solution, the entire other solutions were prepared by an appropriate dilution for fluoride removal experiments and analysis. Temperature-controlled adsorption experiments are carried out in a conical flask that is submerged in the water bath and shaken at a rate of 120 cycles / minute. Perkin-Elmer Lambda 3B UV-Vis spectrophotometer attached to a PC AT-286 is used to analyse the fluoride concentration at 620 nm using the SPADNS indicator [23]. The adsorption isotherm behaviour is analysed at a pH of 6.9±0.1 with varying fluoride ion concentrations ranging from 5 to 50 ppm. The influence of pH varying from 2 to 12 is also studied at a fluoride concentration of 10 ppm. Lastly, the influence of competing anions / cations such as Cl-,
Physical characterization
The surface morphology change and the size of the adsorbent granules are investigated using PXRD (Phillips, ‘X’ pert) and SEM (Jeol, XA-840 A) before and after batch adsorption testing. FTIR (Nicolet 560) spectral analysis is also studied to reveal the presence of active functional groups present on the surface of adsorbent granules.
Adsorption experiment using isotherm models
The ability of four commonly used isotherms to predict the adsorption equilibrium behaviours are investigated using Langmuir, Freundlich, Temkin, and Redlich-Peterson isotherm models. To predict the mechanism for the fluoride removal from the adsorbent surface, the pseudo first-order, pseudo second-order, intra-particle diffusion and Elovich methods are executed to evaluate the current adsorption potential and their kinetic parameters of the extract.
Langmuir adsorption [24], the most well-known of all isotherms, which is used to characterize saturated monolayer adsorption in solid / liquid systems as shown in Equation 1.
Where C e represents the equilibrium concentration (mg / L), the (mg / g), q e is the quantity of adsorbed ions for a full monolayer (mg/g), q m is the maximum sorption capacity and K a is the adsorption equilibrium constant (L / mg).
The adsorption capacity can be calculated from equation Equation (2) with the specific range of adsorbate concentration.
The slope of the linear plot from the linearized form of Equation (2) can be calculated with the values of C
e
/ q
e
vs C
e
, to determine the constants q
m
and K
a
. The Freundlich adsorption isotherm [25], which is based on adsorption on a suitable substrate, is the first real correlation for quantifying adsorption mechanism.
Where, q
e
is the amount of adsorbed ion in grams, the equilibrium concentration C
e
is in gm / L, and K
F
and 1 / n are the physical adsorption and concentration, correspondingly. Equation (3) can be changed to a linear version by utilising logarithms [26].
From Equation (4), the plot of log q e vs log C e shows a straight line. The values for n and K F was calculated by plotting the slope and its intercept of Fig. 1.

Log Ce vs. log q e Freundlich adsorption isotherm.
Temkin Isotherm [27] is the most basic form of the adsorption isotherm model was created to account for adsorbed species chemisorption onto the adsorbent, and it is given as,
Where q
e
and C
e
are similar meanings as noted earlier and the parameters are called Temkin constants. A straight line will emerge from the plot of q
e
vs log C
e
. The slope and intercept of the linear plot can be used to derive the Temkin constants of a and b. The Redlich-Peterson isotherm [28] has three parameters and encompasses the Langmuir and Freundlich isotherms’ characteristics.
Natural logarithms can be used to modify Equation (6) gives a linear form:
The three significant isotherm constants are A, B, and g (0 < g< 1) which may be calculated from the linear plot given in Equation (7) by the trial-and-error optimization method [29].
Effect of adsorbent dose on fluoride removal
The effect of the adsorbent dose on the fluoride ion removal is examined at a fixed starting fluoride concentration of 100 ppm. Enhanced removal of fluoride ions from 79 to 99% has been achieved with an increase in the adsorbent dosage starting from 10 mg / L to 4 mg / L (Fig. 2). Increased fluoride ion removal is attributed to the presence of more active catalytic sites which offered reduced surface area acting as a suitable surface for fluoride ion adsorption [30]. As a result, we concluded that adsorbent dosage concentration of 1 g / L is considered as the best dose for further parameter analysis.

The Influence of Contact Time (1 g adsorbent / L, initial fluoride concentration = 100 mg adsorbent / L, contact time = 1hr, shaking speed = 120 rpm, temperature = 32 °C).
Figure 2 displays the influence of contact time on the adsorbed fluoride ions (initial concentration of fluoride of 1 g / L while maintaining all other parameters constant [31]. The adsorption process is completed in under an hour, with a majority of the fluoride ions being adsorbed within 60 minutes. At the initial stage, the overall rate of removal was significantly changed owing to the unoccupied adsorbent sites and higher concentration gradient. As the reaction reaches the end, the rate of fluoride uptake by the adsorbent was dramatically decreased due to the lowering sites of adsorption in the absorbent and the concentration of fluoride resulting in near complete adsorption.
Influence of pH
The impact of pH on the degree of fluoride ion adsorption from the wastewater was investigated using the as-prepared Eugenia Jambolana powder. The fluoride ion removal was executed in the pH range of 2 to 12, with an adsorbent concentration of 1 g / L at 120 rpm for 1 h. Figure 3 represents the percentage of fluoride ion removal as the solution pH is varied. As the pH of the solution increases, the fluoride uptake drops dramatically from 91% to 80% which is attributed due to electrostatic repulsion between the negative charge of the natural adsorbent and the negative charge of fluoride ions. Also, the competition behind fluoride and hydroxide ions can be another reason which may reduce the adsorption of fluoride ions as indicated in [6, 30].

Effect of pH (Adsorbent dose = 1 g / L, starting fluoride concentration = 100 mg / L, contact duration = 1hr, temperature = 32 °C, shaking speed = 120 rpm, contact time = 1hr, temperature = 32 °C, shaking speed = 120 rpm).
It is also important to understand the influence of co-ions present in the fluoride-contaminated wastewater with the active sites present in the adsorbent surface. Figure 4 revealed that the presence of competing ions such as carbonate, phosphate and other anions like chloride, nitrate, and sulphate ions showed no significant influence on fluoride ion elimination [30]. We assume that our natural adsorbent showed direct reactivity with the fluoride ions compared to other co- ions and the actual mechanism behind this will be studied in our future work.

Shows the effect of interfering ions. (Initial fluoride concentration: 1 g / L, salt concentration: 0.030 mg, adsorbent dose: 1 g / L, contact time: 1 hour, shaking speed: 120 rpm).
Experimental study on the impact of stirring speed on fluoride adsorption is shown in Fig. 5. With increased speed from 0 rpm to 120 rpm, the overall fluoride adsorption rate increased from 79 % to 99 %. We believe that the enhanced adsorption is attributed to the reduction of boundary layer thickness around the adsorbent surface which enhances the increased mass transfer of fluoride ions from the bulk solution to our natural adsorbent. As the stirring speed is increased to 120 rpm, there is reduced contact time for the fluoride ions to recognize the adsorption layer resulting in reduced removal of fluoride ions and hence, a decline in fluoride adsorption is observed.
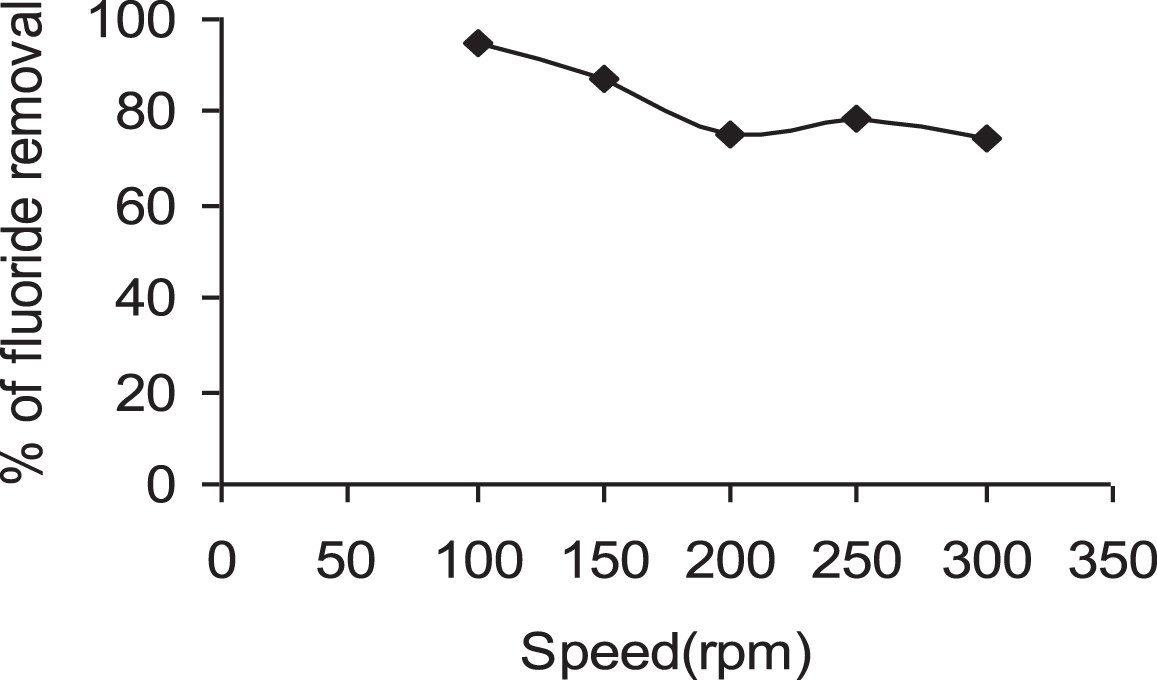
Effect of speed (Initial fluoride concentration = 1 g / L, adsorbent dose 1 g / L, contact time = 1hr).
The effect of the original concentration of fluoride on the percentage of removed contaminants was studied with respect to its initial concentration by keeping other parameters such as amount of adsorbent (1 g / L), stirring speed (120 rpm), and interaction integral time constant under various fluoride volume injections concentrations (1 hr). Figure 6 presents the percentage of fluoride ion removal. At greater adsorbate concentrations, the adsorbent’s binding capability leads to a saturated state at the adsorbent surface, resulting in the lowering of percent of removal [32].
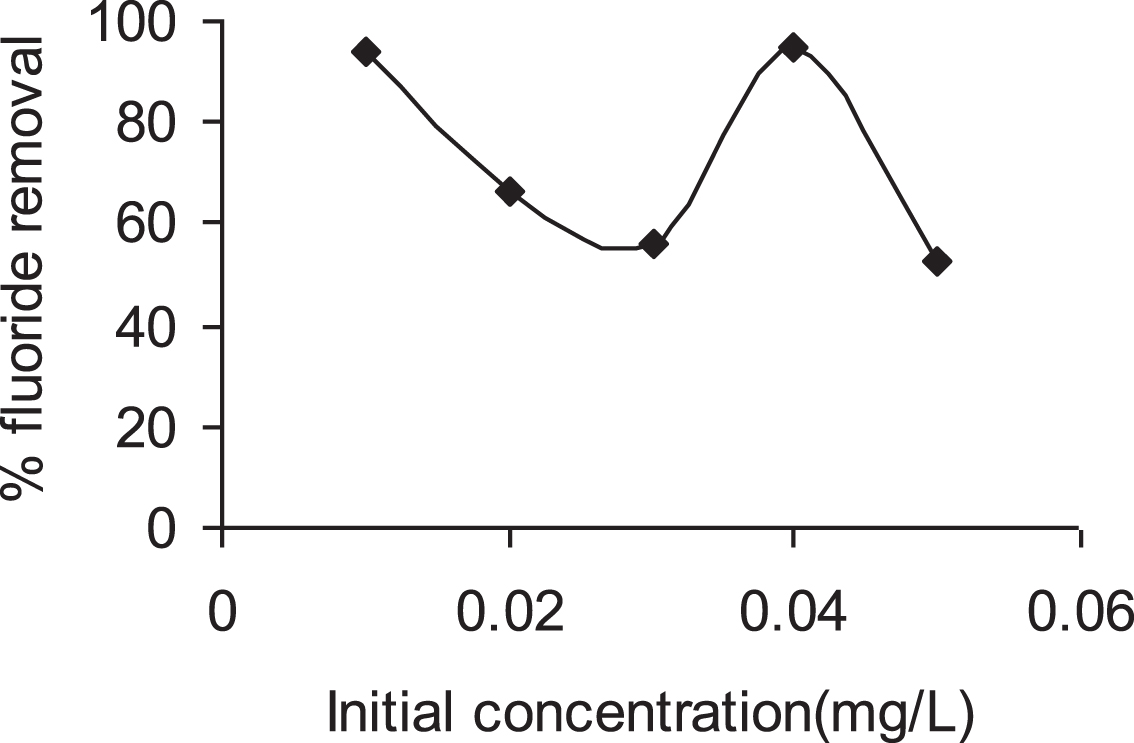
Effect of initial fluoride concentration (Adsorbent dose = 1 g / L, contact time = 1hr, Shaking speed = 120 rpm).
The most crucial characteristic to examine in the design of an adsorption system was the sorbent’s absorption coefficient, which is predicted using isotherm data analysis. For this, several isotherm model equations have been utilized [32]. The fluoride distribution between the liquid and solid phases is determined by the Freundlich and Langmuir equations, which measure the overall adsorption process equilibrium position. The Freundlich and Langmuir model also deals with the physico-chemical adsorption on heterogeneous surfaces, which is dictated by constant adsorption and monolayer coverage energy along with the set of experimental condition. The Equation (8) undermines the surface heterogeneity of the adsorbent using linearized Freundlich isotherm.
Where, k is the Freundlich constants of adsorption capacity and 1/n is the intensity, respectively. The K and 1/n values are 0.2070 and 0.8346 mg / g with a regression coefficient of R2 equates to 0.9744 [33] which are obtained from the slope and the adsorption intensity (1/ n). The intercept of log C
e
vs. log q
e
indicates the favourable adsorption [6]. The Equation (9) examines the monolayer coverage using linearized Langmuir model
Where q0 is the quantity of fluoride ion per unit weight of Naval powder, and b is the equilibrium constant describing the affinity of Eugenia Jambolana powder binding sites. The Langmuir parameters q0 is 1.62 mg/g and b is 0.1569 L / mg, with R2 equates to 0.977. The dimensionless equilibrium parameter (r) is computed using the following Equation (10) which estimates the process’s adsorption efficiency.
Where C0 is the initial fluoride concentration and b is the Langmuir isotherm constant. A value of r < 1 gives the favourable adsorption, while r > 1 represents unfavourable adsorption [31]. The value of ‘r’ is discovered to be 0.06, indicating that the system under investigation followed a promising adsorption pattern.
To understand the fluoride removal mechanism by the Naval powder, study looked into adsorption kinetics. Increased fluoride removal is achieved as the reaction is increased; however, surface adsorption equilibrium is achieved within 60 minutes indicating reduced active adsorbent sites. By using the Lagergren [34] first-order rate equation Equation (11), the reaction kinetics (K
ads
) for fluoride sorption is determined [22].
Herein, q e and q t (mg / g) represents the amount of fluorinated water adsorbed per unit mass for a period of t (min-1) respectively. While K ads is the rate constant, log (q e - q t ) is calculated using log q e – K ads (t / 2.303). The slope of the log (q e - q t ) vs time is plotted in Fig. 6, and is used to compute the K ads values for fluoride sorption. For preliminary fluoride concentrations of 100, 200, 300, 400, and 500 mg / L, K ads is determined to be 7×10⁻⁴, 3×10⁻⁴, 2×10⁻⁴, 2×10⁻⁴, and 1×10⁻⁴, respectively. The variation in the adsorption rate is found to be proportional to the first power of concentration for rigorous surface adsorption. When pore diffusion limits the adsorption process, the relation between initial solute concentration and rate of adsorption will not be linear which is supported in Fig. 7. It is noteworthy that the graphical link between the level of fluoride adsorbed and the square root of time can unravel further reaction mechanisms.
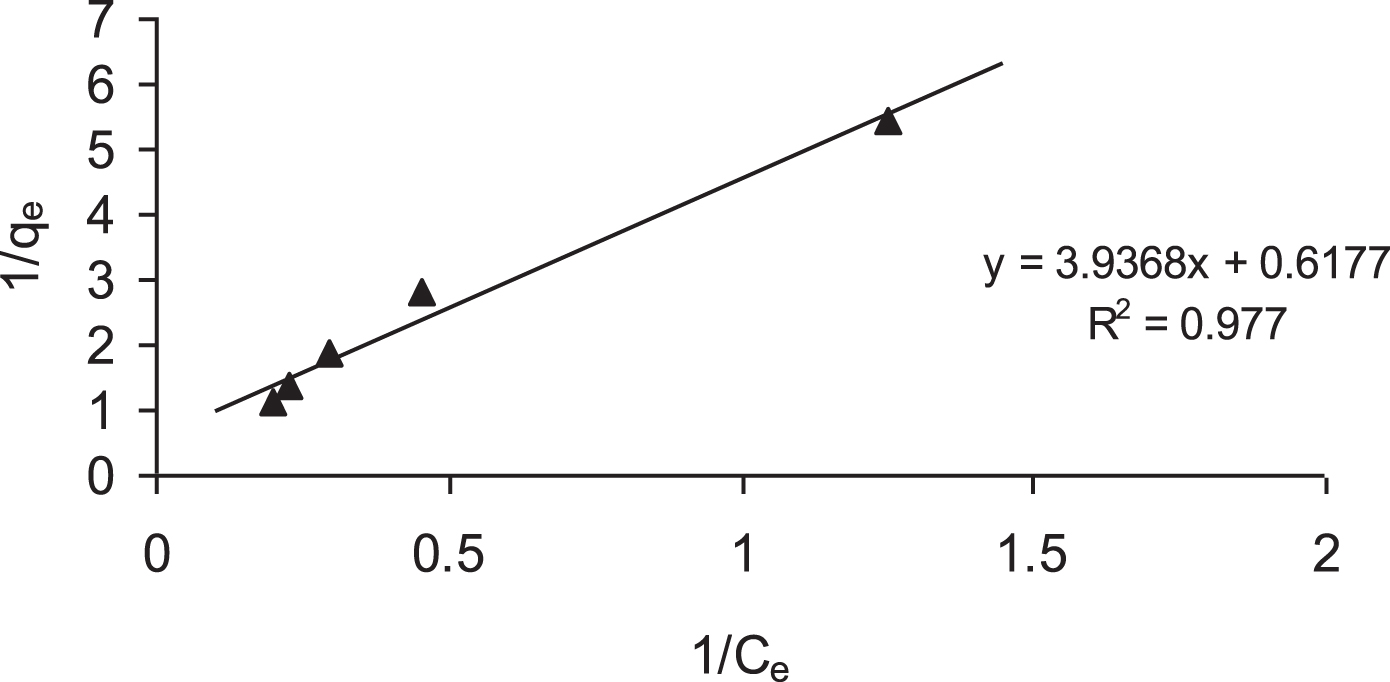
1/Ce vs. 1/qe Langmuir isotherm.
To investigate the role of adsorbate molecules in the adsorption process, the rate law for molecular diffusion, K p (mg / g / min), is calculated. The rate constant for intraparticle diffusion, K p (mg / g / min), is computed using the following equation (Equation (11)) which provides information about the the role of intraparticle diffusion during the adsorption process [35]:
Wherein, t1/2 is the time constant. The value of K p was calculated using the inclination of the plotted graph of q t against the square root of time (t1/2) shown in Fig. 9. At early fluoride concentrations of 100, 200, 300, 400, and 500 mg/L, K p is calculated to be 2.9×10⁻³, 2.9×10⁻³, 2.9×10⁻³, 2.8×10⁻³, and 2.8×10⁻³ mg / g min-1/2, respectively. The film or boundary layer diffusion is attributed to the initial curved component, whereas the intraparticle diffusion is attributed to the linear portion as seen in Fig. 8. The process for fluoride removal by Eugenia Jambolana powder is complex, as the linear section of the curve did not pass through the origin, and we believe further understanding on the complex mechanism behind the surface adsorption and adsorption kinetics will play a key role in the rate-determining phase [36].
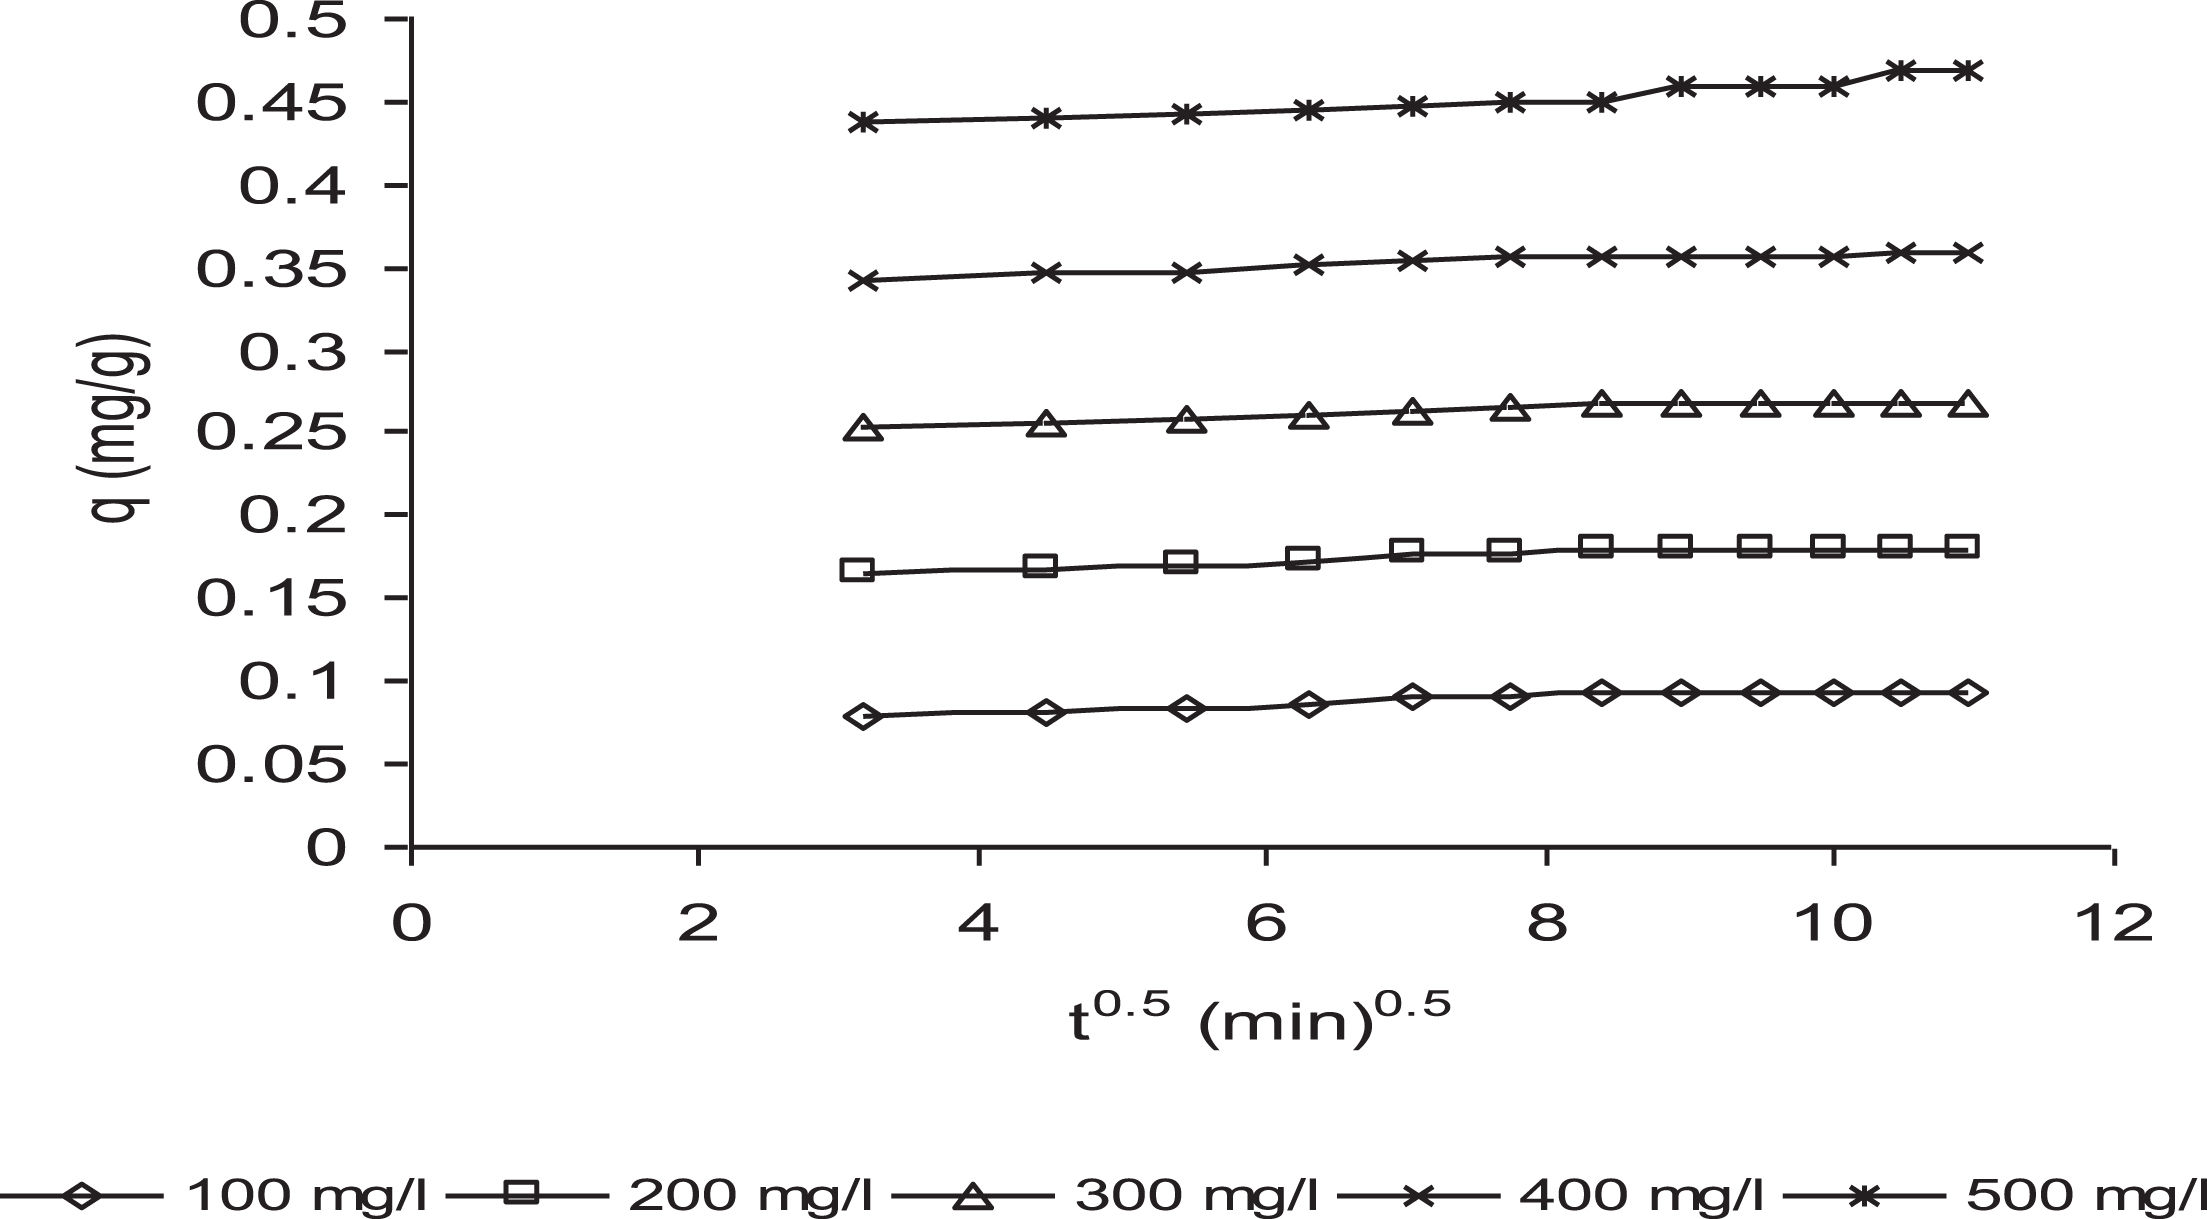
Adsorption of fluoride intraparticle mass transfer curve.
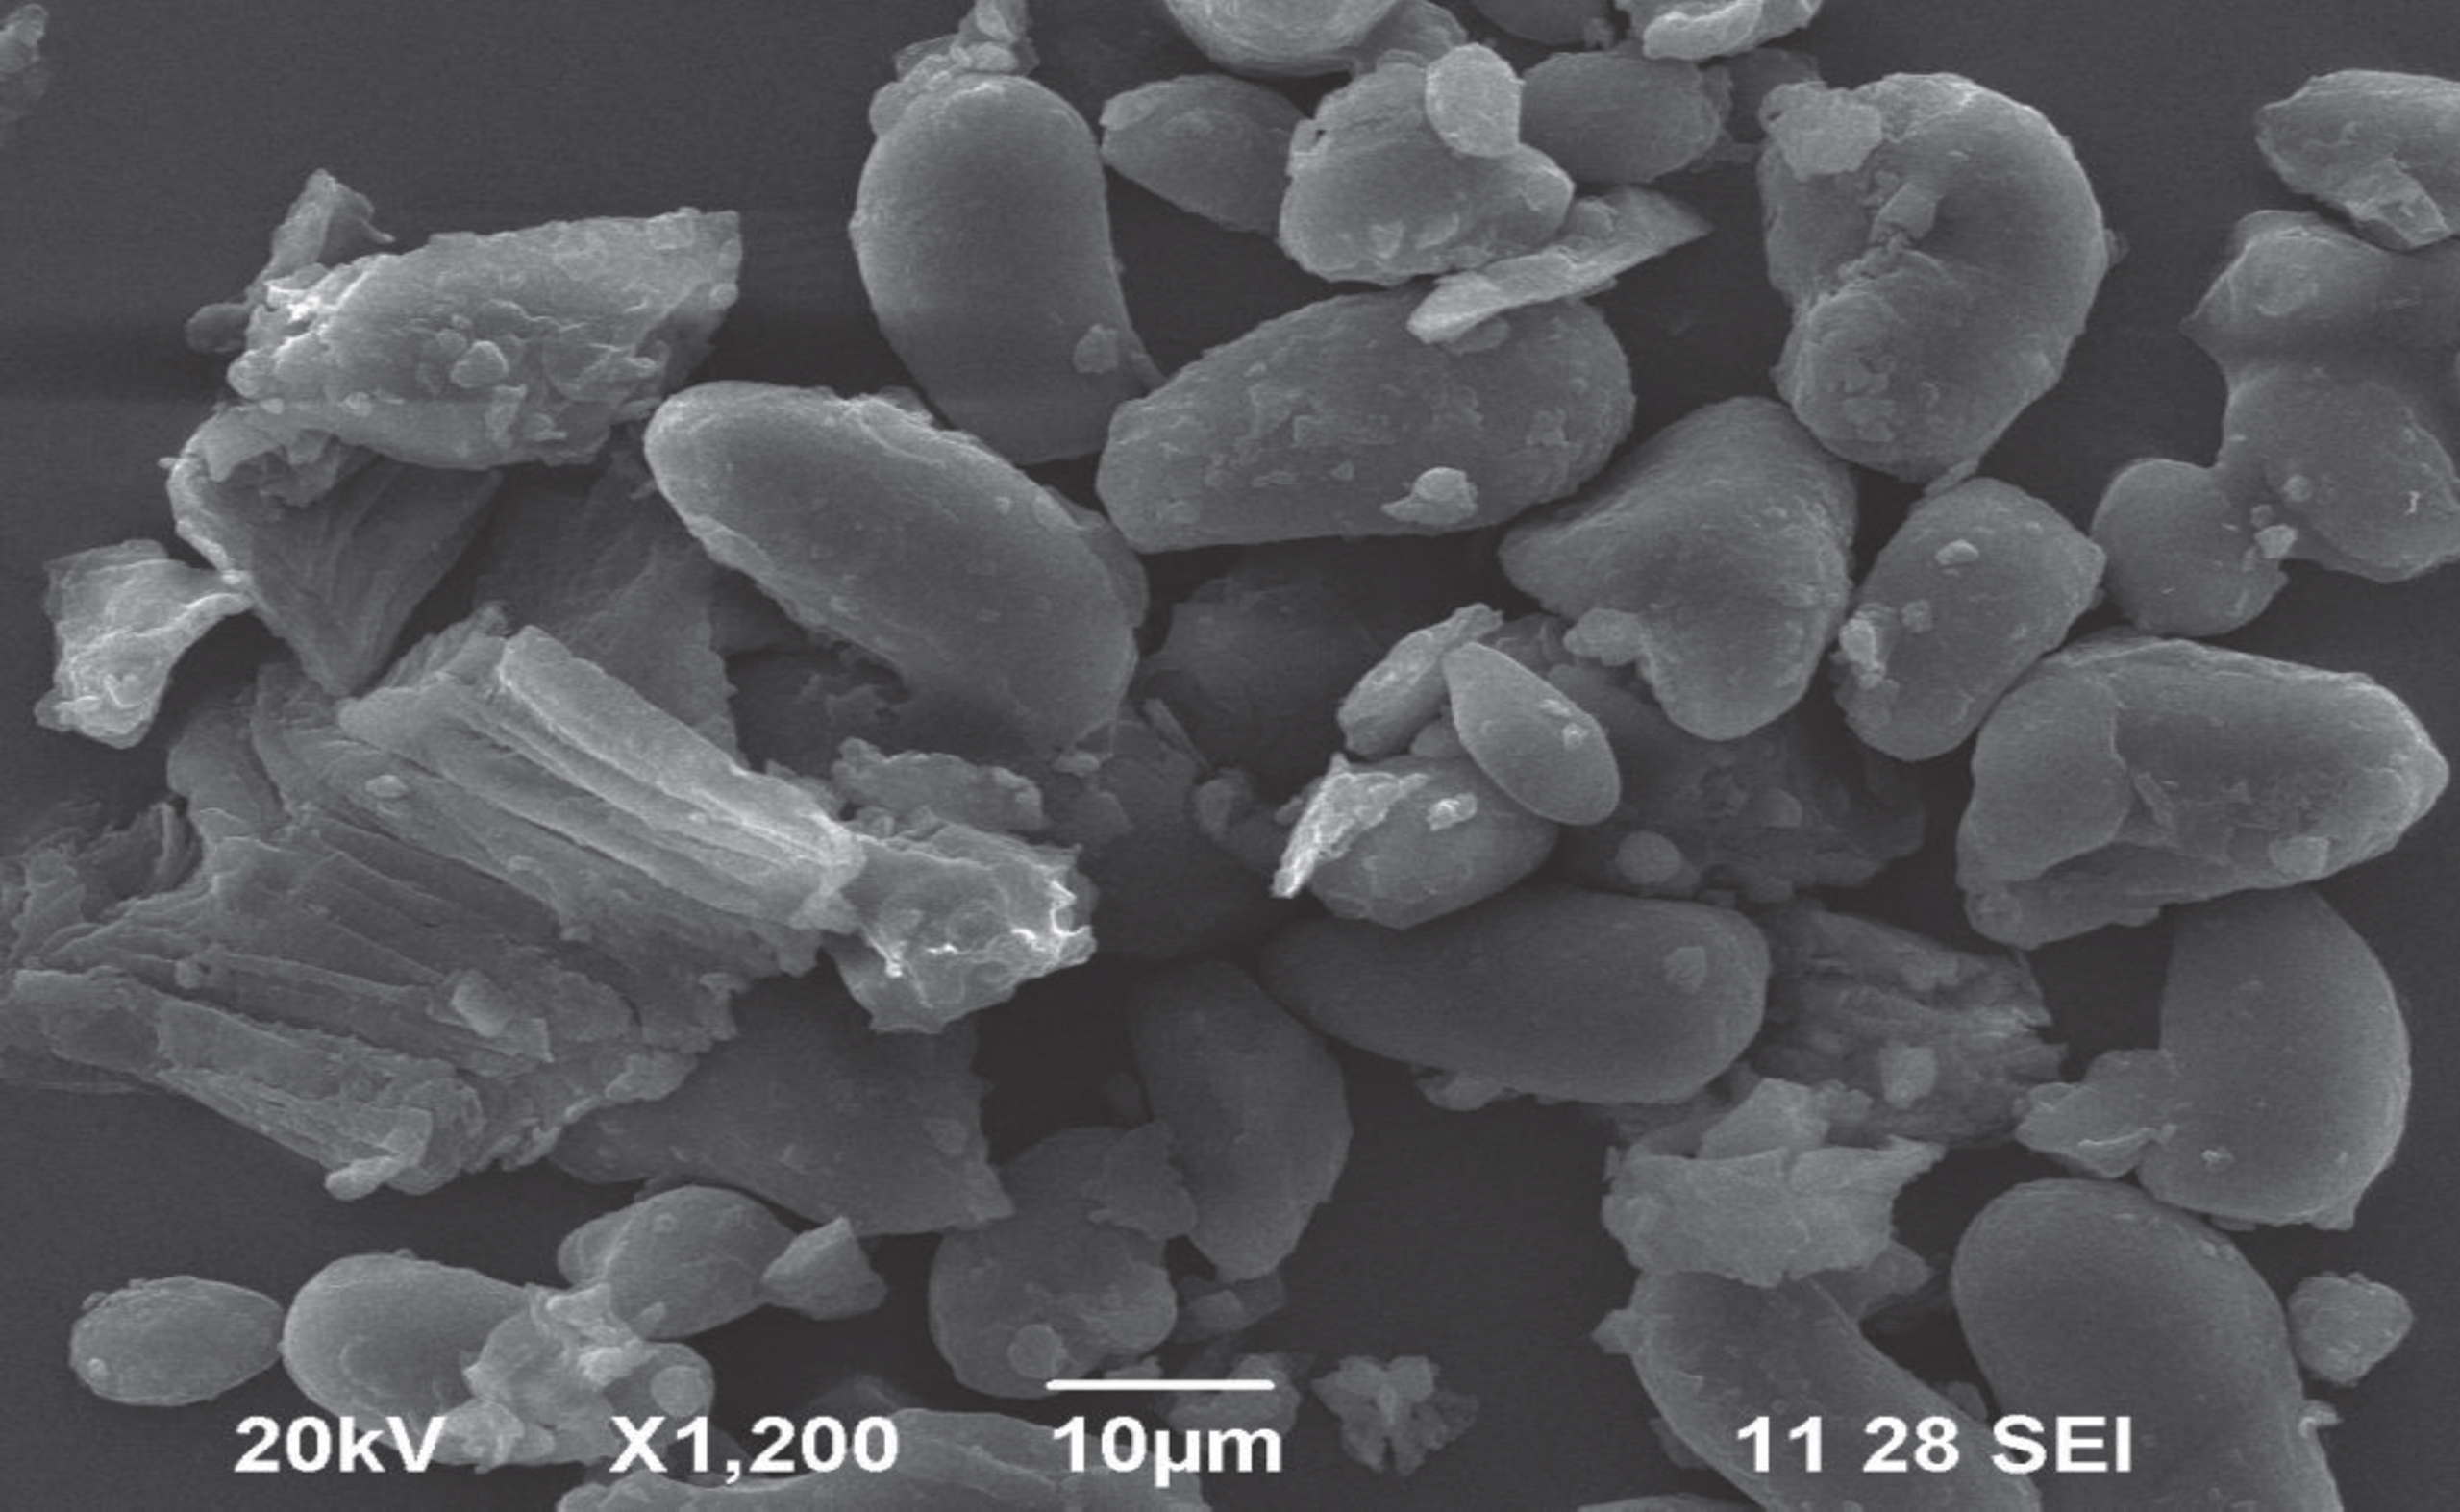
SEM Images of Eugenia Jambolana powder adsorbent.
The surface morphology of the Eugenia Jambolana adsorbent was studied by SEM Analysis (Fig. 9). The SEM images show the flocked and porous surface texture, indicating that the adsorbents were extremely porous allowing for pronounced adsorption capacity. During fluoride adsorption, the surface takes on a stretched form after 1 hour of sustained flow- through exposure (Fig. 10). Due to the porous charactertistics of the natural adsorbent, the fluoride ions are trapped within the pores which is further confirmed by powder XRD analysis [32]. The Fig. 11 shows the dynamic changes in XRD patterns of Eugenia Jambolana powder adsorbent when exposed to fluoride ions (Fig. 12). A quantitative plot has also been provided in Table 1 and 2 which revealed the changes in adsorption peak of the natural adsorbent before fluoride adsorption and after fluoride interactions. To supplement the chemical adsorption property of fluoride ions within the adsorbent [23], FTIR analysis revealed a prominent band at 3438 cm-1 indicating the presence of hydroxyl groups; -CH2 stretching vibrations at 1423 cm-1 and C-C groups at 1634 cm-1. As the adsorbent efficiency increases, a lower peak intensity of the – OH groups confirmed the adherence of fluoride ions directly onto Eugenia Jambolana [33, 37–39].
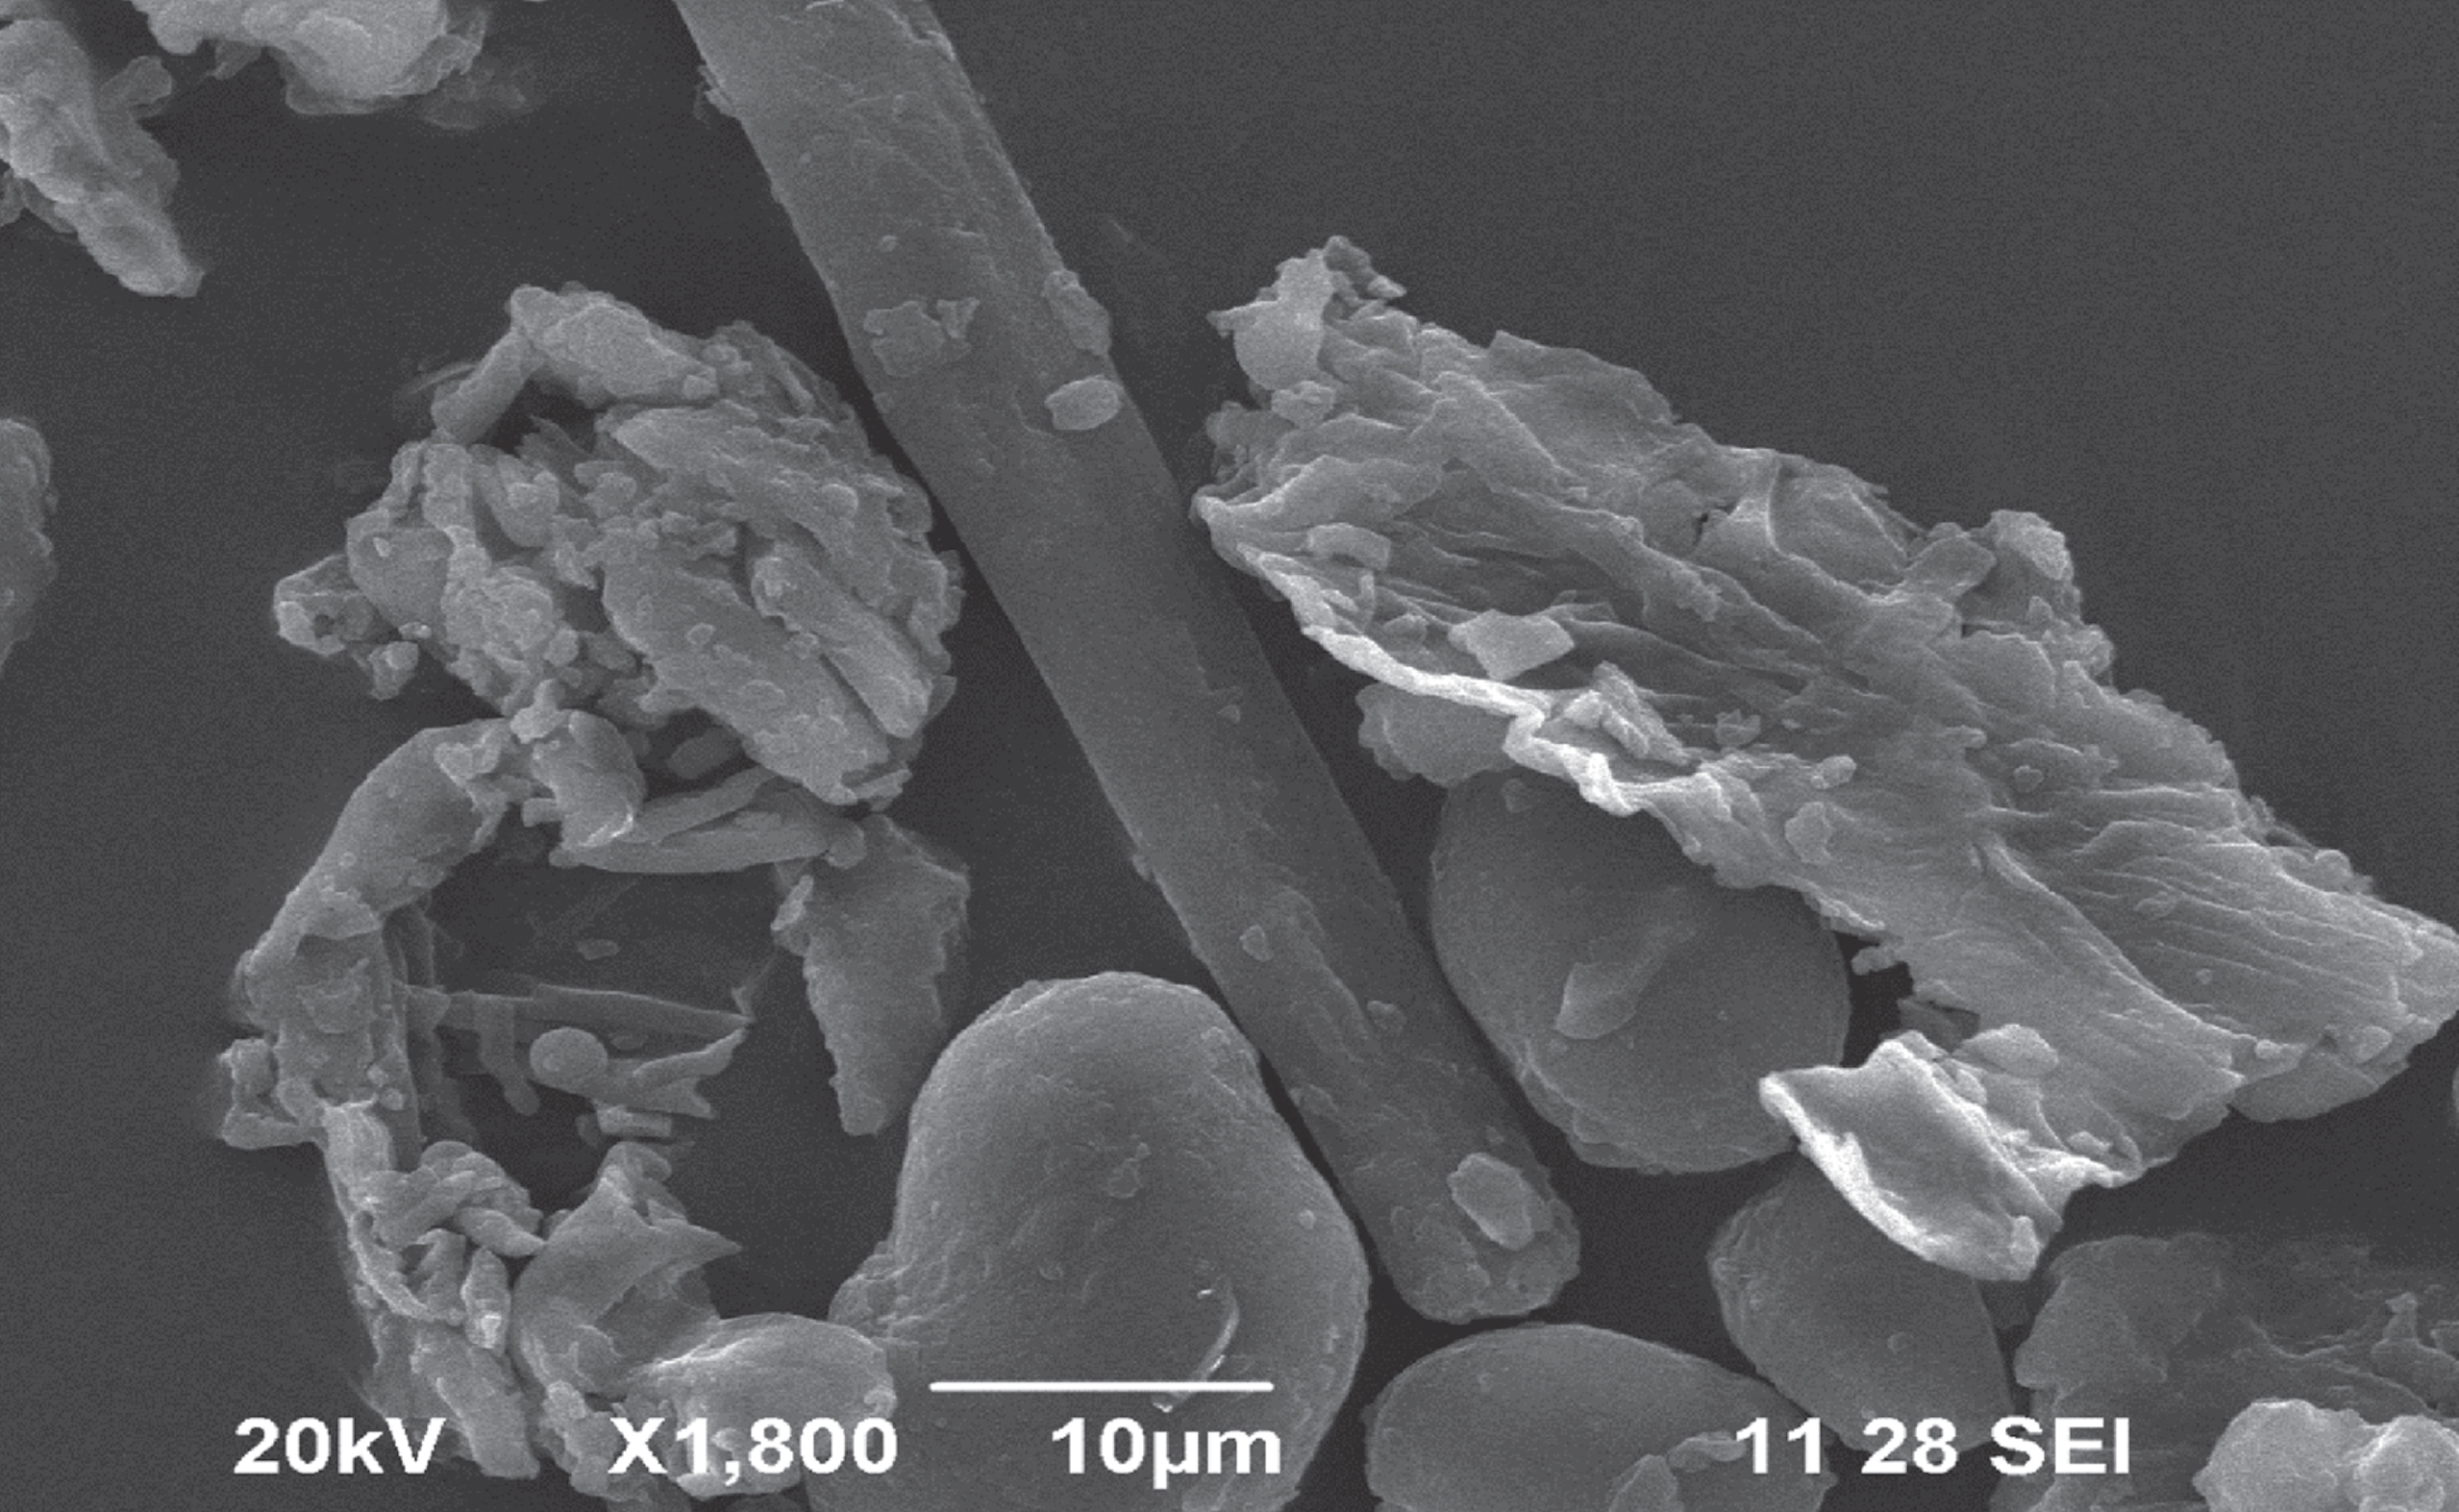
SEM Images of Fluoride adsorbed Eugenia Jambolana powder adsorbent.
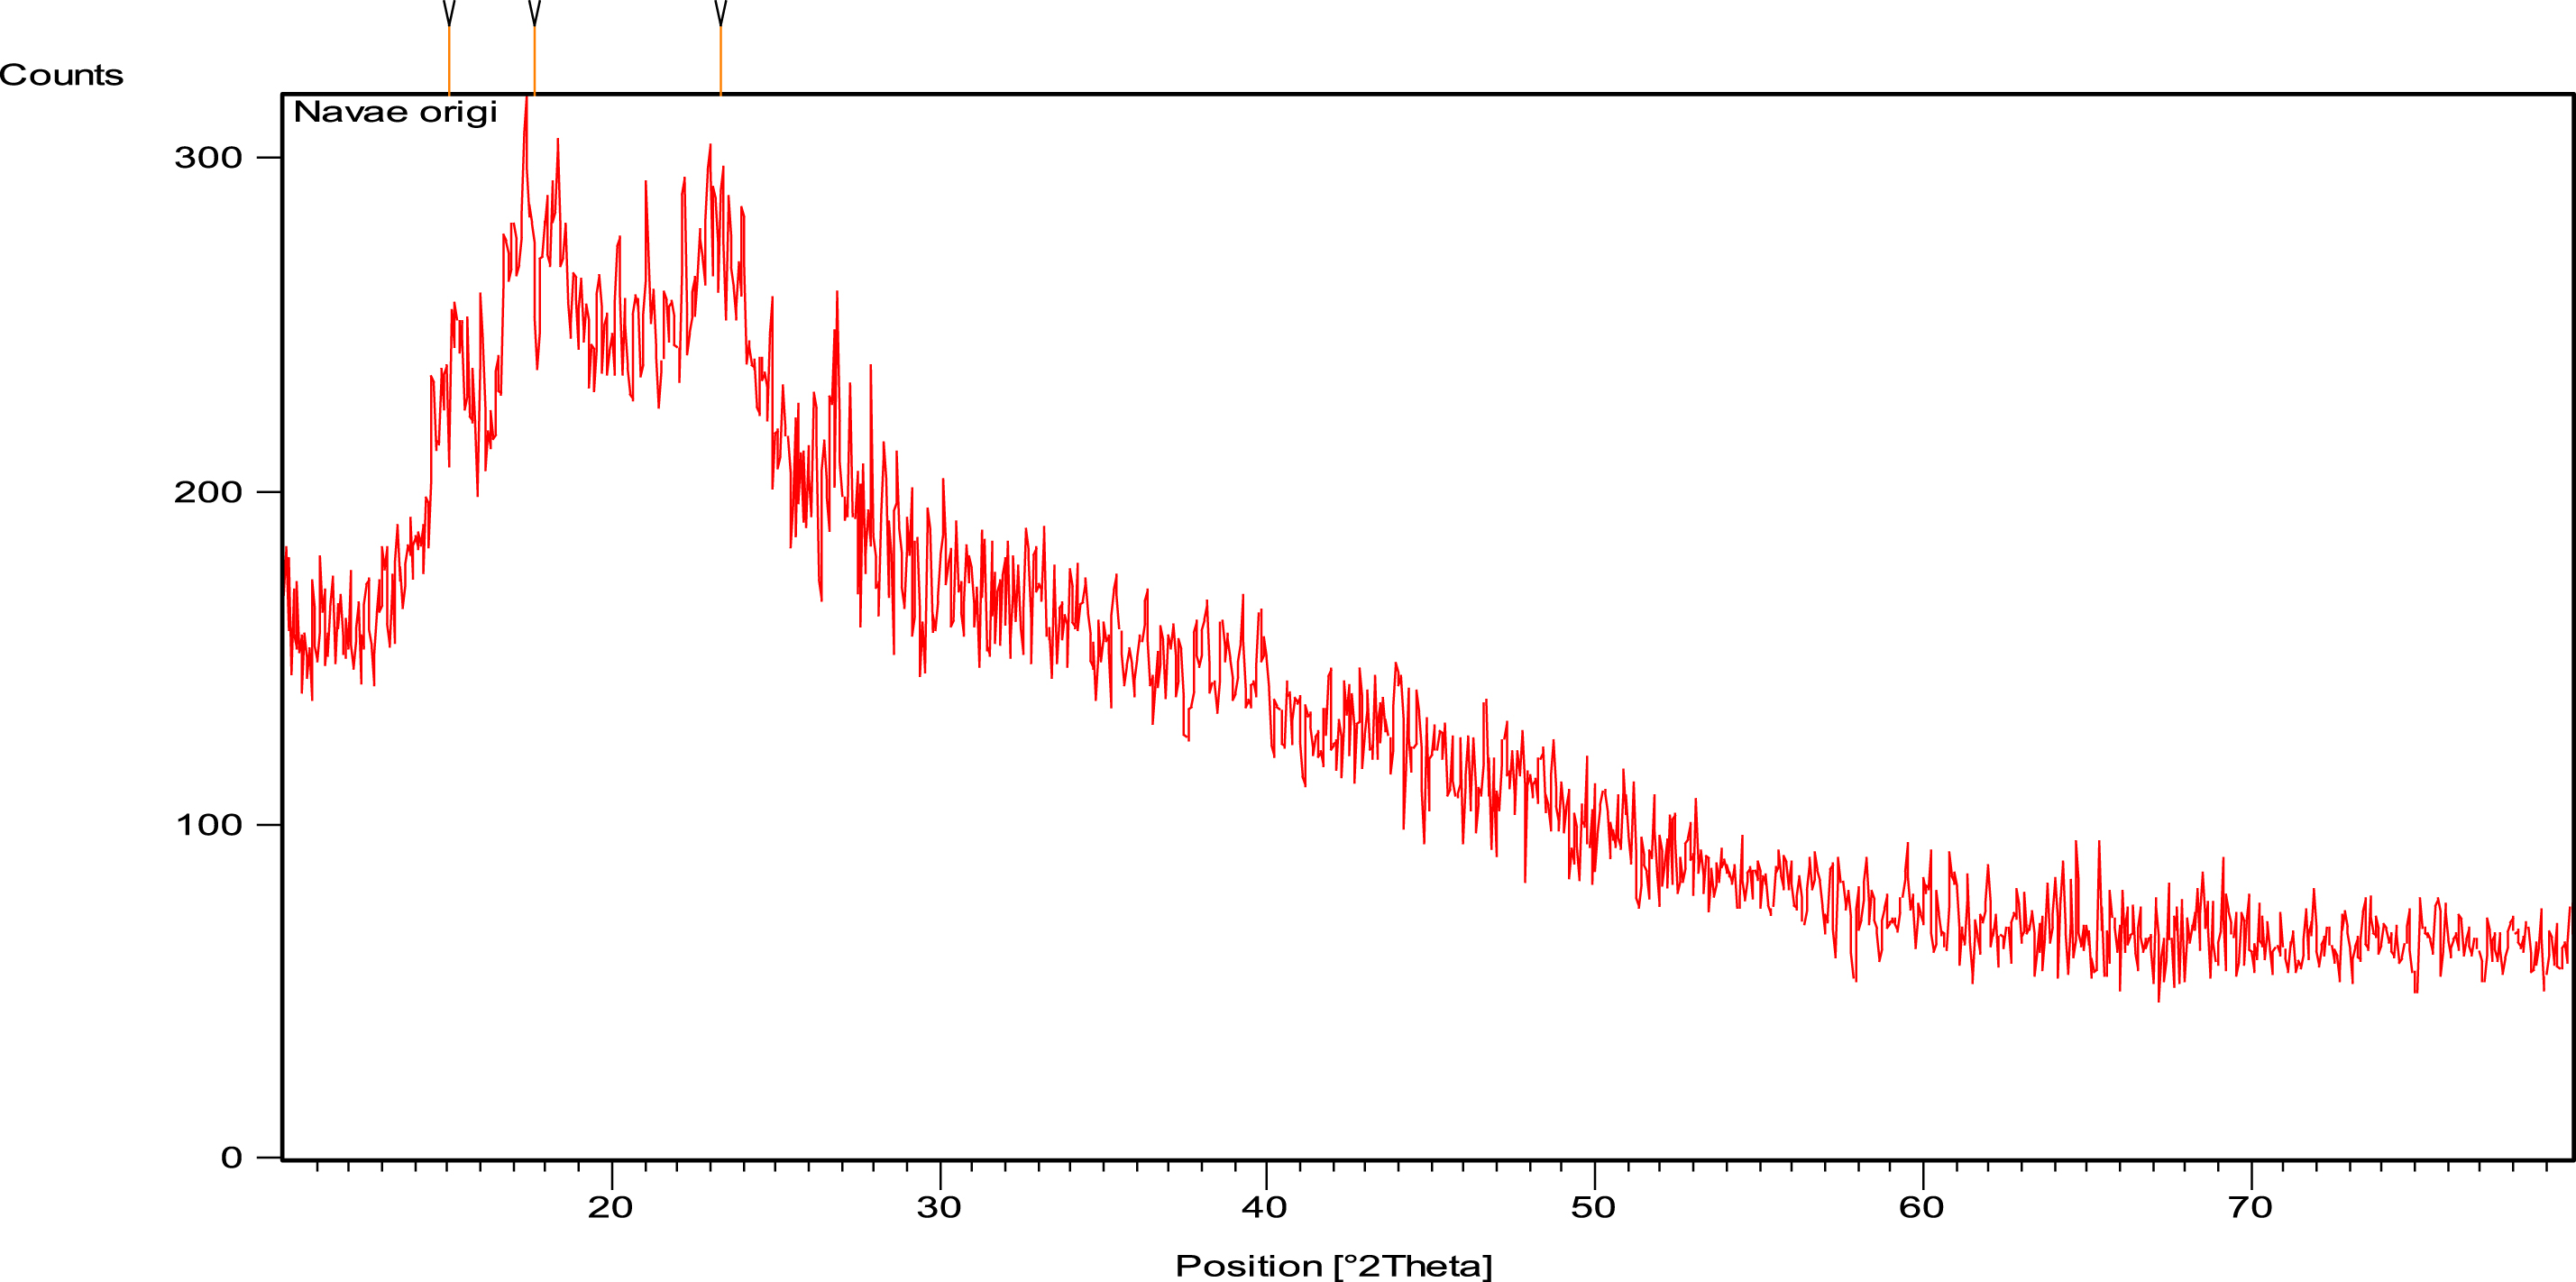
X-ay diffraction pattern of Eugenia Jambolana powder adsorbent.
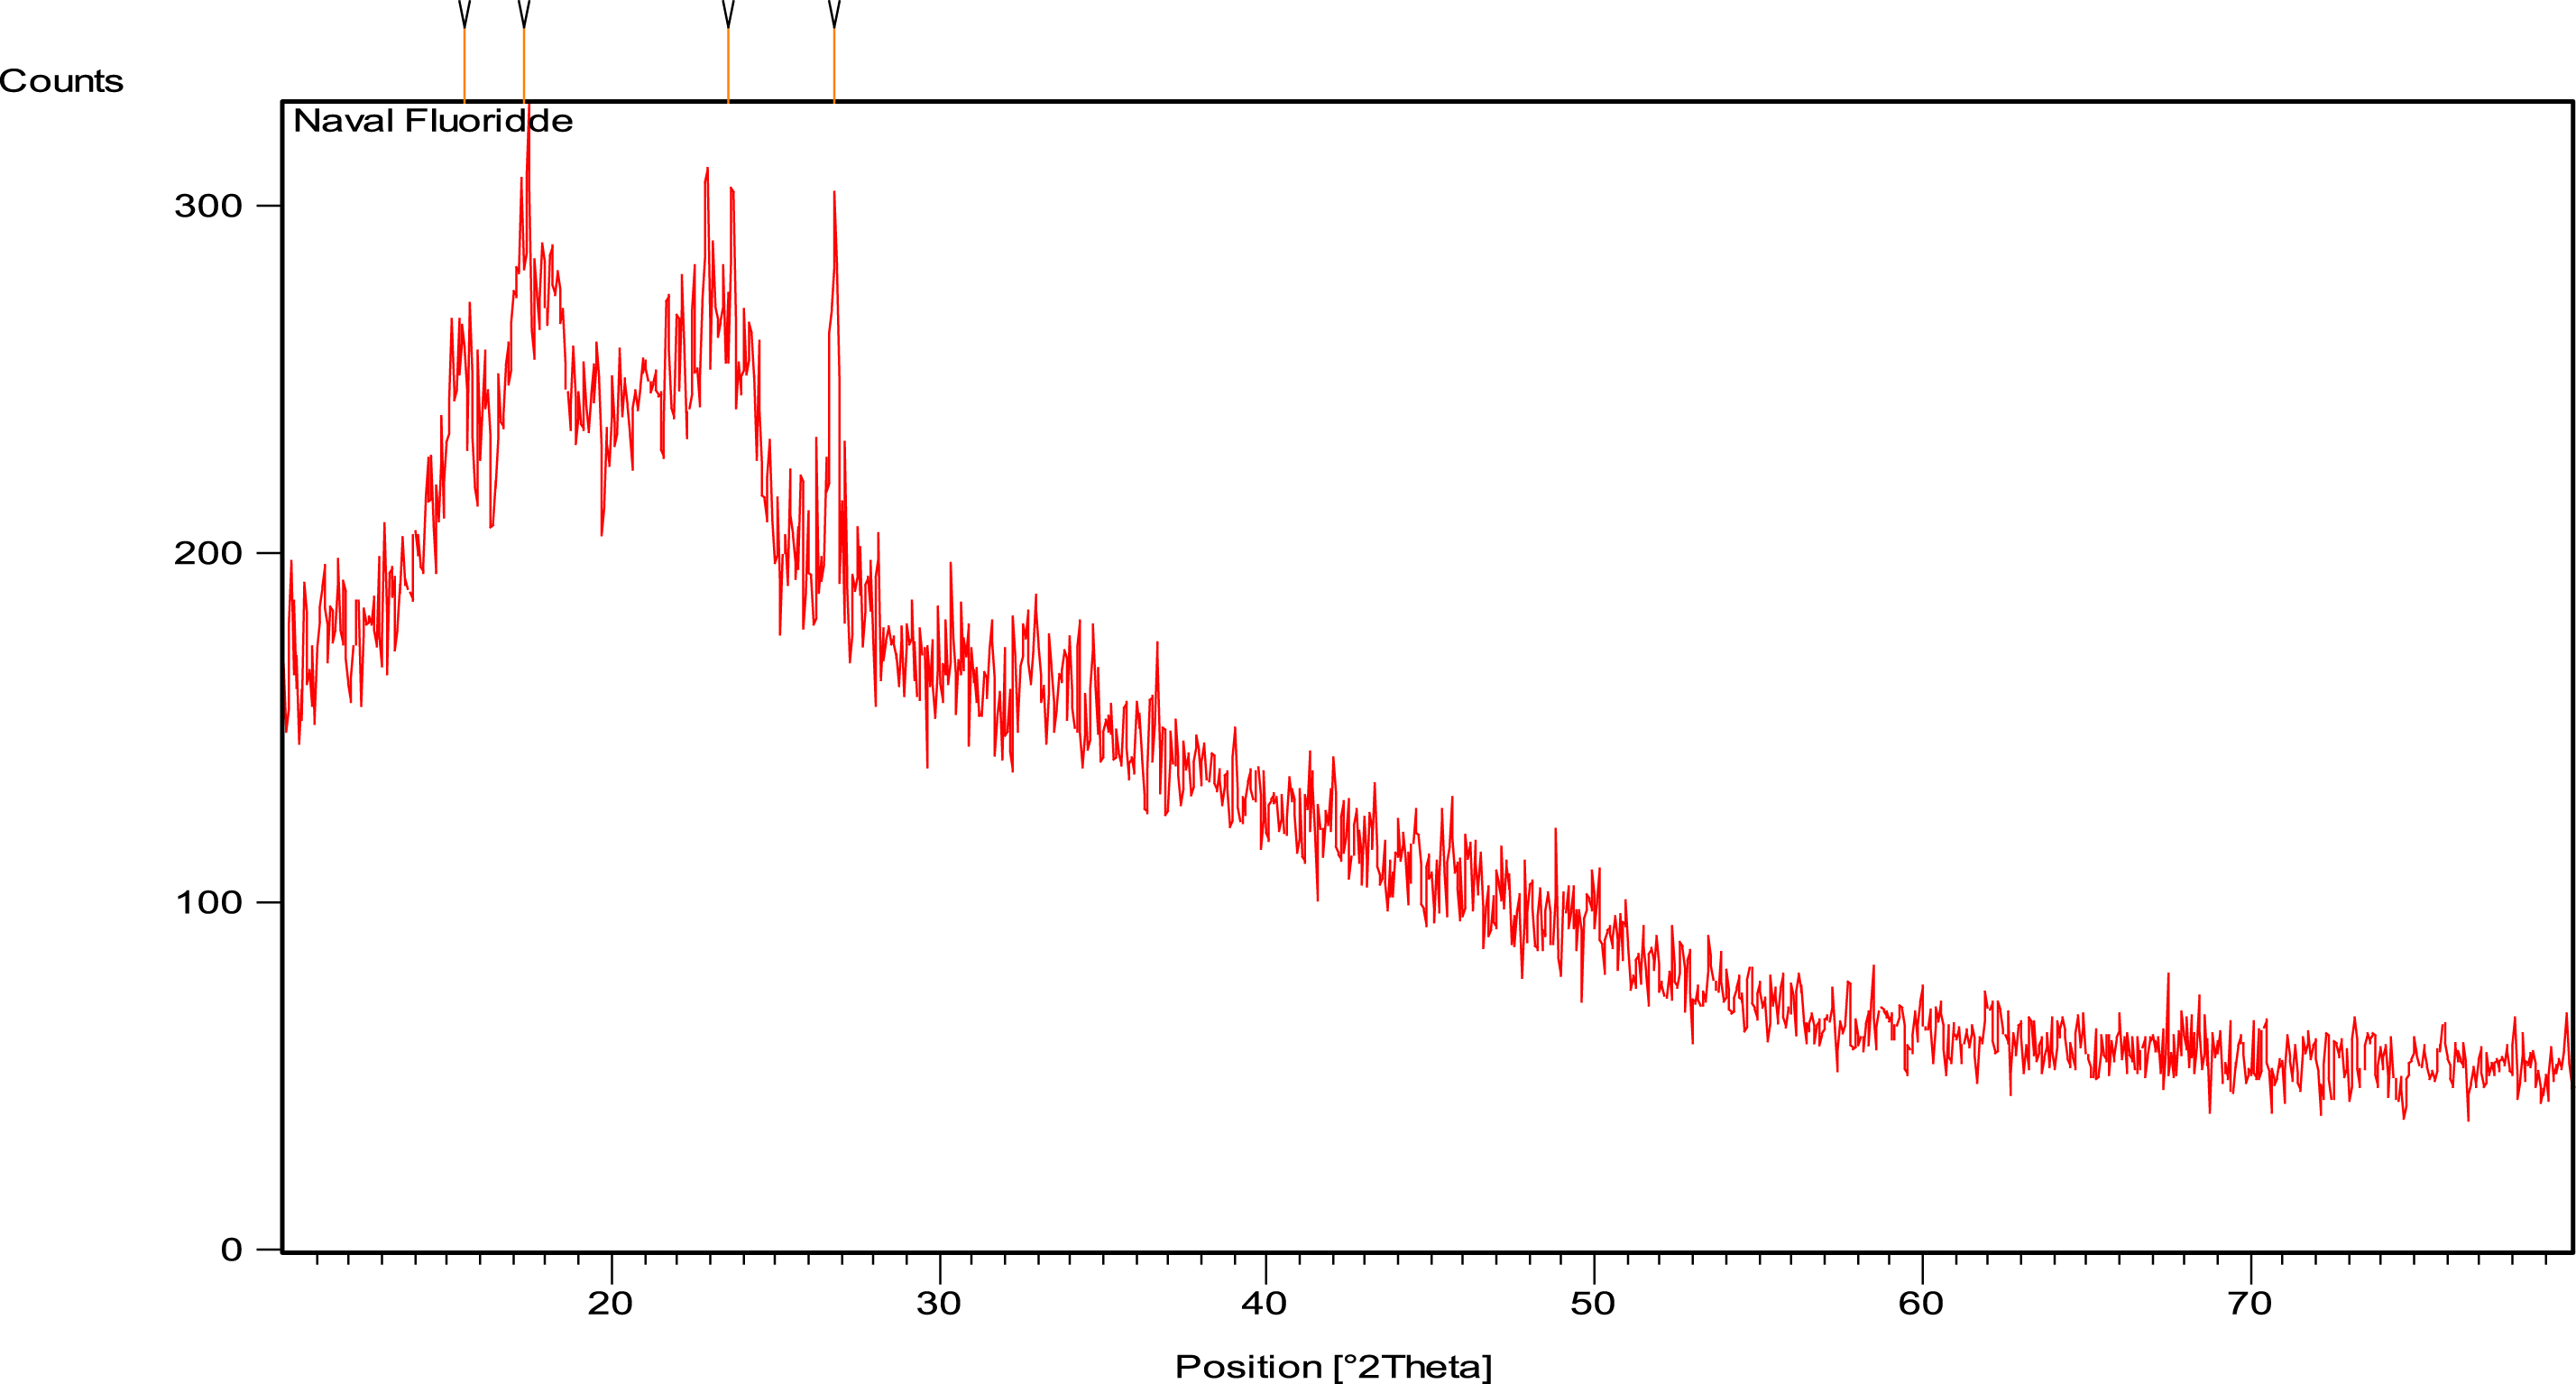
X-ay diffraction pattern of fluoride – adsorbed Eugenia Jambolana powder adsorbent.
X-ray diffraction Data - Before fluoride adsorption
X-ray diffraction Data - After fluoride adsorption
The effective removal of fluoride ions from wastewater is achieved via our natural adsorbent, the ayurvedic powder of Eugenia Jambolana. The overall surface morphology and successful adherence of fluoride ions before and after the reaction is studied via FT-IR, XRD, and SEM analysis. The fluoride removal at a lower concentration is easily achieved by the smaller particle size of the adsorbent powder. It is also examined that the amount of fluoride ions removed from water is dependent on several factors such as contact time, pH, and adsorbent dosage. We found that the maximum percentage of fluoride removal and adsorption capacity increased from 79% to 99% and 100 mg / L respectively, for 100 mg / L of fluorinated water under minimal adsorption conditions (reaction time: 1 hr, adsorbent volume: (1 g/ L, solution pH: 6.9 and mixing speed: 120 rpm). The overall adsorption data of our natural adsorbent fitted well with Freundlich adsorption isotherm with maximum correlation coefficient value indicating adsorption under different surface layers. For each adsorbent, the optimal pH for maximal fluoride removal differs. The theoretical models of Freundlich and Langmuir accurately represented the findings of this study. The natural adsorbent also rendered pronounced reactivity towards low fluorinated containing water. This research reveals that a cost-effective, environmentally compatible ayurvedic powder adsorbent can replace the commercially available adsorbents in removing the maximum amount of contaminants with a compact modular approach.
Declaration of competing interest
We declare that we have no known competing financial interests or personal relationships that could have appeared to influence the work reported in this paper.
Funding declaration
This research did not receive any specific grant from funding agencies in the public, commercial, or not-for-profit-sectors.
Footnotes
Acknowledgments
One of the authors J. Sumathi expresses her sincere thanks to Dr. Prakash Periakaruppan, Assistant Professor, Department of Chemistry, Thiagarajar College, Madurai, Tamil Nadu, India, for his useful discussions, tremendous care and continual support.