The hexagermane Pri3Ge(GePh2)4GePri3 (1) can adopt four different conformations by rotations about its germanium –germanium single bonds that differ in energy across an energy range of 31.63 kJ/mol, with the trans-coplanar arrangement having the lowest energy. Conformational changes can occur among these four structures resulting in the observation of thermochromic absorbance spectra both in solution and in the solid state. Bathochromic shifts of 5 nm and 15 nm were observed in solution and in the solid state with increasing temperature. Compound 1 is also luminescent both in solution and in the solid state. The solution emission spectra are solvent dependent and the solid state emission maxima were shown to be temperature dependent. When 1 is excited at 300 nm in the solid state at 80 K its emission spectrum contains a broad emission peak in the visible region and this emission can be observed with the naked eye. The indirect band gap of 1 was determined to be 3.25 eV, which is consistent with investigations on other related oligogermane systems.
Catenated compounds of germanium represent an interesting class of compounds due to their inherent σ-delocalization. In these compounds, the bonding electrons in the germanium –germanium single bonds are delocalized across all or a portion of the germanium –germanium backbone rather than being localized between two individual germanium atoms [1–3]. The silicon-[4–6] and tin-containing [7, 8] congeners of these compounds also possess σ-delocalization, but the chemistry and properties of the germanium-based systems have not been investigated to the same extent as their lighter and heavier congeners.
The σ-delocalization present in these heavy group 14 element catenates results in interesting optical and electronic properties. These compounds typically absorb light in the ultraviolet region of the electromagnetic spectrum, and their absorbance maxima are dependent on the identity of the elements in the backbone of the molecule, the number of catenated atoms, and also the nature of the organic substituents attached to the element –element backbone. A wide range of UV/visible spectral data have been reported for the silicon, germanium, and tin catenates but their emissive behavior has received less attention, particularly in the case of germanium. Some rare examples include the luminescent behavior of the polygermanes [n(C6H13)2Ge]n [9, 10] and [(pMe3SiOC6H4)2Ge]n,[11] where the emissive behavior was proposed to result from conformational changes in these molecules upon excitation by UV light.
The hexagermane Pri3Ge(GePh2)4GePri3 (1) was reported in 2013 and was shown to be luminescent [12]. This remains the only hexagermane that could be synthesized and fully characterized using our synthetic methods, and efforts to prepare related derivatives having different substituents at the central four germanium atoms and/or at the terminal two germanium atoms were not fruitful. Subsequently the luminescent properties of (p-CH3C6H4)3GeGeMe3, [13] Ph3GeGe(C6F5)3, [14] and (p-CH3C6H4)3GeGeMe2Ge(p-CH3C6H4)3, [14] and Pri3Ge(GePh2)3GePri3 [15] have also been reported.
In the present study the absorbance and emission properties of the hexagermane 1 are described. The investigations described herein include the variable temperature absorbance of 1 in solution and in the solid state as well as the emission of 1 in both toluene and CH2Cl2 solution and also its variable temperature emission in the solid state using two different excitation wavelengths. The optical band gap of 1 has also been determined and the structures of four different conformations of 1, as well as their relative energies, have been calculated using DFT.
Experimental section
Materials
Compound 1 was prepared according to the literature procedure [12].
Solution state absorbance and emission measurements
Variable temperature absorbance measurements were conducted using a 0.25 M solution of 1 in toluene solution using a CARY 5000 UV-VIS-NIR spectrometer. Solution emission data were recorded using a Horiba Fluorolog 3-22 spectrometer.
Solid state variable temperature absorbance and emission measurements
Spectral analyses were conducted using a Fluorolog 3-222 fluorimeter (Horiba Scientific) equipped with a continuous wave Xe lamp (450 W) and a R928 photomultiplier tube detector. Temperature-dependent steady-state spectra were collected on 5 % (w/w) 1/BaSO4 (BaSO4, 99.9%, Sigma Aldrich) mixtures that were prepared in a nitrogen filled glove box. These mixtures were loaded into a VPF-800 variable temperature stage (Janis Research Company, LLC). The stage was equipped with a custom made sample holder consisting of a copper block with a 23 mm diameter by 0.8 mm deep sample cavity. Powdered samples were held in place by a fluorescence free UV grade fused silica window secured by a stainless steel retainer and four spring-loaded screws. A Lake Shore 335-3060 controller (Lake Shore Cryotronics, Inc.) and a thermocouple directly connected to the copper holder provided temperature readings with±0.2 K accuracy. Samples were degassed at 300 K for ∼ 8 h under vacuum (<1 mTorr). Then they were cooled to 77 K. Steady state absorbance and emission spectra were collected in the 80 –440 K temperature range at 40 K intervals. A hearing rate of 5 K/min was used and samples were allowed to dwell for ∼ 10 min at the target temperature prior to data collection. A slit width of 1 nm was used throughout.
Diffuse reflectance spectroscopy
The diffuse reflectance spectrum of 1 was collected using a Fluorolog 3-222 fluorometer equipped with a 80 mm integrating sphere (Horiba Scientific). BaSO4 was used as a reference. The spectrum was obtained as the ratio (R∞) of the emission spectrum of 1 to that of the reference. Emission spectra were collected by synchronously scanning both the excitation and emission monochromator at the same wavelength between 275 and 800 nm. The Kubelka-Munk function F(R∞) computed as F(R∞) = (1 - R∞)2/2R∞ was used as a proxy of the sample’s absorbance. The indirect band gap (Eg) was estimated using a Tauc plot in which the product [photon energy x F(R∞)]1/2 was plotted as a function of the photon energy, giving a value Eg = 3.25 eV (381 nm).
DFT Calculations
Gaussian 03 was used for all computations [16]. Energy calculations and geometry optimizations were performed using the hybrid density functional method including Becke’s three-parameter nonlocal exchange functional [17] with the correlation functional of Lee-Yang-Parr, B3LYP. The 6-31G* basis set was employed for all atoms [18]. All atomic positions are optimized without geometry constraints.
Results and discussion
Structures and relative energies of the four conformations of 1
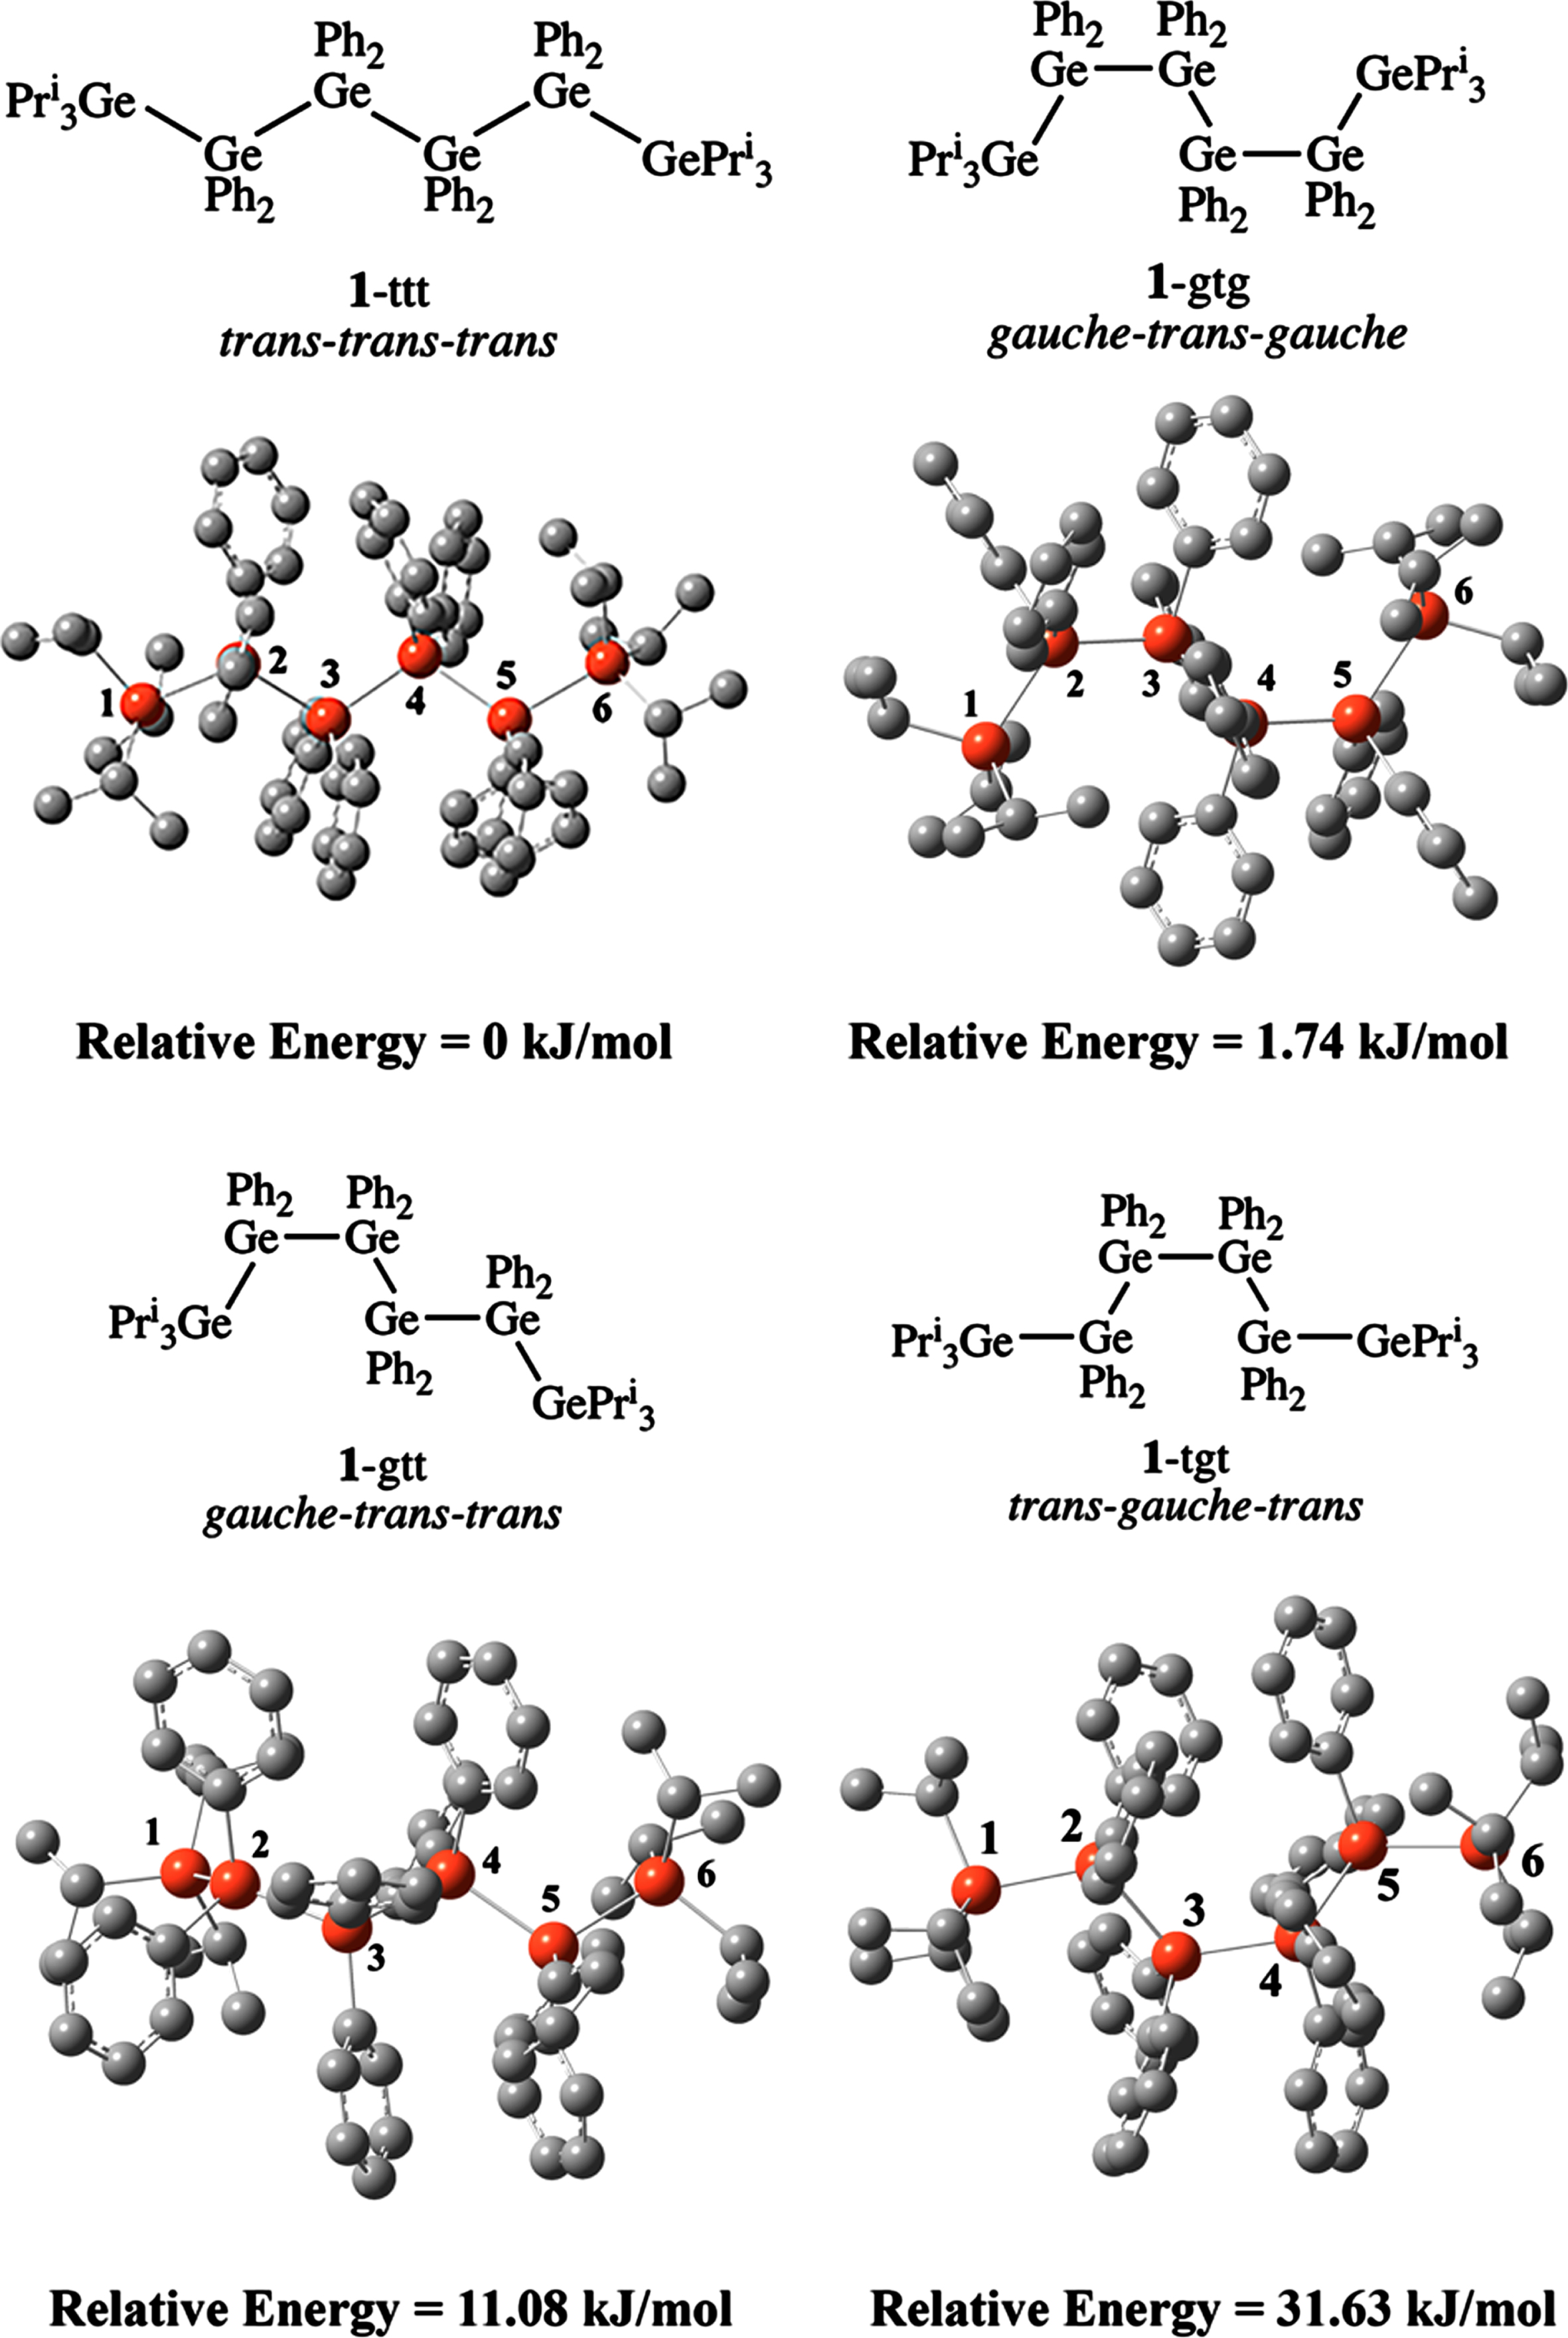
The hexagermane 1 can be arranged in four different conformations by rotation about the germanium –germanium single bonds. The four arrangements were calculated by DFT in the gas phase using the B3LYP/6-31 G(d) functional including the Grimmes D3 dispersion correction. The structures of the four conformations and their relative energies are shown in Fig. 1 and their calculated bond distances and angles are given in Table 1. The bond distances and angles for the experimentally determined X-ray structure of 1 are also shown in Table 1. As expected, the trans-coplanar or trans-trans-trans conformation (1-ttt) is the lowest in energy since this conformation minimizes the steric interactions among the six germanium atoms. The 1-gtg conformation lies only slightly higher in energy than 1-ttt by 1.74 kJ/mol, while the 1-gtt and 1-tgt conformations are higher in energy than 1-ttt by 11.08 and 31.63 kJ/mol, respectively.
Ball and stick diagrams and relative energies of the four calculated structures of 1.
Bond distances (Å) and angles (deg) for the X-ray structure and four conformations of 1
1, X-raya
1-ttt
1-gtg
1-gtt
1-tgt
d Ge(1)-Ge(2)
2.4670(2)
2.577
2.460
2.476
2.484
d Ge(2)-Ge(3)
2.4715(3)
2.567
2.456
2.458
2.478
d Ge(3)-Ge(4)
2.4745(3)
2.544
2.457
2.487
2.457
d Ge(4)-Ge(5)
2.4715(3)
2.556
2.456
2.477
2.433
d Ge(5)-Ge(6)
2.4670(2)
2.574
2.460
2.446
2.491
∠ Ge(1)-Ge(2)-Ge(3)
117.330(8)
111.2
122.5
113.2
115.8
∠ Ge(2)-Ge(3)-Ge(4)
114.15(1)
119.3
115.4
115.0
124.2
∠ Ge(3)-Ge(4)-Ge(5)
114.15(1)
118.8
115.4
119.8
120.8
∠ Ge(4)-Ge(5)-Ge(6)
117.330(8)
117.0
122.5
130.9
117.1
aX-ray crystallographic data are taken from reference [12].
The calculated bond lengths in 1-ttt are longer than those in the X-ray structure of 1, [12] which is to be expected since the calculated structural parameters for 1-ttt were determined in the gas phase. The bond angles in 1-ttt also are different than those in the X-ray structure for the same reason. The bond lengths in 1-gtg are shorter than those in 1-ttt, which leads to a greater degree of steric crowding in the 1-gtg conformation. The largest distortion is the compression of the two terminal Ge(1) –Ge(2) and Ge(4) –Ge(5) bond distances by 0.117 and 0.114 Å, respectively. The two terminal Ge –Ge –Ge bond angles, which include these four atoms, also are more obtuse than those in 1-ttt by 10.3°.
In the two higher energy conformations, the bond lengths and angles differ less significantly from those in 1-ttt in general. However, in 1-gtt, there is a more significant elongation of the Ge(4) –Ge(5) bond distance by 0.128 Å and the Ge(4) –Ge(5) –Ge(7) bond angle is more obtuse than that in 1-ttt by 13.9 °. The terminal Ge –Ge bond distances in 1-gtt are also affected by the conformational change from 1-ttt. In the 1-tgt conformation, it is the Ge(4) –Ge(5) bond that undergoes the most significant change in length as it is elongated by 0.123 Å compared to 1-ttt and the Ge(2) –Ge(3) –Ge(4) bond angle is more obtuse by 4.9 °.
UV/visible absorption of 1 in solution and in the solid state
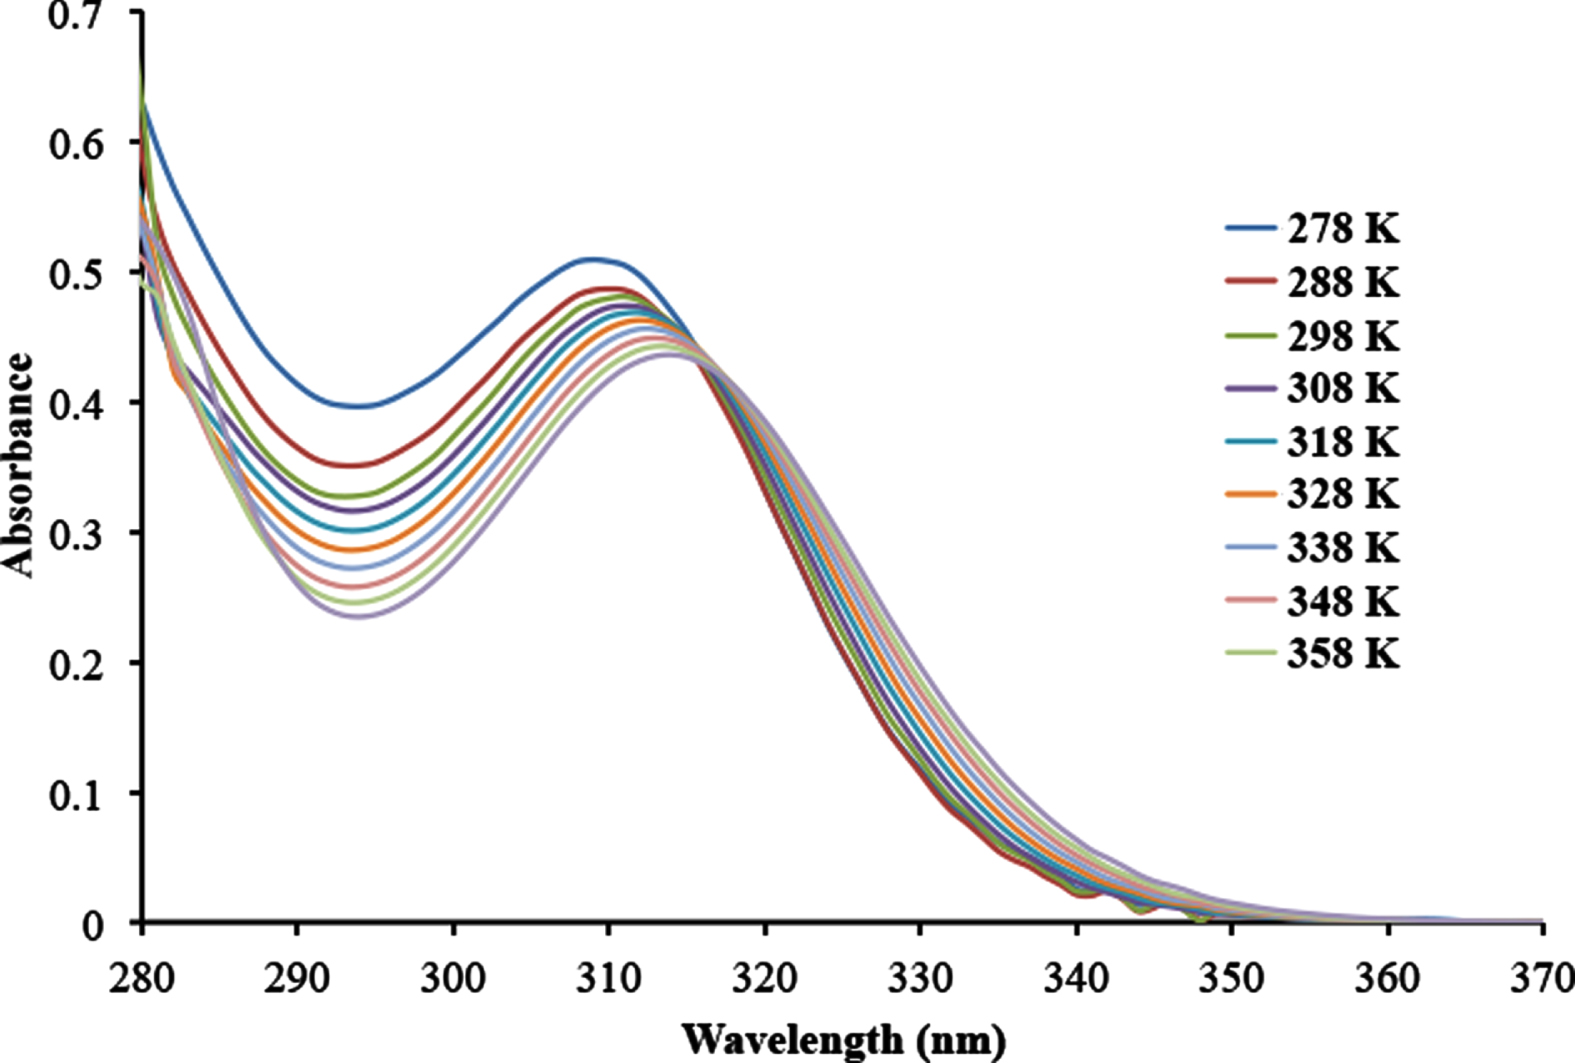
The variable temperature UV/vis spectrum of 1 in toluene solution in the temperature range of 278 –358 K (25 –85 °C) is shown in in Fig. 2. The λmax of the spectrum, which corresponds to a σ → σ* electronic transition, undergoes a bathocromic shift from 309 nm at 278 K to 314 nm at 358 K. The magnitude of this shift in the λmax of 1 is similar to those observed for the polygermanes (nHex2Ge)n and (PhnHexGe)n, although the λmax of both of these polygermanes undergo a hypsochromic shift with increasing temperature of 10 nm and 15 nm, respectively [19]. The hypsochromic shifts in both (nHex2Ge)n and (PhnHexGe)n were attributed to a conformational change that decreased the amount of orbital overlap in these two polygermanes with increasing temperature.
Variable temperature UV/vis spectrum of 1 in toluene solution.
The bathochromic shift in the λmax of 1 is also most likely caused by conformational changes within the molecule. The conformation 1-ttt along with one or more of the other three possible conformations of 1 are likely present in solution at room temperature. Rotation about the germanium –germanium bonds in solution is expected, and the energy of 1-gtg of 1.74 kJ/mol relative to that of 1-ttt renders it highly likely that some 1-gtg is present since at room temperature the available thermal energy is taken to be approximately 2.5 kJ/mol. The relative energies of the 1-gtt and 1-tgt conformations to that of 1-ttt make it unlikely that these two conformations are present at room temperature in any significant amount. As a point of reference, the rotation energy barrier about the C –N bond in amides is on the order of ca. 60 –85 kJ/mol, [20–22] which is far greater than the relative energies of the four conformations of 1.
The behavior of the λmax of 1 with increasing temperature is the opposite of what was observed for the polygermanes (nHex2Ge)n and (PhnHexGe)n. The bathochromic shift with increasing temperature might be explained by the steric contributions of the terminal iso-propyl groups and those of the phenyl substituents at the four central germanium atoms. These large substituents hinder rotation about the germanium –germanium bonds, but as the temperature is increased rotation about these bonds becomes more facile resulting in the conversion of any of the 1-gtg conformer that is present to the more stable 1-ttt conformer. This then likely results in the observed bathochromic shift in the λmax of 1 with increasing temperature.
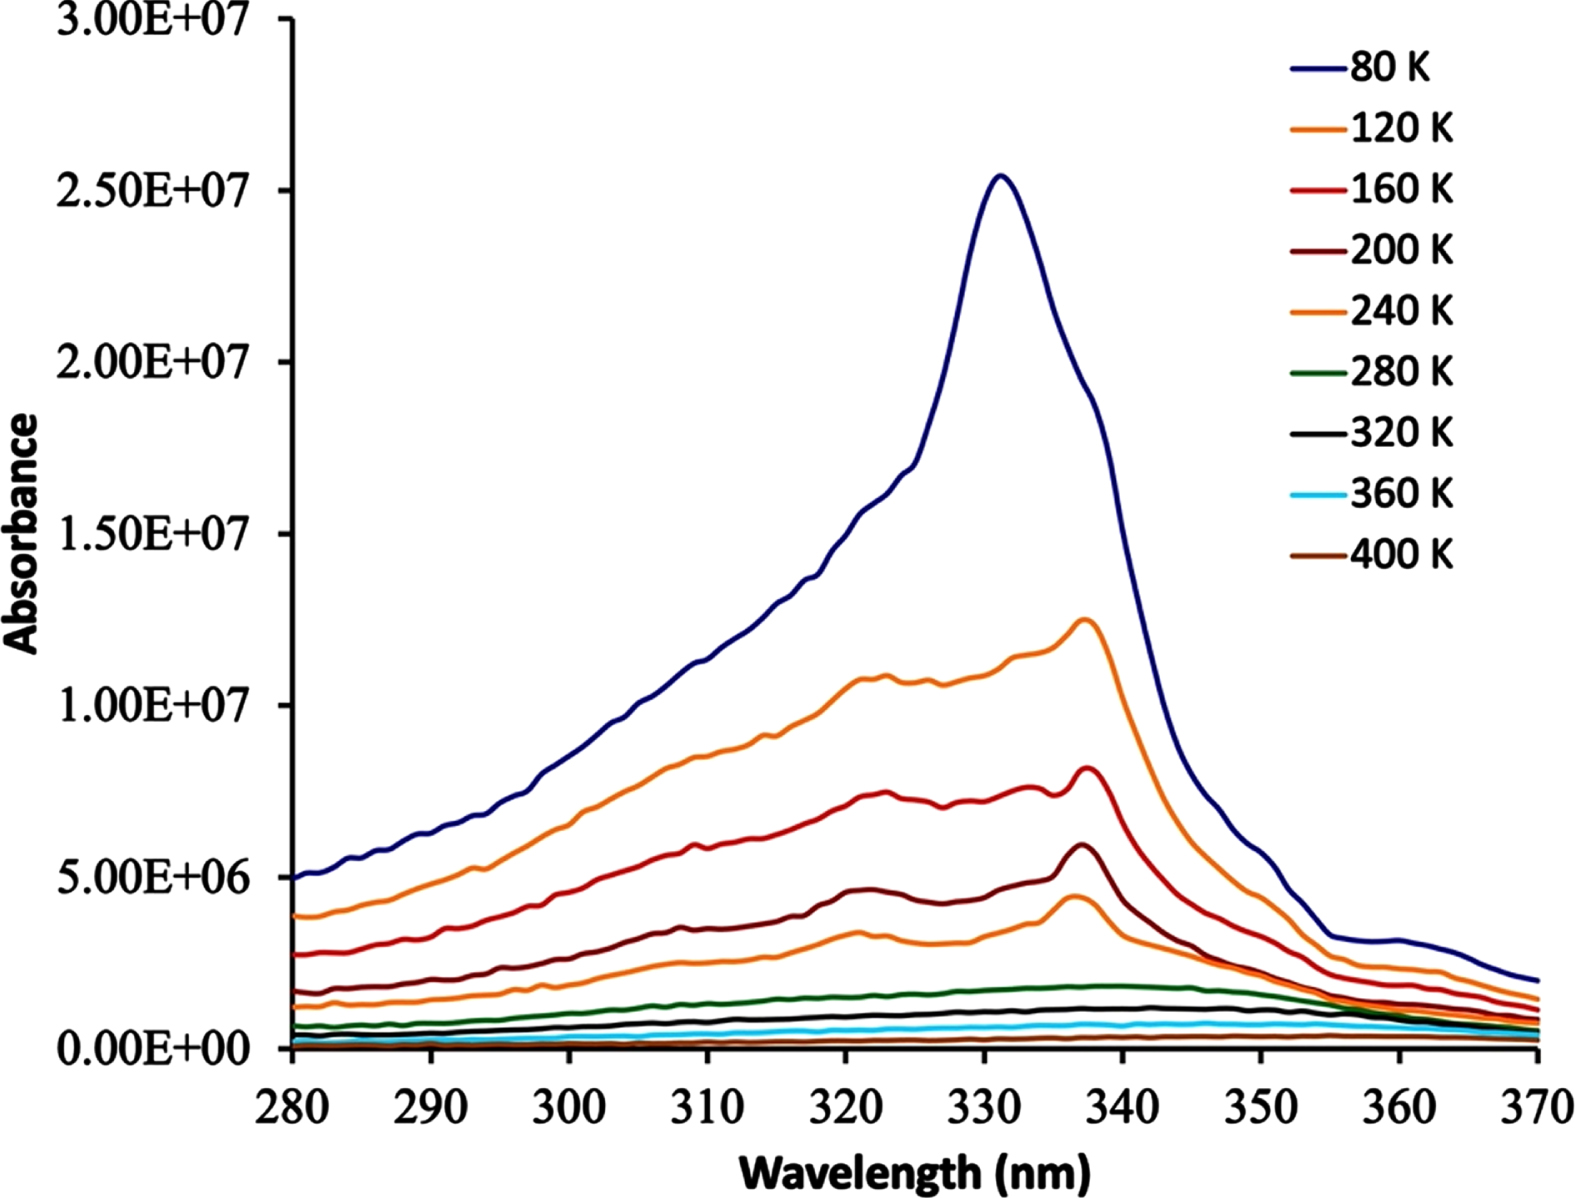
The position of the λmax of 1 is also temperature dependent in the solid state as shown in Fig. 3. At the 80 K, the λmax is at 330 nm and this undergoes a bathochromic shift to 345 nm at 400 K. The magnitude of the bathochromic shift of 15 nm is larger in the solid state than the 5 nm shift observed in solution. The intensity of the absorbance maximum also decreases significantly when increasing the temperature from 80 K to 120 K. The bathochromic shift of the λmax is again attributed to the presence of the 1-ttt and 1-gtg conformers at low temperature that undergo rotations about their Ge –Ge bonds to form primarily the most stable 1-ttt conformation at higher temperatures. Similar effects have been reported for polysilanes and other group 14 polymers in both the solution and solid state, where conformational changes lead to thermochromism [23–28]. For example, the λmax in a series of poly(cyclo)silanes was recently reported to undergo a red shift of 20 nm in changing from a linear conformation to a zig-zag conformation [28].
Variable temperature UV/vis spectrum of 1 in the solid state.
Luminescence of 1 in the solid state and in solution
As was previously reported 1 is also luminescent in solution [12, 29]. Further investigation of its luminescence in solution revealed that the position of the emission maximum λem is solvent dependent. The emission spectra of 1 in toluene and CH2Cl2 solution is shown in Fig. 4. The emission maximum of 1 in CH2Cl2 solution is centered at 370 nm (λex = 310 nm) and in toluene solution the λem is centered at 363 nm (λex = 310 nm) . In addition, some vibrational fine structure was observed in the emission spectrum of 1 in toluene solution. The position of the λem for 1 is similar to those reported for the polygermanes [nHex2Ge]n and [(Me3SiO)C6H4GeMe]n observed at 376 [9, 10] and 369 nm, [11] respectively. The pentagermane Pri3Ge(GePh2)3GePri3 and the trigermane (p-Tol)3GeGeMe2Ge(p-Tol)3 exhibit emission maxima in solution at 380 [15] and 338 nm, [14] respectively, while the digermanes (p-Tol)3GeGeMe3 and Ph3GeGe(C6F5)3 have emission maxima at 286 and 377 nm in solution, respectively [14]. Although the position of the λem varies for these seven compounds there appears to be no definitive trend in the position of the λem with the chain length of the oligo- or polygermane, as there is with the λmax values in these systems. The organic substituents also appear to have a pronounced effect on the position of the λem, as shown with (p-Tol)3GeGeMe3 and Ph3GeGe(C6F5)3.
Emission spectrum of 1 in the toluene (blue line) and dichloromethane (red line) solution (λex = 310 nm).
The hexagermane 1 is also luminescent in the solid state as shown in two separate experiments. A 5 % w/w mixture of 1 and BaSO4 was excited at 340 nm, which is within the range of absorbance maxima of 1 observed on the solid state over the temperature range of 80 –440 K (Fig. 5). The λem undergoes a hypsochromic shift from a peak centered at 410 nm at 440 K to a peak centered at 385 nm at 80 K. The intensity of the emission band increases significantly between 240 and 280 K and is very intense at 80 K relative to its intensity below 240 K. In addition, vibrational fine structure is clearly visible in the temperature range of 240 to 80 K. These data can be compared to the solid state emission spectra of Ph3GeGe(C6F5)3 and (p-Tol)3GeGeMe2Ge(p-Tol)3 that have emission maxima at 373 and 438 nm, respectively [14]. In addition, the digermane (p-Tol)3GeGeMe3 has three distinct emission maxima at 357, 373, and 393 nm in the solid state [14]. Therefore, as was observed with the solution emission data there is no direct correlation between the position of the emission maximum and the length of the germanium –germanium chain.
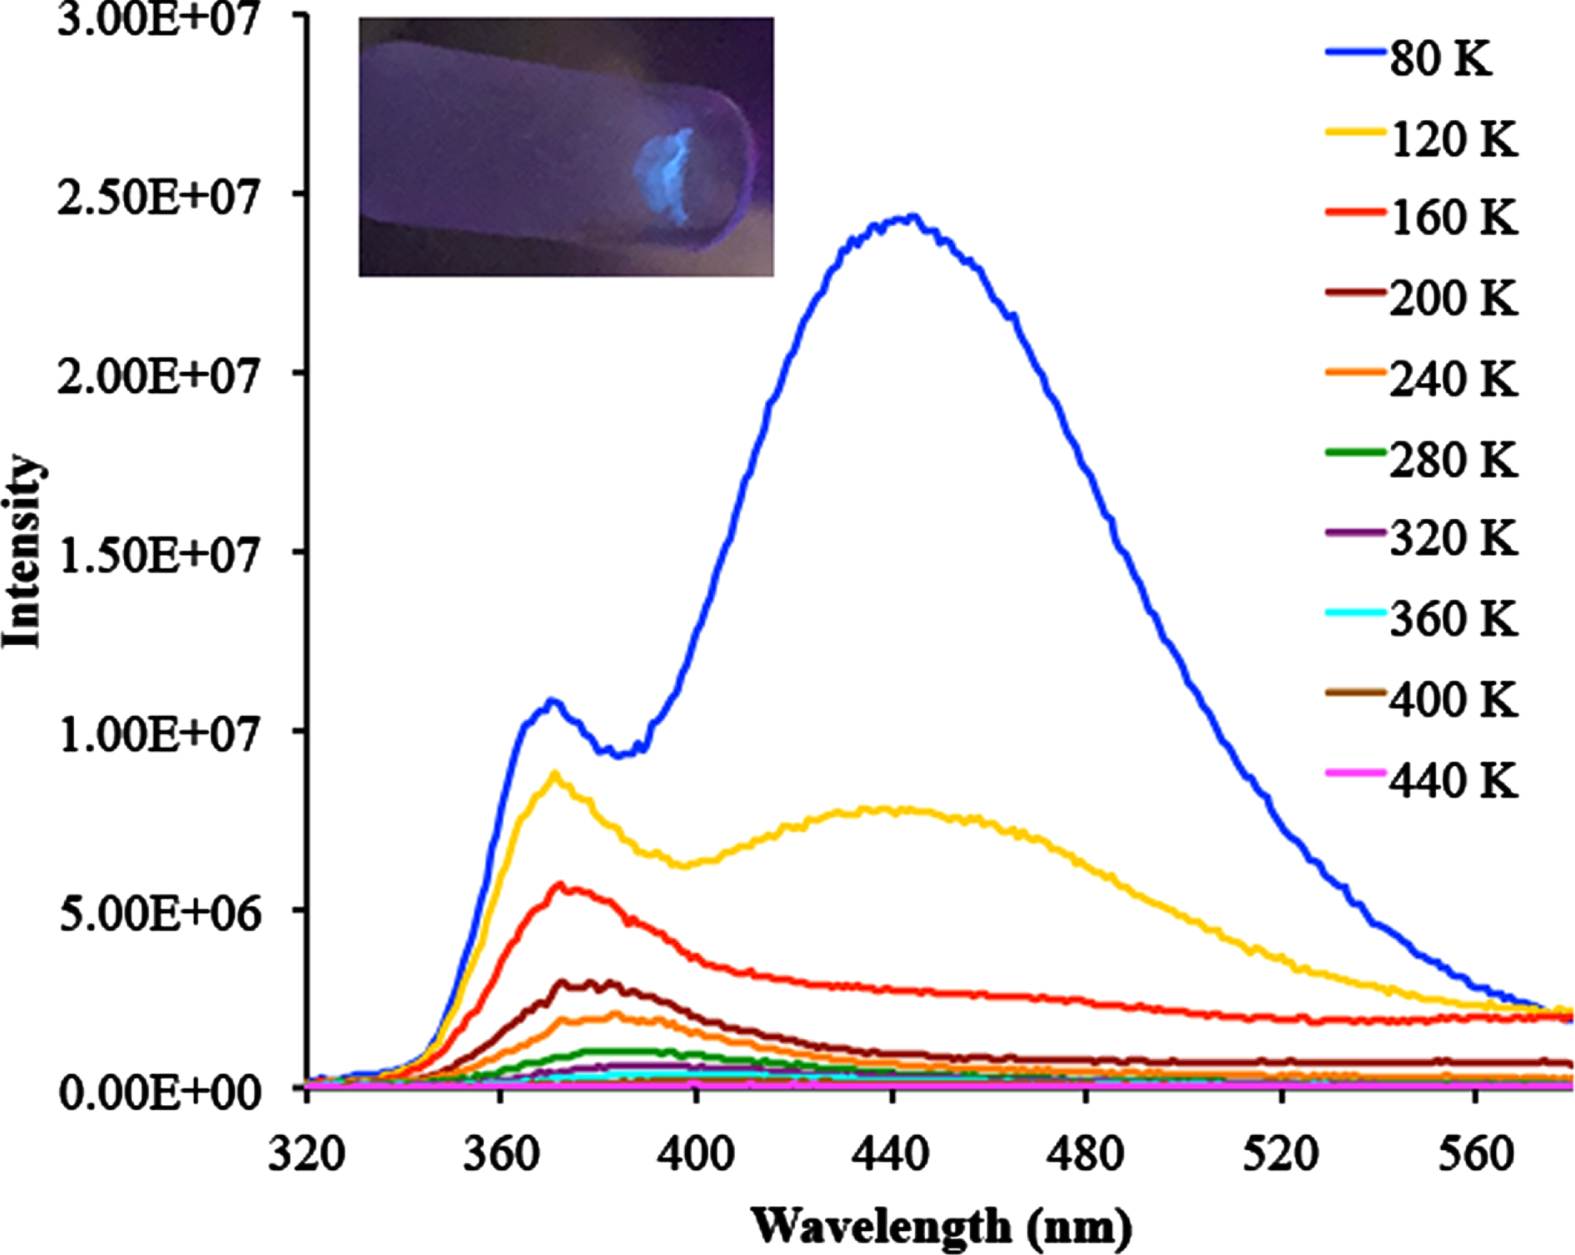
Emission spectrum of 1 in the solid state (λex = 340 nm).
In the second experiment, the sample of 1 was excited at 300 nm rather than at 340 nm over the same temperature range of 80 –440 K, and a different emission spectrum was observed (Fig. 6). When the temperature is decreased from 440 K to 320 K, a broad emission peak centered at 390 nm begins to appear. This peak increases in intensity as the temperature is further decreased and undergoes a hypsochromic shift, and the λem is centered at 370 nm at 150 K. At this temperature, a second extremely broad λem peak centered at 445 nm becomes visible. When the temperature reaches 80 K both λem peaks are clearly visible and the feature at 465 nm is very intense.
Emission spectrum of 1 in the solid state (λex = 310 nm). Inset: Visual observation of the blue emission of 1 under UV light (λex = 254 nm).
The center of the broad peak at 445 is at the cusp of the blue region of the visible spectrum and the peak has an intensity of ca. 1×10⁷ in the wavelength range of 385 –505 nm, which tails into the blue region. The intense blue emission of 1 is visible to the naked eye. An ampoule of solid 1 was cooled to 77 K in a liquid nitrogen bath and the sample was irradiated at 254 nm using a hand-held mineralight lamp and the sample had a blue aura (Fig. 6 inset). To our knowledge, this is the first example of an oligo- or polygermane having an emission in the visible region of the electromagnetic spectrum that can be observed by the human eye, and these types of molecules might have the potential for use as emissive materials at low temperature.
The blue emission of 1 shown in Fig. 6 is due to phosphorescence but precise measurement of the fluorescent lifetime was complicated by the fact that there appeared to be two different species emitting at 445 nm since the emissive decay was biexponential at both 80 and 120 K, and also because the decay was not complete even after a time of 1000 ms. One of these species had a lifetime on the order of 35 –45 ms, while the other had a much longer lifetime on the order of 210 –230 ms. Since it is probable that two or more conformers of 1 are present at these temperatures upon exciattion this could account for the detection of multiple emissive species. The lifetime of the emission at 385 nm shown in Fig. 5 could not be resolved under the experimental conditions since the decay for this peak was faster than 10μs.
Numerous attempts were made to ascertain the origin of the emission in 1 using TD-DFT calculations but these did not prove fruitful. However, the emission results were reproducible in both the solid state and in solution and the sample of 1 was confirmed to be analytically pure by elemental analysis, and therefore it is definitely the hexagermane that is the source of the blue emission peak centered at 445 nm. The observed emission likely incorporates triplet state to singlet state transitions from multiple conformations of 1 since conformational changes from 1-ttt likely can occur upon excitation due to their proximity in energy
Optical band gap of 1 in the solid state
In addition to the absorbance an emission data, the optical band gap of 1 in the solid state was estimated using diffuse reflectance spectroscopy. This was achieved by simultaneously scanning the excitation and emission monochromators at the same wavelength between 275 and 800 nm. The Kubelka-Monk function F(R∞) was calculated as a representation of the absorbance and the resulting plot is shown in Fig. 7. The absorbance onset was observed at 380 nm and the local maximum absorbance was observed at ca. 305 to 310 nm. The indirect band gap Eg was estimated using a Tauc plot of the term [photon energy x F(R∞)]1/2 as a function of the photon energy (Fig. 7) giving a value for Eg of 3.25 eV for 1.
Plot of the Kubelka-Munk function F(R∞) of 1 as a function of wavelength. Inset: Tauc plot to estimate the indirect band gap (Eg) of 1.
The indirect band gaps of the six different oligomeric group 14 compounds (p-Tol)3GeSiMe2Ge(p-Tol)3, (p-Tol)3GeGeMe2Ge(p-Tol)3, (p-Tol)3GeSiMe2SiMe3, (p-Tol)3GeGeMe3, (C6F5)3GeGePh3, and Ph3SnGe(SiMe3)3 were all measured to be 3.3±0.1 eV using the same method to determine the indirect band gap for 1. Band gaps for the larger polygermanes [Ph2Ge]n, [PhHGe]n, and [GeH2]n were calculated using DFT to be 2.13, 2.72, and 3.03 eV, respectively, [30] but unlike the aforementioned oligogermanes and mixed group 14 compounds these polygermanes possess a direct band gap rather than an indirect band gap. These data indicate that the estimated band gap for 1 is similar to those determined for other oligomeric group 14 compounds but is larger than those calculated for polygermane systems. This is expected since large polymeric systems possess a greater degree of orbital overlap and therefore have a lower HOMO –LUMO gap. Also, the calculated band gaps for the polysilanes [Ph2Si]n, [31] [PhHSi]n, [31] and [PhMeSi]n [32] of 3.72, 4.53, and 3.5 eV, respectively, are larger than those for oligo- and polygermanes including 1. This is consistent with the fact that elemental silicon has a larger band gap than elemental germanium, that have been measured to be 1.12 and 0.66 eV, respectively [33].
Conclusions
The hexagermane 1 can adopt four possible conformations by rotations about its germanium – germanium single bonds. The lowest in energy of these is the trans-coplanar 1-ttt conformation and the energies of the other three conformations of 1 lie within 31.63 kJ/mol of that of 1-ttt, with that of the 1-gtg conformation having an energy 1.74 kJ/mol higher than that of 1-ttt. This indicates that 1 can likely adopt both the 1-ttt and 1-gtg conformations in solution and in the solid state and that conformational changes among these two species are possible by variation of the temperature.
As a result, the absorbance spectra of 1 are thermochromic and exhibit a bathochromic shift of the absorbance maximum as the temperature is increased by 15 nm in the solid state over a 320 K temperature range and by 5 nm in solution over a 80 K temperature range. The bathochromic shift observed in both cases can be attributed to the aforementioned conformational changes, where more of the most stable 1-ttt conformation becomes prevalent as the temperature increases. As previously reported, 1 is luminescent in solution [12] and further investigations have revealed that its emission maximum in solution is solvatochromic. In toluene the emission maximum was observed at 363 nm while in CH2Cl2 solution the emission maximum was at 370 nm.
Compound 1 is also luminescent in the solid state. When 1 is excited at 340 nm, which is near its absorbance maximum in the solid state 1 exhibits temperature dependent emission spectra with maxima ranging from 410 nm at 440 K to 385 nm at 80 K. The intensity of the emission increases with decreasing temperature and vibrational fine structure was observed below 240 K. In addition, when 1 is excited at 300 nm, which is near its absorbance maximum in solution, 1 again exhibits temperature dependent emission spectra with a well-defined emission maximum becoming visible at 390 nm at 320 K that undergoes a blue shift to 370 nm at 150 K. Below 150 K a second broad emission maximum appears at 445 nm that ultimately undergoes a blue shift to 465 nm at 80 K that is in the blue range of the visible portion of the electromagnetic spectrum. This second emission is very intense at 80 K and the emission can be observed by the naked eye when a sample of 1 is immersed in a bath of liquid nitrogen and excited using a mineralight UV lamp.
The indirect band gap of 1 was also measured and was determined to be 3.25 eV. This value is in accord with the indirect band gaps determined for several other oligogermanes and mixed group 14 element oligomers that are in the range of 3.3±0.1 eV [14]. As expected, the band gap for 1 and the other oligogermanes are larger than those calculated for larger polymeric systems.
In conclusion, the findings described herein indicate that oligogermanes such as 1 have the potential to function as emissive materials that may have emission maxima in the visible region. Although there is no direct systematic correlation of the emission maxima with chain length, as exists for the solution absorbance maxima, altering the composition of the oligogermane does affect the position of the emission maximum. Compounds such as 1 and other oligogermanes also appear to have the potential to function as semiconductive molecular species, and these attributes might also be modified by changing their composition.
Footnotes
Acknowledgments
This work was supported by a grant from the National Science Foundation (Award No. CHE-1464462). The computational component of this work was performed at the Oklahoma State University High Performance Computing Center, funded in part by an instrumentation grant OCI-1126330 from the National Science Foundation. FAS and CSW gratefully acknowledge Federico Rabuffetti, S. Sameera Perera, and Dinesh Amarasinghe (Department of Chemistry, Wayne State University) for acquiring the solid state absorbance and emission data.
References
1.
AmadorugeM.L. and WeinertC.S., Singly Bonded Catenated Germanes: Eighty Years of Progress, Chem Rev108 (2008), 4253–4294.
2.
WeinertC.S., Synthesis, Structures, and Properties of Linear and Branched Oligogermanes, Dalton Trans (2009), 1691–1699.
3.
WeinertC.S., Synthetic, structural, and physical aspects of organo-oligogermanes, Comments Inorg Chem32 (2011), 55–87.
4.
BeckmannJ., Oligosilanes, in: D.M.P. Mingos, R.H. Crabtree (Eds.) Comprehensive Organometallic Chemistry III, Elsevier, Oxford, UK, (2007), pp. 409–512.
5.
MillerR.D. and MichlJ., Polysilane High Polymers, Chem Rev89 (1989), 1359–1410.
6.
WestR., The Polysilane High Polymers, J Organomet Chem300 (1986), 327–346.
7.
SitaL.R., Heavy-Metal Organic Chemistry: Building with Tin, Acc Chem Res27 (1994), 191–197.
8.
SitaL.R., Structure/Property Relationships of Polystannanes, Adv Organometallic Chem38 (1995), 189–243.
9.
TachibanaH. and TokuraY., Optical properties of polysilanes and related materials, Synth Met71 (1995), 2005–2008.
10.
TachibanaN., KawabataY., YamaguchiA., MoritomoY., KoshiharaS. and TokuraY., Electronic structure of poly(dihexylgermane): A comparison with poly(dihexylsilane), Phys Rev B45 (1992), 8752–8755.
11.
HuoY. and BerryD.H., Synthesis and Properties of Hybrid Organic-Inorganic Materials Containing Covalently Bonded Polygermanes, Chem Mater17 (2005), 157–163.
12.
RoeweK.D., RheingoldA.L. and WeinertC.S., A Luminescent and Dichroic Hexagermane, Chem Commun49 (2013), 8380–8382.
13.
ZaitsevK.V., LermontovaE.K., ChurakovA.V., TafeenkoV.A., TarasevichB.N., PoleshchukO.K., KharchevaA.V., MagdesievaT.V., NikitinO.M., ZaitsevaG.S. and KarlovS.S., Compounds of Group 14 Elements with an Element–Element (E=Si, Ge, Sn) Bond: Effect of the Nature of the Element Atom, Organometallics34 (2015), 2765–2774.
14.
ZaitsevK.V., TafeenkoV.A., OprunenkoY.F., KharchevaA.V., ZhanabilZ., SuleimenY., LamK., ZaitsevV.B., ZaitsevaA.V., ZaitsevaG.S. and KarlovS.S., Molecular Oligogermanes and Related Compounds: Structure, Optical and Semiconductor Properties, Chem Asian J12 (2017), 1240–1249.
15.
KomanduriS.P., ShumakerF.A., RoeweK.D., WolfM., UhligF., MooreC.E., RheingoldA.L. and WeinertC.S., A Series of Isopropyl-Substituted Oligogermanes Ge(GePh2)n(n=0–3) Featuring a Luminescent and DichroicPentagermane Ge(GePh2)3, Organometallics35 (2016), 3240–3247.
BeckeA.D., Density-functional thermochemistry. III. The role of exact exchange, J Chem Phys98 (1993), 5648–5652.
18.
FranclM.M., PietroW.J., HehreW.J., BinkleyJ.S., GordonM.S., DeFreesD.J. and PopleJ.A., Self-consistent molecular orbitalmethods. XXIII. A polarization-type basis set for second-rowelements, J Chem Phys77 (1982), 3654–3665.
19.
MochidaK. and ChibaH., Synthesis, Absorption Characteristics, andsome Reactions of Polygermanes, J Organomet Chem473(1994), 45–54.
20.
LiebmanJ.F. and GreenbergA., The origin of rotational barriers in amides and esters, Biophys Chem1 (1974), 222–226.
21.
JaisenP.G., StevensW.J. and KraussM., AB initio calixjlations of the rotational barriers in formamide and acetamide: The effects of polarization functions and correlation Paul G. Jasien*, Walter J. Stevens and Morris Krauss, J Mol Struc-THEOCHEM139 (1986), 197–206.
22.
OlsenR., LiuA.L., GhaderiN., JohnsA., HatcherM.E. and MuellerL.J., The Amide Rotational Barriers in Picolinamide and Nicotinamide: NMR and ab Initio Studies, J Am Chem Soc125 (2003), 10125–10132.
23.
MillerR.D., HoferD., RaboltJ. and FickesG.N., An Anomalously Long-Wavelength Electronic Transition in Conformationally Locked Organosilane High Polymers, J Am Chem Soc107 (1985), 2172–2174.
24.
Trefonas IIIP., DamewoodJ., JamesR., WestR. and MillerR.D., Organosllane High Polymers: Thermochromic Behavior In Solution, Organometallics4 (1985), 1318–1319.
25.
RaboltJ.F., HoferD., MillerR.D. and FickesG.N., Studies of Chain Conformational Kinetics in Poly(di-n-alkylsilanes) by Spectroscopic Methods. 1. Poly(di-n-hexylsilane), Poly(di-n-heptylsilane), and Poly(di-n-octylsilane, Macromolecules19 (1986), 611–616.
26.
JovanovicM. and MichlJ., Understanding the Effect of Conformation on Hole Delocalization in Poly(dimethylsilane), J Am Chem Soc140 (2018), 11158–11160.
27.
JovanovicM. and MichlJ., Effect of Conformation on Electron Localization and Delocalization in Infinite Helical Chains [X(CH3)2]∞ (X=Si, Ge, Sn, and Pb), J Am Chem Soc141 (2019), 13101–13113.
28.
FangF., JiangQ. and KlausenR.S., Poly(cyclosilane) Connectivity Tunes Optical Absorbance, J Am Chem Soc144 (2022), 7834–7843.
29.
RoeweK.D., GolenJ.A., RheingoldA.L. and WeinertC.S., Synthesis, structure, and properties of the hexagermane Pri3Ge(GePh2) 4GePri3, Can J Chem92 (2014), 533–541.
30.
FaW. and ZengX.C., Polygermanes. Bandgap engineering via tensile strain and side-chain substitution, Chem Commun50 (2014), 9126–9129.
31.
TakedaK., TeramaeH. and MatsumotoN., Electronic Structure of Chainlike Polysilane, J Am Chem Soc108 (1986), 8186–8190.
32.
NešpůrekS. and EckhardtA., Poly(silylene)s: charge carrier photogeneration and transport, Polym Adv Technol12 (2001), 427–440.
33.
PreckerJ.W. and da SilvaM., Experimental estimation of the bandgap in silicon and germanium from the temperature–voltagecurve of diode thermometers, Am J Phys70 (2002), 1150–1153.