
Abstract
Image posting and sharing on the social media clouds is a common activity of end users. During the uploading of an image, social media cloud automatically compresses the original image to reduce resolution and file size to save storage and provides service to speed up content loading in the web page. Image quality degradation on social media clouds decreases the user satisfaction level. Quality of Experience (QoE) experiment was conducted for assessing the end user’s satisfaction for image compression. During the experiment, four popular social media clouds were selected for 4 sample image hosting and images were captured with Canon DSLR and Samsung mobile cameras. The results show that Facebook and Twitter compress image less as compared to WeChat and Tumblr and user QoE ratings show that Facebook and Twitter compression level for the image is acceptable. Further, we found that decrease of luminance and chrominance has less impact on image quality compared to resolution scaling which has higher impact on quality.
Introduction
Nowadays photography is the common interesting hobby of people around the world due availability of high resolution camera on their smartphones. People are interested to preserve the best moments of life by taking best pictures and storing for forever. Photography is the art of capturing things or moments of your life and images are captured with digital single-lens reflex (DSLR) camera having the average size of 8 to 15 MB [1, 2]. The user always likes to upload/publish high quality images on social media clouds for public view and share moments of life with friends. Social networks such as Facebook, Twitter and BrightCloud use cloud data centers for storage of data and mobile apps for accessing services free and also on pay per use [3]. They also upload the image for backup purposes in social media/storage clouds with original captured quality but social cloud like Facebook, WeChat, Tumblr and Twitter compress that image before publishing on the user’s timeline. Facebook use lossy compression technique which reduces the quality of the image, size of the image for saving storage, reduce computing resource for image processing and also for fast loading/display of an image on the user’s timeline, which will never be regenerated in original quality with reverse technique [4, 5]. Page loading with high resolution image is also a major problem because page requires more network bandwidth to transfer data from cloud to user and computing resources for image processing. The image posted on the social media cloud contains distortion and noise as compared to the original image. Finally, users are disappointed from social media cloud service providers because their original image will not be regenerated and hence, leave the cloud. Social cloud service providers are facing problems of storage issue and computational power for image processing at cloud side for million users at a time. So there is a need to assess user QoE of social media cloud image hosting service and satisfaction level compression percentage. To the best of our knowledge, no such work has been done by any researcher to analyze simulated distortions, such as JPEG (Joint Photographer Expert Group) compression, blur, or additive noise of social media clouds. Work presented here measures and analyzes user satisfaction level for image hosting on different free social media clouds and presents the acceptable level of user experience for image quality.
Nowadays Quality of Experience (QoE) is used instead of Quality of Service (QoS) for the improvement of cloud services for end users [6]. Subjective QoE method is used for the assessment of user feedback about image quality, video streaming and network services [7, 8, 9]. The definition of QoE is given in [10, 11] and defined as “QoE is the degree of delight or annoyance of a person whose experiencing involves an application, service, or system. It results from the person’s evaluation of the fulfillment of his or her expectations and needs with respect to the utility and/or enjoyment in the light of the person’s context, personality and current state”. There are two types of QoE as given by researchers, one is subjective and the other is objective. Objective QoE is subdivided further into two types; one is based on a technical factor of QoS data and second on the human physiological and cognitive system [12, 13].
Providing the QoS for image hosting is a challenge for social media cloud service providers because high resolution images take more time to load into a webpage and the high data size of image also consumes more storage amount at cloud side and requires more network bandwidth to transfer from cloud to client. There are two types of image compression – lossy and lossless. Lossy compression results in some image quality being compromised whereas, in lossless compression the image quality is maintained. However, due to the limitation in storage all social media clouds reduces the size of the image uploaded, hence, resulting in lossy compression.
The contribution of this paper is twofold: Firstly, to measure user satisfaction level about the image quality by analysing the influence of different social media clouds image hosting compression over the user QoE and secondly, to present acceptable compression level of end users in terms of QoE. We use subjective QoE assessment method for user satisfaction level for different social media cloud service provider and solution also provide acceptable level of image compression compared with the original captured image. During the research work, we repeat experiments with two sample images which were captured with different devices and posted on Facebook, WeChat, Tumblr and Twitter to examine the characteristics and effect on the user’s QoE of image quality.
Our paper is organized into 6 sections, in Section 2 we provide literature review and Section 3 is based on laboratory experiments. Section 4 provides results and discussion; finally, in Section 5 we conclude our work.
Literature review
Image quality has been considered from decades and a lot of research work has been done on the image quality of experience (IQoE). Saad et al. conducted subjective QoE of the users on the image captured with different cameras [14]. The purpose of the research work was to design subjective quality of experience experiment for analysis of the visual quality. The images were captured with consumer’s different devices such as mobile phone, smartphone and DSLR. Images of natural conditions were used by avoiding simulated software based pictures. The QoE study was conducted in 3 different research labs to analyze the difference of user ratings. During QoE assessment experiment new subjective questionnaire was modeled, which provide easiness for examination of differences of QoE provided by various devices. The results show that the expectations of consumers were that quality of image drops when moving from DSLR to smartphone or tablet, however, the reality is different some phones can produce excellent quality images.
Subjective QoE test was conducted by Chen et al. to explore the influence of binocular depth of stereoscopic images [15]. The research work based on the concept of 3D and 2D, image quality properties such as visual comfort, depth rendering, naturalness, depth quantity and visual experience. The depth of focus was also given consideration when subjective QoE of images was conducted and all camera parameters also set for image capture for final perception. Subjective assessment methodology for Video Quality (SAMVIQ) method was used for evaluation of user’s QoE. The results revealed that QoE of user’s changed if variation in binocular depth.
Visual quality assessment on reconstructed background images was conducted by Shrotre and Karam [16]. The database was based on 13 images which were constructed by using existing background initialization algorithms. The experiment based on benchmark performance of background initialization algorithms and subjective study of image quality. The purpose of the subjective study is to analyze the validity of available image quality metrics and their efficiency in calculating the perceived quality of reconstructed background images. The results show that none of the previous algorithms are suitable for image sequences in the database, no-reference techniques have failed and no suitable full-reference image quality assessment technique is found to be better for adopting high performance in terms of correlation with subjective QoE scores.
Hu et al. have done research work on the perceptual evaluation of compressive sensing image recovery [17]. Researchers developed database of compressive sensing recovered images and those were generated at different sensing rate by using ten best compressive sensing image recovery algorithms. The subjective QoE of image quality was conducted by using single stimuli method. The evaluation of subjective score evidenced that previous quality metrics were limited to estimate the quality of compressive sensing recovered images.
Pairwise comparison method was proposed by Zhang et al. to assess the reliability of participant’s judgment and reject the outlier [18]. Previous pairwise methods of outlier detection only compared results of specific participants, ignoring the statistical information between subjects for each pair. The proposed method characterizes “reliability weight” to consolidate the transitivity satisfaction and the consistency satisfaction which speaks to rationality that the member’s judgment contrasted and others. The proposed method applied on geometric distorted stereoscopic image database for confirmation of improvement. The results of the experiment are proof that “reliability weight” can assess subject’s reliability better than transitivity satisfaction, mainly when comes to subjects with unusual preference.
Subjective quality assessment of 3D image was analyzed by using paired comparison method which was applied to the quality assessment of the 3D stereoscopic images [19]. During the experiment, test procedures were described for score calculation, outlier detection and significance analysis. The proposed method facilitates an intuitive measure of image quality differences without using any further statistical test. There were two quality score computation preferences assumed such as better and worse which may differ with confidence interval to the ties probabilities. The upper and lower limits of the certainty interim are gotten by considering the outrageous situations where the ties between two stimuli evidently have a place with one of the two inclination choices. Thusly, the centrality of quality contrast can be effectively checked by analyzing the measure of cover between certainty interims. The proposed method also supports subjective QoE assessment of 3D stereoscope images captured with different camera distances. The experiment assured that results of paired comparison tests and single stimulus are similar while paired comparison test improves quality of discriminability between the stimuli.
Sample #1.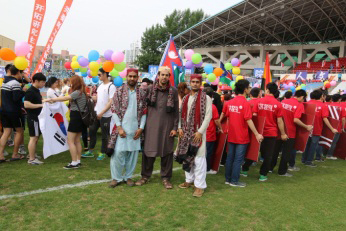
Sample #2.
Image loading issue in web pages was analyzed by Ahammad et al. who proposed an algorithm to characterize QoE of the image sent through web delivery service (WDS) pipeline [20]. The proposed quantitative signature (variation of quality signature) VOQS compared QoE of two arbitrary images perspective of web delivery performance. The algorithm supports exiting image database as well as new set of images which were compared in real-time to reference images per cluster to examine competently to which cluster they belong. The proposed method significantly reduces average bits/image that are required to be sent through big image databases with keeping better perceptual quality across the whole image database. This approach also saves the bandwidth during web delivery service of images.
In the past research work has been done on QoE assessment of image quality by using different parameters but there is no work done to the best of our knowledge which assesses the social media cloud compression impact on the user’s QoE for image quality.
This section presents the QoE experimental design and assessment.
Experimental design and methodology
Original images were captured using two devices – one was Canon (EOS 70D) DSLR for high quality images which contains 20.5 megapixels and second was Samsung (G-19300) having 8 megapixel camera. These images were uploaded (posted) on the leading social media cloud storages like Facebook, WeChat, Tumblr and Twitter. During the posting of images, every cloud reduces the quality of the image (resolution, size and change DPI) which varies according to cloud’s own secret compression preferences.
In order to collect QoE of the user of image quality on social media clouds, we performed various experiments and asked users to watch and perceive the quality of the image and ranked the sample images, which were captured using two different devices. Sample #1 having high Dimensions, Luminance, Chrominance and storage size as compared to Sample #2, the purpose of selecting two colored images with different devices was that the analysis of social media compression and user ratings will show the impact of the device used for image capturing. The sample images are shown in Figs 1 and 2. During the experiment, we selected four images for QoE assessment named as Sample #1 and Sample #2. Sample #1 is an image of 3 boys in sports festival captured with Canon (EOS 70D) digital single reflex lens (DSLR) and Sample #2 image is a view of riverside scenario, which was captured by using Samsung (G-19300). High resolution is very important for the user to access images and provide mean opinion score (MOS), so we use JPG standard picture format for MOS.
Sample #3.
Sample #4.
Sample #3 and Sample #4 are same text pictures which were taken by using both devices Canon DSLR and Samsung shown in Figs 3 and 4. The text image required high quality to view and read the text in images. Sample #3 is HD image and Sample #4 is low quality image. The purpose of selecting text images was to analyze the impact of social media compression on HD/low quality text image and analysis of user’s QoE.
QoE assessment experiment was conducted with 95 users; among them 60 were female and 28 were male subjects, aged between 30 to 35 years. The majority of students were undergraduates from the Computer Science and Technology Department and others were from Humanities and Architectures. A few of them were postgraduate students. A questionnaire was given to users and they were asked to provide their profile and assign the ranking to image quality.
For image display purpose, we follow the recommendations of ITU-R [21] and ITU-T Rec [22]. The display setting for watching images was 21 inches LCD display, with a resolution of 1280 X 800. Images were displayed in sequence. For subjects, first original image which captured with the device were displayed and then cloud hosted images were displayed from higher resolution (quality and size) but subjects were unaware the technical details of images like resolution pixels, DPI, bitrate and size on every social media cloud.
Results and discussion
This section presents the degradation resulted from the compression of images from the two cameras on the four social media sites. It further presents the QoE results in terms of the MOS.
Image analysis
Using NCH PhotoPad Image Editor Professional 2.81 [23] for open and view image, we conducted QoE test of image quality degradation due to compression hosted by social media clouds. The purpose of using four different images having different size, resolution and captured with different devices is to get more data the on the user’s QoE of different parameters (different image capturing devices and hosted social clouds), which provide more detailed information about user perception and satisfaction.
After post properties of Canon DSLR image (Sample #1)
After post properties of Canon DSLR image (Sample #1)
Facebook sample.
WeChat sample.
Tumblr sample.
All sample images were analyzed and report logs were generated by using JPEGsnoop, a JPEG file decoding utility tool developed by Calvin Hass [24]. The JPEGsnoop tool decodes all information of sample images which were compressed during the upload on the cloud excluding Facebook and Twitter. Compression status parameter provides information of compression ratio and a bit per pixel ratio but compression algorithm of Facebook and Twitter hide this information of image and decoding and did not provide this information so it was not possible to estimate the compression ratio of images on both clouds.
After post properties of Samsung mobile image (Sample #2)
Twitter sample.
Facebook sample.
WeChat sample.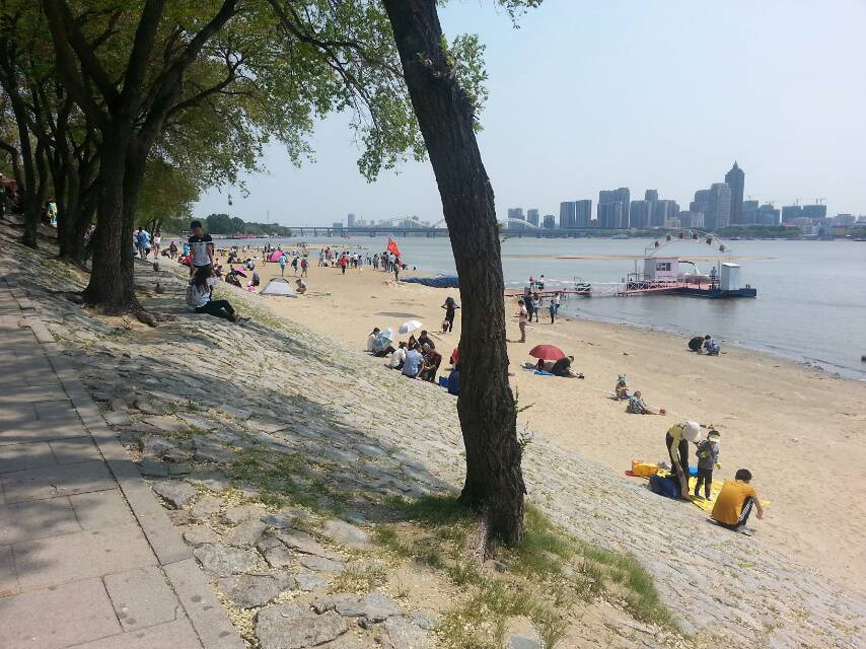
Tumblr sample.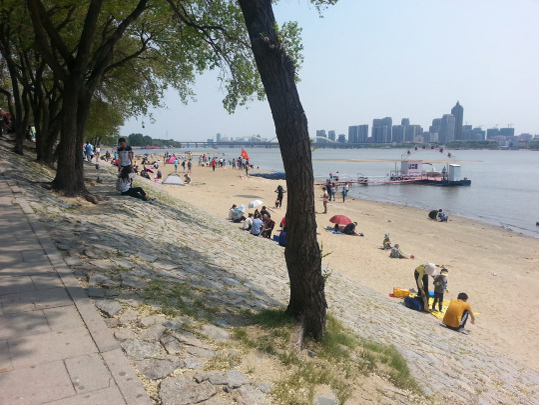
Twitter sample.
Impact of lossy compression is different on user’s QoE as compared to the original image. Every social cloud resize and compress the image by decreasing different parameters for example in Sample #1 Facebook decrease scale pixels 73%, reduce luminance and chrominance 27% as compared to the original file to reduce 95% storage size of the file. Similarly, WeChat decrease scale pixels 83% reduce luminance and chrominance 28% and 99.4% as compared to original file storage size. Tumblr reduces scale pixels 91%, reduce luminance and chrominance 7% and 99.6% file but big difference in Twitter compression parameters, it reduces scale 73% pixels, luminance and chrominance 11% and file size 93.4% compared to the original image. Effect of image quality degradation due to posting on social media clouds are shown in Figs 5 to 8 and technical parameter comparison of the original image with posted images on the social media clouds are given in Table 1.
In Sample #2 Facebook decrease scale pixels 38.4%, reduce luminance and chrominance 23% as compare to original file to reduce 85% storage size of file. Similarly WeChat decrease scale pixels 74%, reduce luminance and chrominance 27% and 97% as compare to original file storage size. Tumblr reduce scale pixels 84%, reduce luminance and chrominance 5% and 97% file but big difference in twitter compression parameters, it reduces scale 38.4% pixels, luminance and chrominance 12% and file size 79% compare to original image. Image posted on social media clouds are shown in Figs 9 to 12 and technical parameter comparison of original image with posted images on the clouds is given in Table 2.
The purpose of using text images for user experience and cloud uploading is to more accurately analyze the impact of compression of cloud on user experience, because text require higher quality images for accurate reading and understanding. Sample #3 has different storage size as compare to Sample #1, but both images were captured with the same device. All parameters are equal in Sample #3 compared to sample after upload on social clouds, only difference is in dimensions and compression of size of file. Wechat sample is more distorted as compared to other social media clouds samples but still text is readable and understandable. The samples posted on social media clouds are shown in Figs 13 to 16 and technical parameter comparisons of original image with posted images on the clouds are given in Table 3.
After post properties of Canon DSLR image (Sample #3)
Facebook sample.
WeChat sample.
After post properties of Samsung Mobile image (Sample #4)
Tumblr sample.
Twitter sample.
User MOS
Facebook sample.
WeChat sample.
User MOS
Tumblr sample.
Twitter sample.
Sample #4 is also same text page image of Sample #3 but image was captured by using Samsung (G-19300). Sample #4 has low quality of original image and also for images hosted on the social media clouds. Image quality of Facebook and Twitter are acceptable and understandable after compression but Tumblr and Wechat image is distorted more due to compression. Text in WeChat image is not readable so users reject this image. Figures 17 to 20 show the samples posted on social media clouds and technical parameter comparisons of original image with posted images on the clouds are given in Table 4.
The data obtained from laboratory experiments were converted into graphs. The graphs were plotted on user ratings versus cloud compression variation, followed by an observation of social media cloud compression the impact on the image QoE.
We conducted the experiments and presented results of image compression parameter of Samples #1, 2, 3 and 4 which were posted on social media clouds and downloaded for user image quality perception of each image in the experiments. If the user perceives that the quality of the image is better, then they assign rating as excellent, and if they are merely satisfied then they ranked image as fair. If they are completely dissatisfied, the quality of the image is annoying and ranked as bad. We calculate the mean opinion score of captured ratings of users by using mean equation Eq. (1) and results of quantitative data analysis of subjective QoE of experiments are given in Tables 5 and 6.
where
Comparsion of ratings.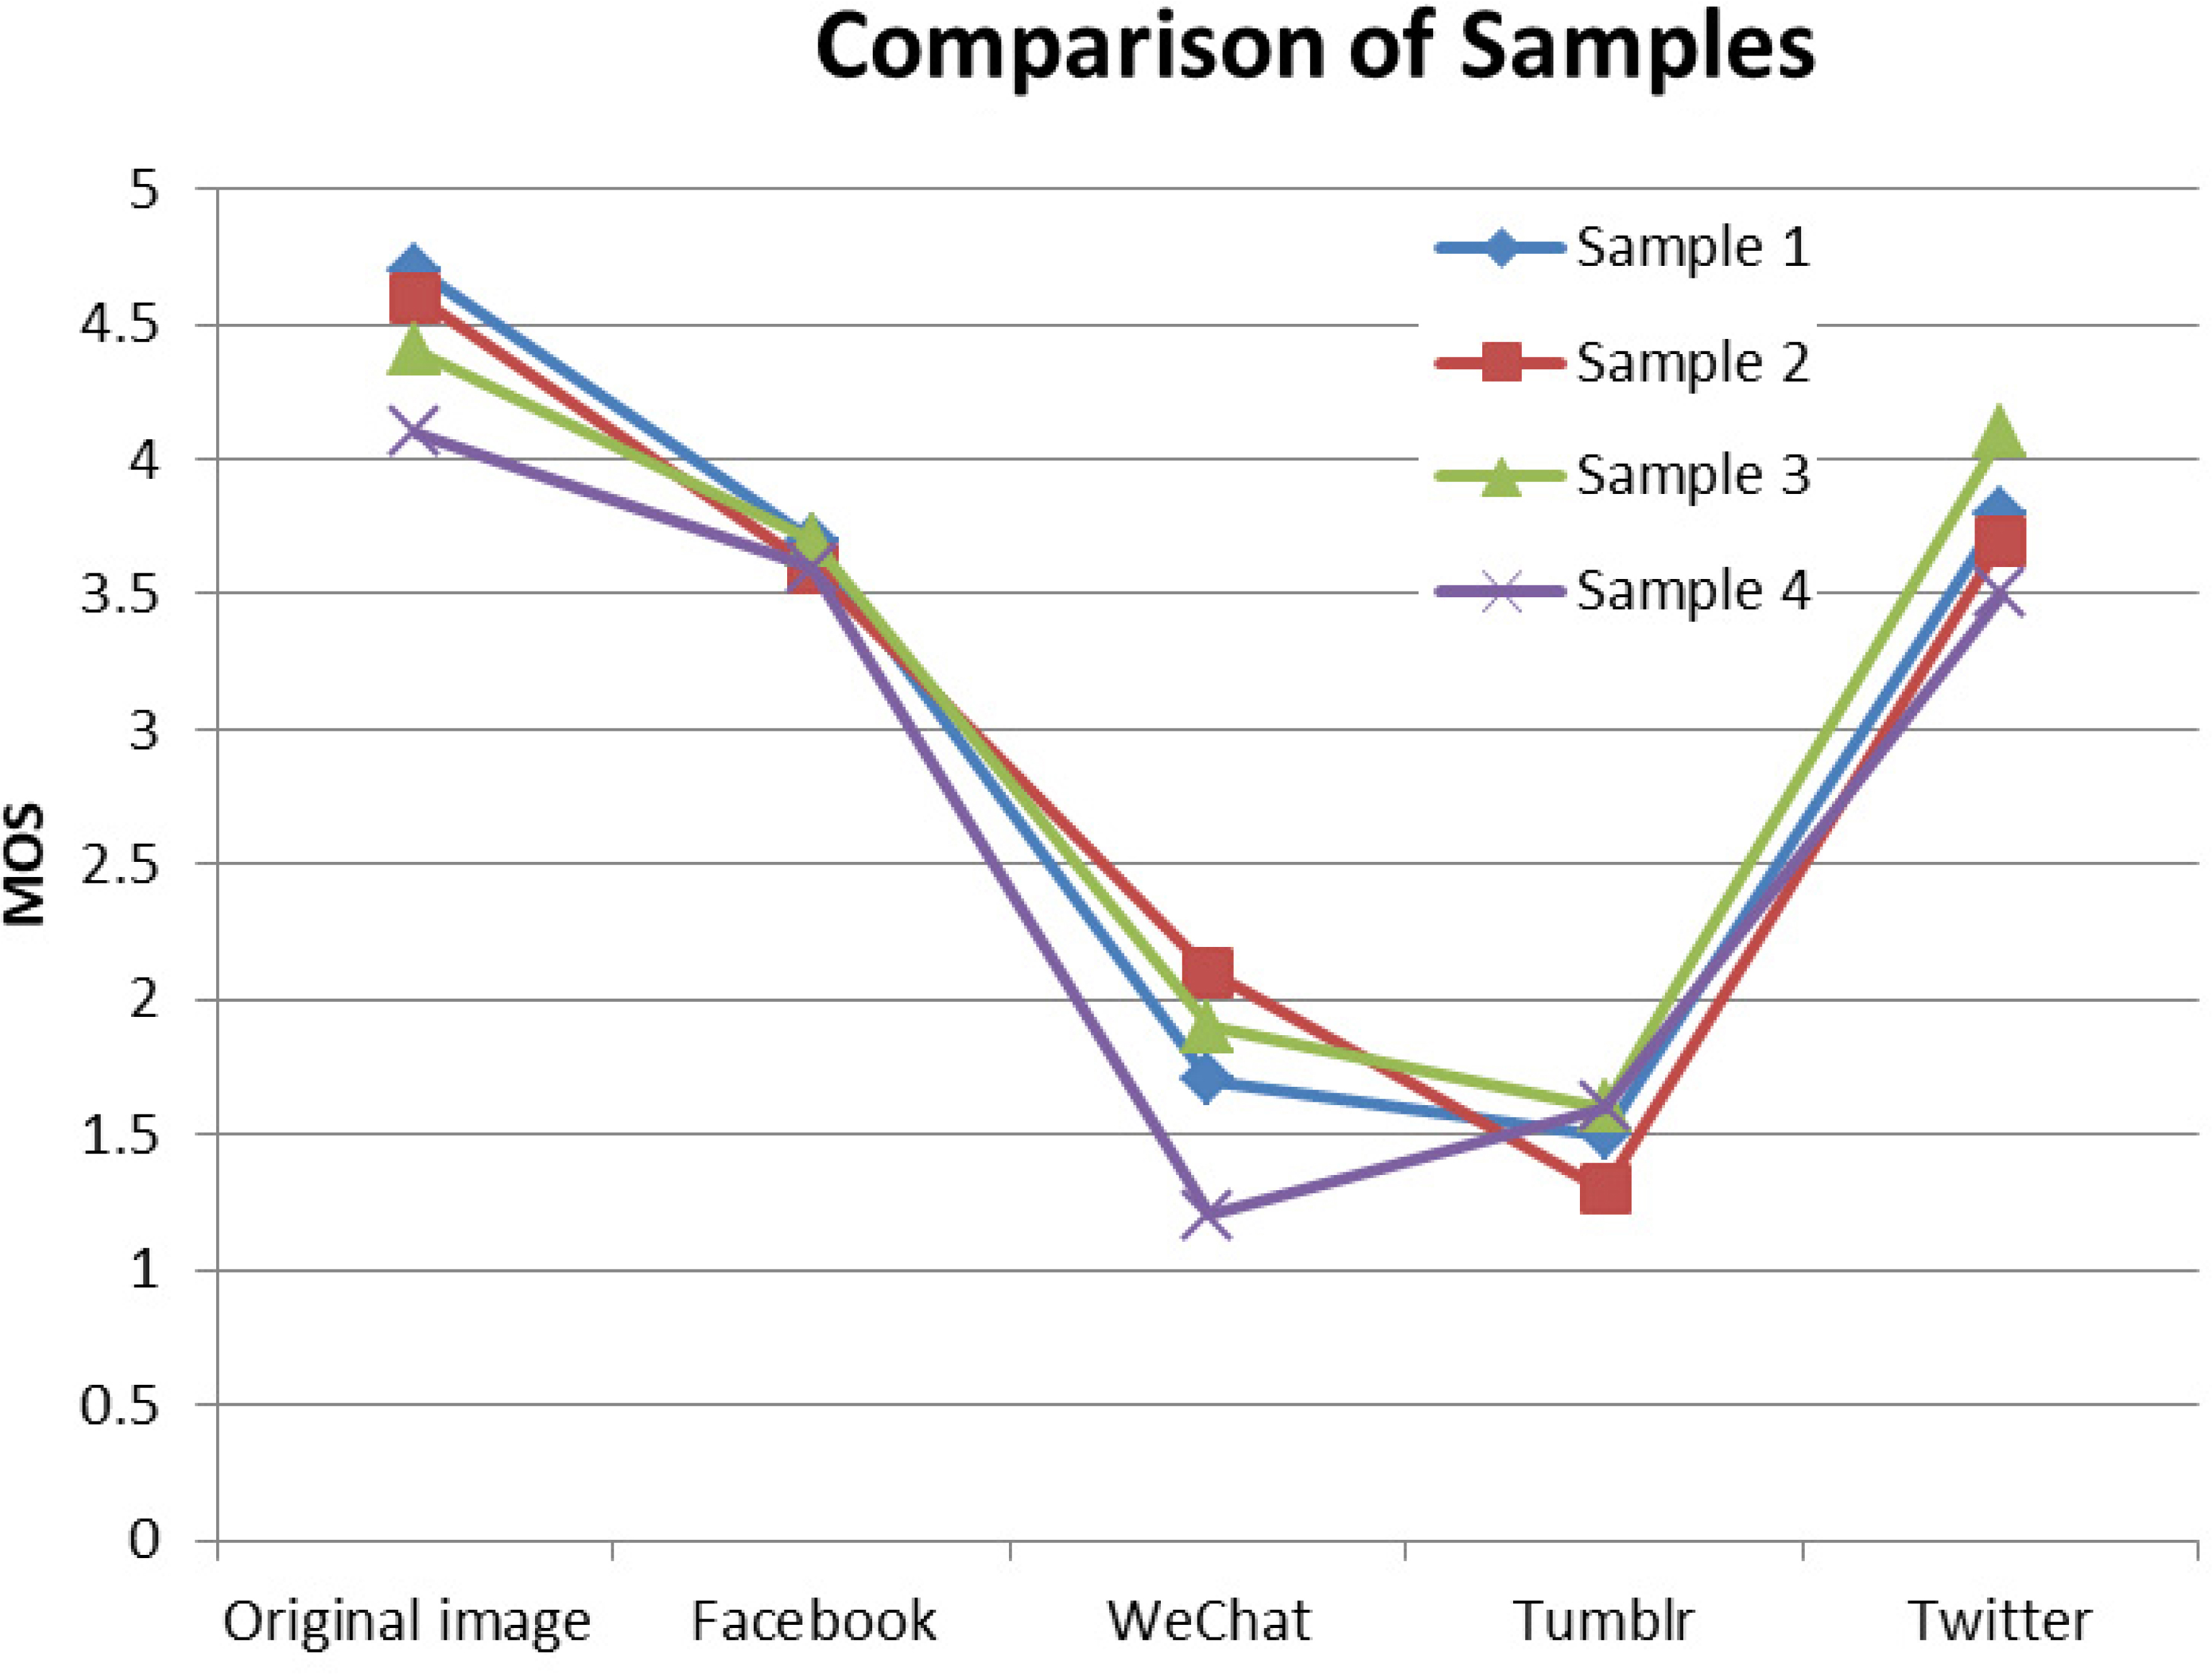
The result shows that the image hosted on social media clouds has different QoE ratings of the same original image. Facebook and Twitter have high QoE ratings because both compress low image when uploaded on the user’s timeline, so quality is better compared to WeChat and Tumblr. Figure 21 shows high ratings for the original image on Facebook and Twitter but low ratings for WeChat and Tumblr due to high compression of the image. The technical information is shown that in Table 1 of Sample #1, WeChat and Tumblr compress the image (e.g. resolution scaling) more than Facebook and Twitter and user gives those low ratings considered as poor according to ITU recommendations [22]. Sample #2 image has almost same QoE ratings which were captured with Samsung mobile device but slightly low QoE ratings for the original image because Sample #2 has low quality compared to Sample #1 original image because that was captured with Canon (DSLR). Technical information also show that a decrease of luminance and chrominance have less impact on image quality compared to resolution scaling that has a high impact on quality. Facebook and twitter reduce scale the image resolution low but reduce more Luminance and Chrominance as compared to WeChat and Tumblr so the image is not distorted and quality is good. WeChat and Tumblr reduce more image resolution and less Luminance and Chrominance but scaling distorts image quality more than Facebook and Twitter. Purpose of using Sample #3 and Sample #4 of the same text based image for assessment of QoE is to provide a more convenient way to subjects to decide about the quality of the image after compression. Figure 21 shows users assign less rating to original image which was captured with the device before compression because reading and understanding text characters require higher quality and clearer image. Figure 21 also shows that users assign very low ratings for WeChat hosted images because compression level distorts the image and text is not readable. Samples #1 and #2 contains big objects in images so users do not require more effort to understand the objects in the image and perceived good quality and assigned higher ratings as compared to Samples #1 and #2. From Fig. 21, comparison of Sample #1, 2, 3 and 4 is clearly visible that original image has high QoE ratings compared to when the same image is uploaded on all social media clouds. Only Facebook and Twitter image quality and compression level has acceptable ratings from users. When compression level is increased such as WeChat and Tumblr than user experience and satisfaction level also decreased. Fair was the lowest point 3 that user was satisfied with social media cloud image compression level.
The work presented in this paper measures and analyzes user satisfaction level for image hosting on different free social media clouds and presents the acceptable level of user experience for image quality. While, there has been work done by other researchers on image QoE, our focus is on analyzing simulated distortions, such as JPEG compression, blur, or additive noise of social media clouds to assess which image parameter has higher impact on user QoE.
We conducted several experiments on social media cloud image compression and uploaded samples on different popular social media clouds to measure user satisfaction level about image quality as well as acceptable compression level for end users. The results presented in this paper showed that user satisfaction level is excellent when an image with high quality was perceived by the user. But ratings were decreased in image quality when posted the image on WeChat and Tumblr clouds and image distorted due to high compression level. This research work provided an assessment about user perception that they suffered from the quality of image distortion due to high compression by social media clouds. Results also show that decrease of luminance and chrominance has less impact on image quality but resolution scaling has a higher impact on quality.
Newly developed WebP image format designed by Google uses both lossless and lossy compression, reduces the file size and provide facility to speed up web page loading improving the user experience for image hosting on social media clouds. Future work will focus on the impact on the user QoE on different scale image and video quality assessment on social media clouds.
Footnotes
Authors’ Bios