
Abstract
Patients with chronic liver diseases typically experience lipid profile problems, and mortality from cirrhosis complicated by portal vein thrombosis (PVT) is very significant. A lipoprotein (Lp) is a bio-chemical assemblage with the main job of moving fat molecules in water that are hydrophobic. Lipoproteins are present in all eubacterial walls. Lipoproteins are of tremendous interest in the study of spirochaetes’ pathogenic mechanisms. Since spirochaete lipobox sequences are more malleable than other bacteria, it’s proven difficult to apply current prediction methods to new sequence data. The major goal is to present a Lipoprotein detection model in which correlation features, enhanced log energy entropy, raw features, and semantic similarity features are extracted. These extracted characteristics are put through a hybrid model that combines a Gated Recurrent Unit (GRU) and a Long Short-Term Memory (LSTM). Then, the outputs of GRU and LSTM are averaged to obtain the output. Here, GRU weights are optimized via the Selfish combined Henry Gas Solubility Optimization with cubic map initialization (SHGSO) model.
Keywords
Introduction
Lipoproteins are complex molecular compounds made up mostly of free and fermented proteins, triglycerides, phospholipids, Apolipoprotein A-I (APO A-I), and cholesterol that transport plasma lipids [1, 2, 3]. The four key types of lipoprotein chylomicrons are Very-Low-Density Lipoprotein (VLDL), Low-Density Lipoprotein (LDL), and High-Density Lipoprotein (HDL), as well as the two minor classes, i.e., Lp (a) and Intermediate-Density Lipoprotein (IDL), are differentiated by density, size, composition and lipid content, and composition and protein content [4, 5, 6], to name a few.
For the past fifty years, sub-fractionation and improved lipoprotein analysis have been applied in human scientific medical research [7, 8]. The Framingham Heart Study and the Lawrence Livermore Study, both undertaken at the University of California, were the first to show the therapeutic relevance of sophisticated screening and laid the foundation for future studies. Clinical research over the next 50 years has shown that certain parts of these tests provide insight into the atherogenic processes independent of routine lipid results and findings [9, 10]. Several lifestyles and pharmacologic therapy trials have revealed substantial disparities in treatment response based on lipoprotein subclass categorization. Differences in arteriographic results were associated with alterations in lipoprotein subtype dispersion [11, 12]. Standard lipoprotein measures of whole cholesterol, triglycerides, High-Density Lipoprotein Cholesterol (HDL-C), and low-density lipoprotein cholesterol (LDL-C) have failed to uncover numerous lipoprotein anomalies that lead to coronary heart disease and peripheral vascular cancer risk over the last two decades [13, 14, 15, 16]. The ensemble technique combines several trained base classifiers [40]. These techniques are typically referred to as ensemble learning, which is known to lower the classifiers’ variance and increase the robustness and accuracy of the decision-making system [41]. The abundance of training data is the primary determinant of victorious generalizing machine learning models. Ensemble approaches are the machine-running technology that was created to address these issues. To categorize new examples, an ensemble of classifiers combines the judgment of individual classifiers in some way [42, 43, 44]. Advanced Lipoprotein Tests (ALTs) provide an understanding of minor but significant elements of lipoproteins and atherosclerosis, which may assist in explaining why the LDL-C–lowering technique has been so ineffective in halting the atherosclerosis epidemic. ALTs can be used in four different ways: (1) to improve atherosclerosis prognosis, (2) to improve outcome forecasting, (3) to aid in therapy selection and dose modification, and (4) to advise first degree relations of a patient with atherosclerosis [17].
The contributions are as follows:
Introduces lipoprotein prediction model, where features like correlation features, improved entropy, raw features, and semantic similarity featuresare derived. Then, derived ones are classified via hybrid classifier. The hybrid classifier is the combination of LSTM and GRU. GRU weights are optimized via Selfish combined HGSO with cubic map initialization. Proposes a new, Selfish combined Henry Gas Solubility Optimization with cubic map initialization (SHGSO) model, which is the hybridized version of existing Selfish Optimizer (SFO) and HGSO models.
Sections 2 and 3 reviews the extant LP(a) schemes and explainsthe proposedsystem. Sections 4 and 5 portrays features and classifiers. Sections 6 and 7 discuss results and conclusions.
Nancy et al. [18] investigated the relationship between Lp (a) and incident cardiovascular diseasein women in 2018. Lp (a) was measured using a turbidimetric assay in three women’s cohorts (the Women’s Health Study [
In 2018, Peter et al. [19] used patient-level data from seven random, placebo-controlled statins outcomes studies to determine hazard ratios for cardiac disease, classified as fatal or non-fatal coronary heart disease, stroke, or revascularization operations. Also, hazard ratios for coronary heart disease events were determined. Without impact alteration by any erstwhile study level or patient-level factors, the link between on-statin coronary heart disease risk and LP (a) was larger for placebo LP (a). It was muchmore evident at early age. Qi et al. [20] enlisted 83 UAP patients and 105 NSTEMI in 2021. Lp-PLA2 tertile data was used to create another group divide. The artery flow state was represented using the modified Thrombolysis In Myocardial Infarction (TIMI frame) count Corrected thrombolysis in myocardial infarction (TIMI) frame count (CTFC). CTFC and other clinical markers were analyzed for correlation. The researchers performed MRA to find the parameters influencing cardiac flow in NSTEMI patients.
Chen et al. [21] set out to see if APO A-I and HDL-C could predict permanent health complications in 2018. A maximum of 102 adolescent acute pancreatitis patients with local problems, organ damage, or progression of previous comorbid disease during treatment were integrated into a retrospective analysis between January 2011 and September 2016. The association between serum lipids and clinical outcomes or grading systems was calculated. In addition, the AUCs for predicting recurrent OF were computed and compared.
Anindita et al. [22] looked into whether Lp (a) cascade screening was efficient in finding cases reported of increased Lp (a) in families in 2022. In a tertiary hospital setting, relatives with Lp (a) concentrations less than 100 mg/dl were examined for high Lp (a) (50 mg/dl) using a cascade analysis method. The pervasiveness and sensitivity tonoticenovel cases of increased Lp (a) in relations were investigated. When probands possess elevated amounts of Lp (a), the probability of identifying raised Lp (a) is higher, and it outperformed the identification of relations with Combined Hyperlipidemia (CH) and Familial Combined Hyperlipidemia (FCHL).
In 2022, Robert et al. [23] investigated the therapeutic value of HDL subclasses and HDL-P in mortality risk classification and discriminatory models in a high-risk cardiac cohort. We measured HDL and HDL-P subclasses in 3972 people enrolled in the CATHGEN coronary catheterization biorepository using nuclear magnetic resonance spectroscopy, evaluated for associations including all death rates in robust clinical models, and looked at the functionality of HDL sub-domains in gradual mortality risk discriminatory practices and categorization.
In 2020, Kamil et al. [24] examined the pooled and individual predictive values of basal HDL-C and CRP levels in patients who had completed a 2-year follow-up after receiving transcatheter aortic valve implantation (TAVI). We looked at 334 patients who received CRP and HDL-C readings on admissions during certification for TAVI from January 2010 to July 2017. HDL-C levels of 46 mg/dl (AUC
Reviews of lipoprotein prediction models
Reviews of lipoprotein prediction models
Jiayan et al. [25] created silico forecasting models for familial hypercholesterolemia (FH) with low density lipoprotein receptor (LDLR) single missense mutations dubbed Structure-based Functional Impact Prediction for Mutation Identification in 2019. We compared our model’s operational impact and morbidity predictions to those of other traditional processes with evidence-based variants and in vitro functional lab tests for LDLR variant patients.
In 2022, Malaysha et al. [45] The recognition and diagnosis of LDL-C, based on past medical history and heuristic data, is supported by machine learning approaches. In this study, the LDL-C was predicted and classified using machine learning algorithms. The methods used for HDL-Ccategorization and prediction are also included. ANNs, RNN, RBFNN, fuzzy logic, SVM, Decision Tree, Logistic Regression, and a hybrid model combining ANNs and fuzzy logic are the techniques that are used to improve the results’ accuracy and lower the classification error.
In 2020, Li et al. [46] A technique for predicting mobile traffic based on stacking ensemble learning. This model has two components: a distributed multilayer perceptron (MLP) base learner and Self-adaptive Support Vector Regression is a meta-learner model (SSVR). Various real-world mobile traffic flows use mobile applications at various base stations.
Table 1 reviews the lipoprotein prediction models. Clinical advice for patients with eminent Lp (a) currently comprises the usage of statin and aspirin medication, even though the latter may cause Lp (a) levels to rise slightly. However, there is debate about the form of Lp (a) risk curve. While Lp (a) forecasts risk in people with low Total Cholesterol or LDL-C levels due to statin treatment, its relevance as a risk predictor in people with lower natural lipid levels is unknown [18].
Representation of proposed lipoprotein prediction scheme.
The proposed lipoprotein prediction scheme encompasses the following steps.
Primarily, features like correlation features, improved entropy, raw features, and cosine semantic similarity features are derived. Then, prediction occurs using hybrid classifier (LSTM and GRU). Further, GRU and LSTM are averaged to obtain the absolute output. The GRU weights are optimally chosen via the SHGSO model.
Figure 1 depicts the SHGSO scheme.
The features from input data are: (i) correlation features, (ii) improved entropy, (iii) raw features, and (iv) semantic similarity features.
Correlation features
It [26] is defined as the specified metric, which quantifies the strength of the linear association among 2 variables in a correlation study and is indicated by
Entropy is a concept that refers to how much information is carried by a signal. Furthermore, LEE [27] delivers dependable characteristics with a 0.01 error rate. Equation traditionally gives the LEE of (2). However, certain modifications to the existing method address the reliability problems. The improved entropy is shown in Eq. (3), wherein
The improved LEE features are implied as
The extracted raw (original) features are indicated by
Semantic similarity features
In information retrieval and information retrieval, cosine similarity is a broadly used metric [28]. Textual data is represented as a vector of phrases in this metric. The cosine similarity returns the similarity between the target and the data. It returns the pair-wise similarities between the row vectors. The extracted cosine similarity features are indicated by
Hybrid classifiers: Gated Recurrent Unit (GRU) and Long Short Term Memory (LSTM)
Here, LSTM and GRU are used for lipoprotein prediction to get the final result.
Gated Recurrent Unit (GRU)
GRU [29] features special gates known as reset and update gatesfor minimizing dispersion with minimal loss. As in Eq. (6), (
where
The hidden candidate state is revealed in Eq. (8), in which,
In Eq. (10), GRU is designed here,
The GRU outputs are denoted as
It [30] comprises three parts: a forget gate, input gate, and output gate. Assume that variables
LSTM is used
The LSTM outputs are implied by
Advantages of LSTM and GRU:
LSTM is more accurate on a larger dataset. It can able to deal with larger data sequences. GRU uses lesser training constraintswith lesser memory. GRU performsquickerand provides the results quickly.
Objective: It is designated in Eq. (17).
Solution Encoding: The GRU weights
Solution encoding.
The present HGSO [31] identifies optimum solutions but suffers from a lack of accuracy. To alleviate the drawbacks of standard HGSO, SHGSO combines the concepts of Selfish Optimizer (SFO) [32] and HGSO. Specific search challenges are believed to be capable of hybridized optimization techniques [33, 34, 35, 36]. Additionally, many Evolutionary Algorithms have common weaknesses, including premature convergence and a hard time overcoming local optima. The operators used to update the positions of search agents are typically the source of these problems. For instance, in particle swarm optimization, search agents are typically drawn to the location of the current best individual, which drives the entire population to congregate around the best particle thus far and favors premature convergence. The proposed model is used to address a particular flaw in the existing methodology. The term hybridization refers to the merging of algorithms in the metaheuristic method to create a new, powerful algorithm that draws on the strengths of the merged algorithms. Selfish Optimizer (SFO) and HGSO are combined in the model that was adopted. The major drawback of the HGSO is it endures lower convergence and lack of accuracy. To overcome certain drawbacks the HGSO is hybridized with Selfish Optimizer. The Selfish Optimizer will provide better convergence,and accuracy is also improved.
Henry’s Law: The amount of a specific gas that dissolves in a given kind and volume of liquid at a fixed temperature is exactly proportional to the partial pressure of that gas in equilibrium with that liquid, according to Henry’s law. As a result, Henry’s law is temperature dependent; suggesting that solubility of gas (
Step 1: Initialization: The first step is to begin the initialization process. Equation (19) is commonly used to assigna number of gases (populacedimension
where
Step 2: Clustering: Henry’s steady values
Step 3: Evaluation: Every cluster
Step 4: Update Henry’s coefficient as in Eq. (22). Conservatively,
where
Step 5: Update solubility: It is updated as in Eq. (25), here
Step 6: Update position: Conservatively, update by HGSO scheme. As per SHGSO, the position is updated with Selfish Optimizer (SFO) update as specified in Eq. (26).
where the attacking predator is denoted as
Step 7: Escaping from local optima: Equation (5.3) is used to rank and choose the worst (
Step 8: Worst agents position: Update the worst agent’s position in Eq. (28), wherein
Exploration and exploitation phases: Equations (29) and (30) is utilized to compute the exploitation/exploration percentage, wherein
Simulation set up
The lipoprotein predictionschemewas made in Matlab. The HC
Dataset description: Circulating microRNAs (miRNA) are relatively stable in plasma and are a new class of disease biomarkers. Here we present evidence that human HDL transports endogenous miRNAs and delivers them to recipient cells with functional targeting capabilities. Highly-purified fractions of human HDL contain small RNAs, and the HDL-miRNA profile from normal subjects is significantly different than familial hypercholesterolemia subjects. miRNAs were demonstrated to associate with native and reconstituted HDL particles and reconstituted HDL injected into mice retrieved distinct miRNA profiles from normal and atherogenic models. Cellular export of miRNAs to HDL was regulated by neutral sphingomyelinase. HDL-mediated delivery of miRNAs to recipient cells was demonstrated to be scavenger receptor BI-dependent.
Furthermore, HDL delivery of both exogenous and endogenous miRNAs resulted in the direct targeting of mRNA reporters. Notably, HDL-miRNA from atherosclerotic subjects induced differential gene expression, with significant loss of conserved mRNA targets in cultured hepatocytes. These observations suggest that HDL participates in a novel mechanism of intercellular communication involving the transport and delivery of miRNAs. Gene expression changes in human Huh7 cells with familial hypercholesterolemia HDL treatment. Gene expression (mRNA) profiles in human Huh7 cells treated with normal HDL (
Analysis on performance
The study on HC
Analysis via HC 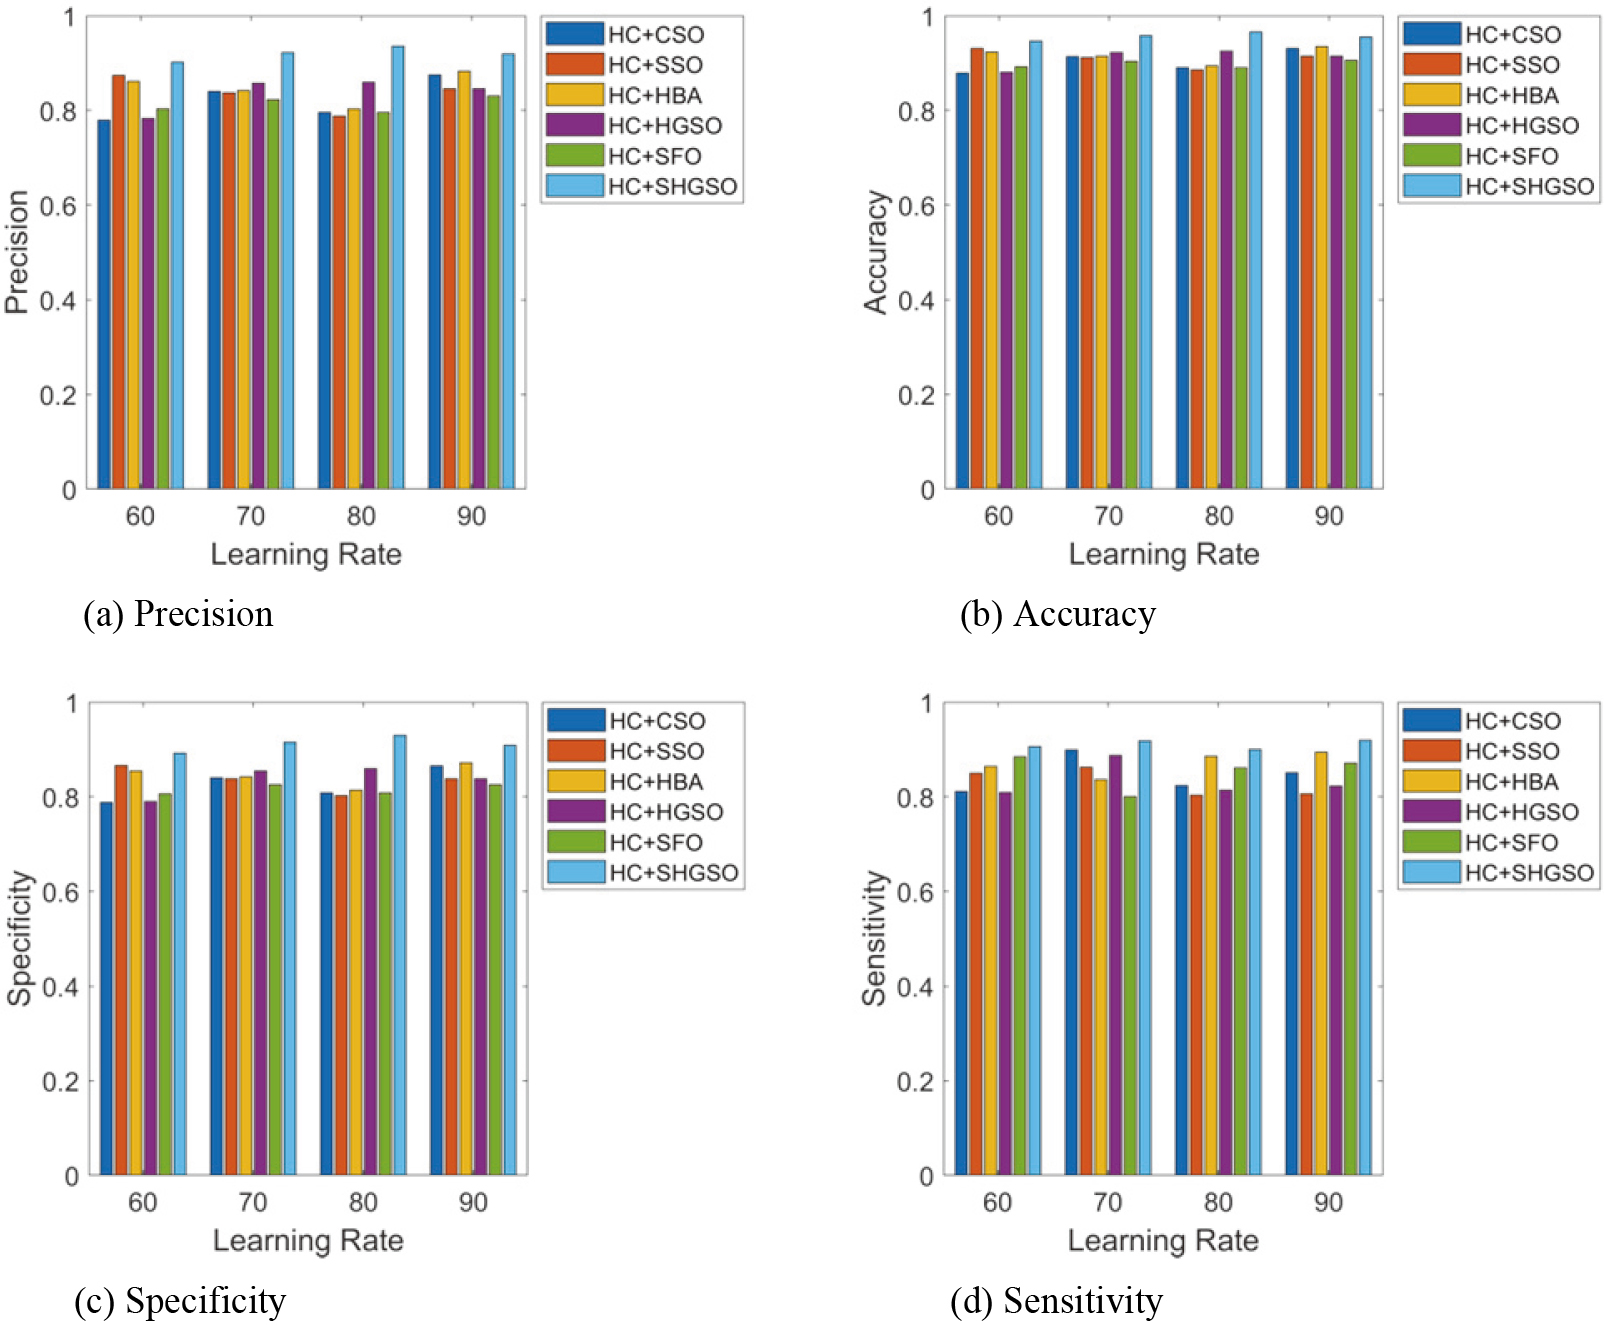
Analysis via HC 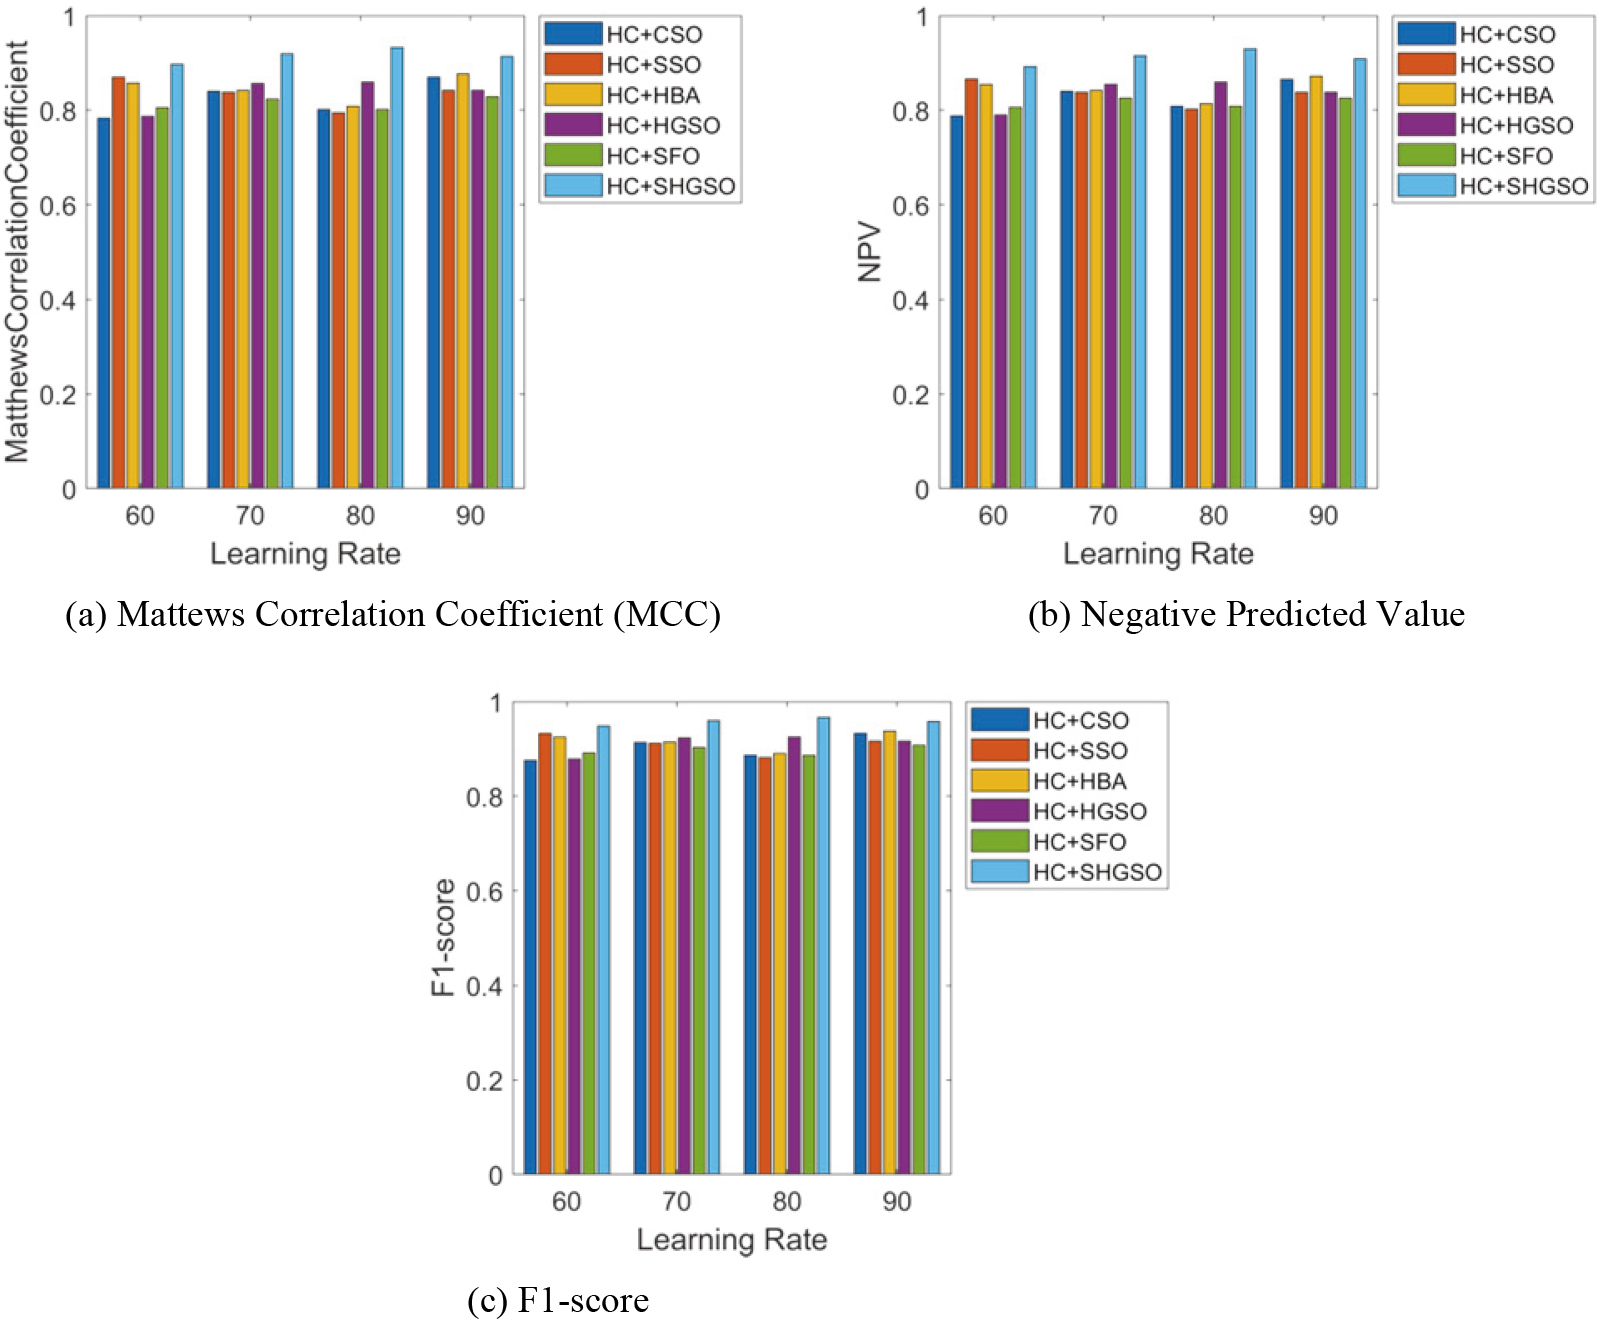
Analysis via HC 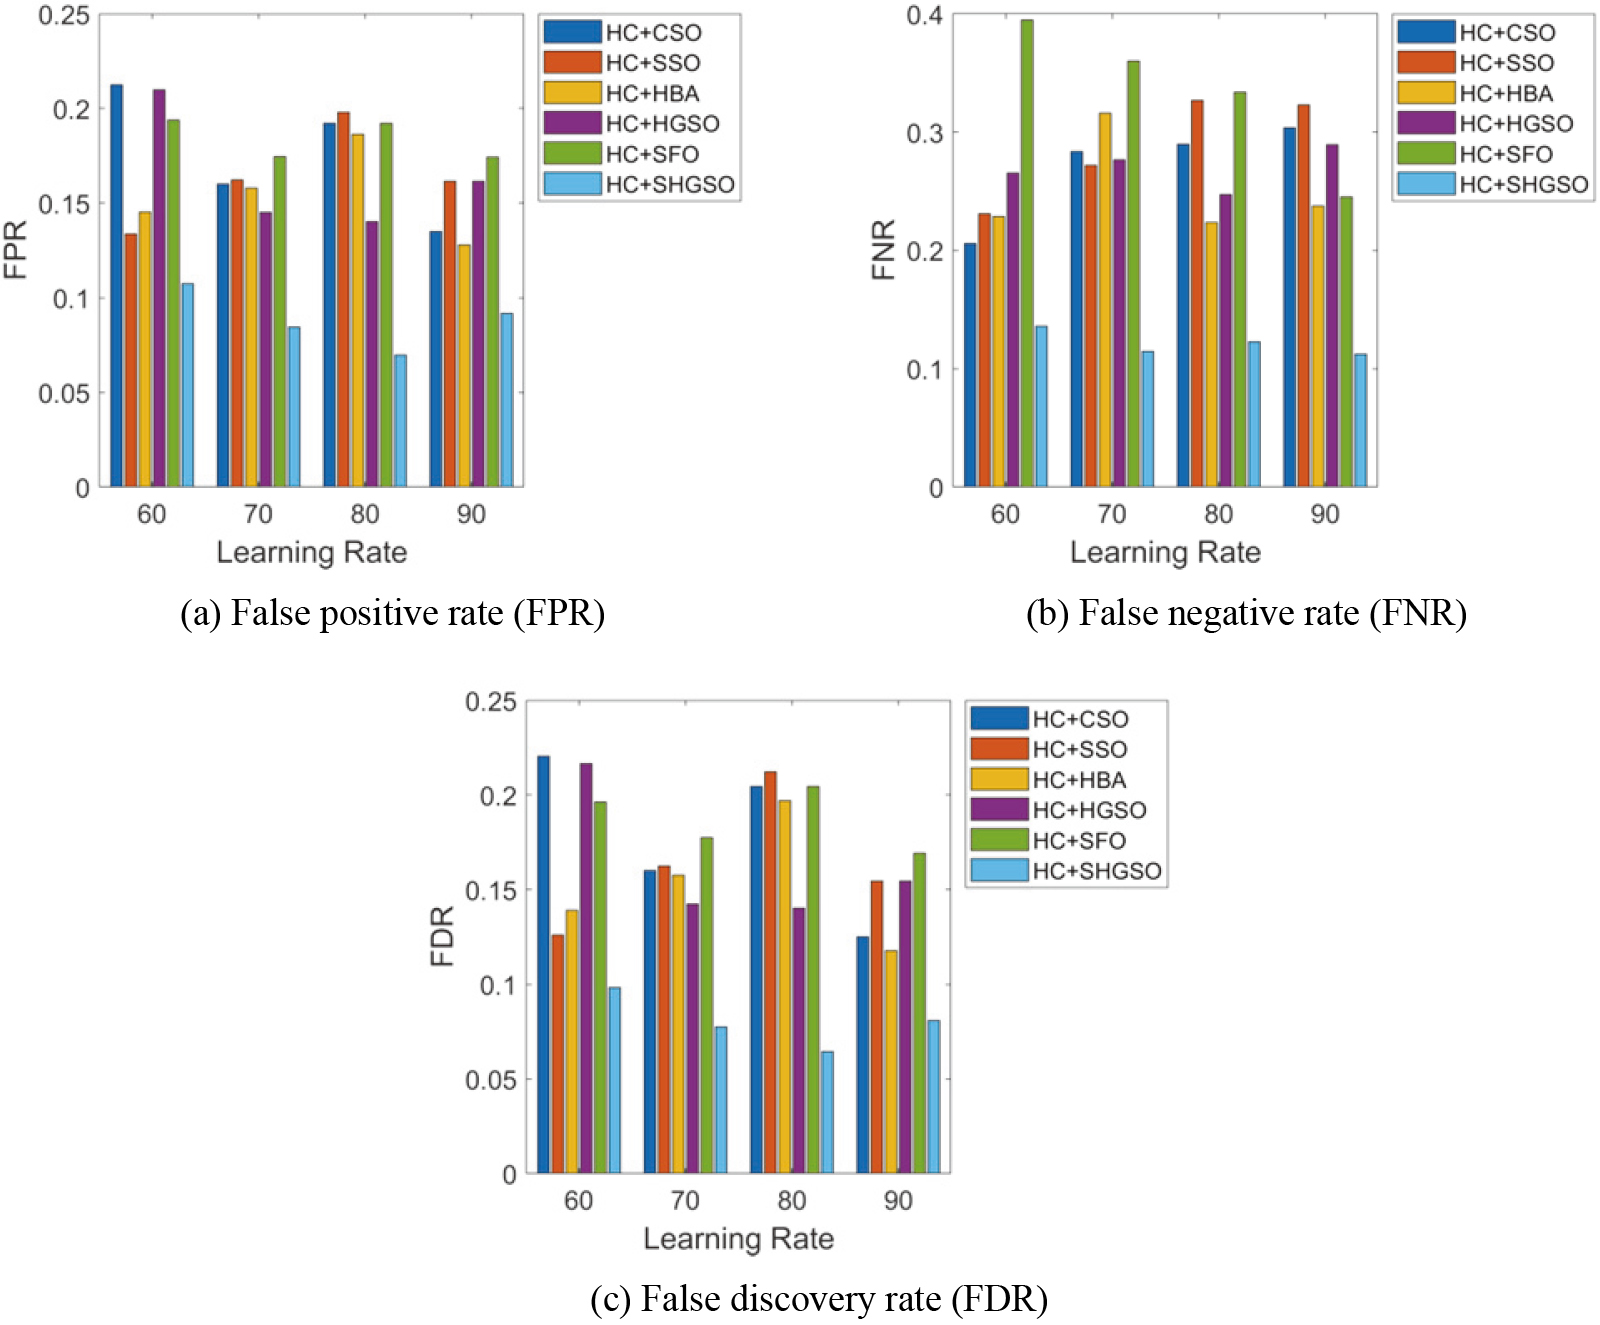
Analysis via HC
Table 3 highlight the statistical study using HC
Statistical study on accuracy
Statistical study on accuracy
The cost of the SHGSO scheme over HC
Convergence analysis of SHGSO over others.
The developed HC
Comparison of HC
SHGSO
Comparison of HC
The ROC curve describes the performance by merging confusion matrices at all threshold values. Figure 7 depicts the ROC curve. A ROC curve is a graphical figure that shows how a binary classifier system’s diagnostic capacity changes as the discrimination threshold are altered. The value is high for the proposed approachover other conventional approaches.
Area under curve
AUC stands for Area under the ROC Curve. AUC represents the level or measurement of separability. It reveals how well the model can differ across classes. The model performs better at differentiating between the positive and negative classes the higher the AUC. Table 5 depicts the AUC analysis.
Area under curve analysis
Area under curve analysis
Region of curve.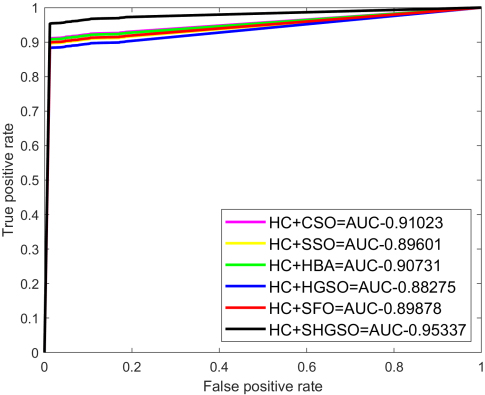
This paper suggested an Lp detection model wherein correlation features, enhanced improved log energy entropy, raw features, and semantic similarity features were extracted. These extracted characteristics were put through a hybrid model that combined a GRU and LSTM. The GRU and LSTM outcomes were averaged to get the absolute output. To improve the precise and accurate prediction, GRU weights were optimized via the SHGSO model. The offered HC
Footnotes
Declaration of statement
To the best of the authors’ knowledge, the paper entitled “Lipoprotein Detection: Hybrid Deep Classification Model with Improved Feature Set” is not considered for publication elsewhere and has not been published anywhere.
Author’s Bios
Dr. J. Amudhavel, Ph. D., Assistant Director – Digital Outreach at VIT Bhopal University, Bhopal, Madhya Pradesh, India. Developing real-world societal applications-based Machine Learning, Deep Learning and Artificial Neural Networks. Delivered Hands on Guest Lectures, Workshops by various reputed institutions of National Importance related to Augmented Reality, Deep Learning, Research Methodologies, Scientific Research Paper Writing etc … He has 10 licenses & certifications in various courses like, Amazon Web Services, Cloud Architecture core concepts etc.