
Abstract
BACKGROUND:
In Spain, there are several studies published on the relationship between eating habits and lifestyle among university students; but only a few of them are focused on online postgraduate students.
OBJECTIVE:
Herein we aimed to evaluate the degree of adherence to the Mediterranean diet pyramid (2010 edition), non-communicable diseases (NCDs), and lifestyle in online postgraduate students aged 20–65 years belonging to the food area of the Fundación Universitaria Iberoamericana (FUNIBER).
METHODS:
We performed a descriptive cross-sectional study including 100 online post-graduate students aged 20–65 years who were recruited by an accidental non-probabilistic sampling method consisting of a questionnaire on their sociodemographic characteristics, NCDs, lifestyle, and a 3-day food intake record (3-d).
RESULTS:
The profile of the students was 74% women, with a mean age of 36.6 (±10.5) years and body mass index (BMI) of 22.6 kg / m2 (±3.3). 71% of the volunteers presented normal weight, while 20% were overweight. Indeed, only a low percentage of the volunteers presented hypertension (1%), cardiovascular disease (0%), diabetes mellitus 1 (2%), diabetes mellitus 2 (3%), hypercholesterolemia (9%), and hyperuricemia (2%). Concerning lifestyle, (77%) of students were non-smokers, (78%) consumed beverages with caffeine, (51%) did not consume alcoholic beverages, and nearly all of them (84%) frequently (3 times /week) practiced physical activity. 68% of the recruited students exhibited adherence to “Medium diet quality diet (4–7)” followed by (26%) with a “Poor diet quality (<3)” and “Optimal diet quality” (6%).
CONCLUSIONS:
Spanish postgraduate students of the nutritional area, have good health and a healthy lifestyle but are moving away from the MD model, should be established campaigns for the improvement of eating habits of the postgraduate university population.
Introduction
Despite the multiple recommendations and policies implemented by countries, the non-communicable diseases (NCDs) pandemic continues to increase in both, developed and, most worryingly, developing countries [1]. The role of the quality of the diet and the practice of physical activity in reducing the prevalence of NCDs is well established. High consumption of foods or dietary products, rich in bioactive compounds, has been correlated with a decreased risk of the development of the most common non-communicable diseases [2–5].
The ANIBES study, carried out in 2013 [6] on a Spanish population between 9 and 75 years of age, observed that the mean calorie intake has decreased in the Spanish population to (1810±504kcal/day). And the Spanish diet was distributed in cereals or grains (27.4%), meats and derivatives (15.2%), oils and fats (12.3%), and milk and dairy products (11.8%), fruits (4.7%), vegetables (4%), non-alcoholic beverages (3.9%), fish and shellfish (3.6%), sugars and sweets (3.3%) and alcoholic beverages (2.6%). While total calories have been decreased, calories distribution are far away from the Mediterranean Diet (MD) recommendations [7].
In Spain overweight and/or obesity affect more than 50% of the adult population and nearly 30% of the population of infants and children [8]. Has been suggested that excessive energy intake is the primary cause of overweight and obesity. However, a good health and optimal functionality throughout life are achievable objectives, but they require a lifestyle that includes a diet with a correct balance of macronutrients and an adequate energy intake, as well as a correct practice of physical activity and exercise, which contributes to energy balance, body weight control, and improves a large number of physiological functions [9–13].
The Decalogue of the Mediterranean Diet [14] recommends the use of olive oil as the source of fat, based the diet on fruits, vegetables, legumes, nuts, whole grains, dairy products, and fish. Red meat, processed meat, and eggs should be consumed in moderation. Water is the beverage par excellence, wine in moderation during meals, and be physically active every day. High adherence to MD has been shown to reduce the risk of developing severe diseases such as cardiovascular and neurodegenerative disorders, cancer, or diabetes [15, 16].
The eating pattern of the university students has been analyzed in different studies since, for a lot of them, their daily lives experience important and critical changes such as having to move from their city or learn to manage their diet by doing the grocery and cooking their food [17, 18]. The lack of time and a sedentary lifestyle can be the cause of weight gain that can extend into adult life [19]. Different studies carried out on a university population showed that their dietary pattern was characterized by being rich in protein, cholesterol, and saturated fat [20, 21]; and low in characteristic foods belonging to the MD such as fruits, vegetables, whole grains, and potatoes [22].
The objective of the study has been to evaluate if diet quality and lifestyle pattern, reported by other authors during the University period, is maintained in postgraduate students. The lack of studies after their University stage has motivated us to analyze the degree of adherence established in the MD pyramid (2010 edition), the NCDs, and the lifestyle in the students to the Fundación Universitaria Iberoamericana (FUNIBER), from the food area.
Materials and methods
Study and participants
This was an observational, descriptive, cross-sectional study conducted in 100 online postgraduate students from the food area belonging to FUNIBER, from 2010 to 2012.
The number of students enrolled in the online courses of FUNIBER food area in Spain, per year was around 60 students. For that reason, we define our universe as 120 students during the period from 2010 to 2012. The representative sample size was calculated through the finite populations’ formula, with a confidence interval of 95%, a margin of error of 5.5%, and a probability of 50%, being 95 students the number of participants as a representative sample size.
An invitation to participated in the study was sent to students as they enrolled. In the first moment, 110 students answered positively and accepted to participate in the study. After evaluated the information only 100 students submitted all the requested information, which was supervised by registered dietitians that contacted them if the information was not clear or well completed.
Measurements
Survey data collection was performed through a questionnaire on sociodemographic (weight, height, date of birth, and sex), NCDs, lifestyle, and a 3-day food intake record (3-d). Regarding NCDs, were asked about the medical diagnosis of arterial hypertension (yes/no), cardiovascular diseases (yes/no), diabetes mellitus type 1(yes/no) and 2 (yes/no), hypercholesterolemia (yes/no), and hyperuricemia (yes/no) were included. Also, lifestyle features were evaluated: “Do you smoke?” (yes/no) and the number of cigarettes per day, “Do you drink caffeinated beverages?” (yes /no) and the number of drinks per day, “Do you consume alcoholic beverages?” and the number of drinks per week, “Do you do practice physical activity 3 times/week?” (yes/no) and the number of hours per week, “Are you responsible for the grocery shopping?” (yes/no) and “Are you responsible for preparing your meal?” (yes/no).
The 3-d consisted of to fill a form recording everything students eat and drink for 3 days (2 weekdays and 1 weekend day). Included all meals, snacks, and beverages, how much quantity, when, and where were ingested, as well as the cooking/culinary techniques used. The 3-d is considered the “gold standard” for the study of food intake [23].
The average of the grams provided by each food was calculated through NUTRIBER software (version 1.1.1.3r) and converted to servings/day following the “Table of daily servings-equivalences recommendations for adults of the SENC” document [24]. The servings were recoded into percentages according to the “Percentage distribution of adequacy to MD based on the MD pyramid (2010 Edition)” [25]. Information was also obtained on the amounts of energy and nutrients ingested. All data were entered by the same person to avoid errors in this process.
The percentage of adequacy was determined considering the actual consumption over that recommended by the pyramid of the MD [14]: (100 x consumed servings/recommended servings). 5 ranges of adequacy percentages were established: excessive consumption (> 120%), optimal consumption (80% –119%), acceptable consumption (60–79%), poor consumption (40% –59%) and very poor consumption (< 39%) as they did in the Ortiz-Moncada study [22].
To establish the level of adherence to the MD model, all the students who had an “optimal” or “acceptable” consumption of the 15 food groups recommended in the pyramid of the Mediterranean Diet (2010) were added and classification of the diet in 3 levels: “indicates poor diet quality (≤3)” the adherence is low and needs to be improve, “medium diet quality [4–7]” it is necessary to modify the diet to adapt it to the MD; and “optimal diet quality (≥8)” the adherences is correct but can be better, adapting the Mediterranean-diet scale used in the Trichopoulou study [26].
Ethical considerations
As stated in the report of the Ethics Committee of the Universidad Europea del Atlántico, when the study was carried out, was not necessary to be evaluated by an Ethics Committee.
Statistical analysis
The distribution of the data was assessed using the Kolmogorov-Smirnov normality test. The quantitative variables are expressed as mean and standard deviation (X±SD) and the body mass index (BMI) has been distributed using WHO ranges classification. For the quantitative variables, the Student or Anova test were used. The qualitative variables have been expressed as percentages for which chi-square has been used for comparison. The criterion of significance was established at p < 0.05. All computer data were analyzed using the “Statistical Package for the Social Sciences” (SPSS) software, version 22.0 for Windows.
Results
The analyzed sample was made up of a total of 100 students, of which 74 (74%) were women and 26 (26%) were men. The average age was 36.6 (±10.5) years, 52% distributed between 18 and 34 years, 37% between 35 and 49 years, and 11% between 50 and 64 years. The average age was higher compared with other studies in the university population [16, 27], it is because our online education brings your training offer to a larger population who can follow you from home.
When the BMI (kg/m2) was analyzed in the study participants, it was average in 22.6 kg / m2 (±3.3). Our population, was mostly in a situation of normal weight (71%), followed by overweight (20%), and at the extremes, we had students with insufficient weight (5%) and obesity (4%). The BMI of “<18.5 (Underweight)” was represented by the female population (5%) and the majority with an age range of “18 to 34 years” (4%); in the range of BMI of “18.5–24.9 (Normal weight)” (60%) were women (p < 0.001) and in the range of age of “18–34 years” being able to affirm that young women are mostly in normal weight. The BMI of “25–29.9 (Pre-Obesity) was represented by the 20% of our population being 13% males and the 11% in the range of age “35–49 years”. Finally, (Obesity class I) was only the 4% with the same distribution between male and female (2%), represented with a 2% in the range of age “35–49 years”.
Regarding NCDs: No hypertension was (99%), no cardiovascular disease was (100%), no diabetes mellitus 1 was (98%), no diabetes mellitus 2 was (97%), no hypercholesterolemia was (91%) and no hyperuricemia was (98%). No statistically significant differences were found between men and women and age groups.
Lifestyle: They were non-smokers (77%), they drank caffeinated beverages (78%), they did not drink alcoholic beverages (51%) and they practiced physical exercise (3 times/week) (84%). Without presenting statistically significant differences between men and women and age groups. 76% were responsible for the grocery shopping, being higher in women (82.4%) (p < 0.05) and preparing meal were (70%), being higher in women (79.7%) (p < 0.001), Table 1. No statistically significant differences were found between age groups, Table 2.
Non-communicable diseases and lifestyle by sex
Non-communicable diseases and lifestyle by sex
*Significantly different (p < 0.05) **(p < 0.001) using chi-square.
Non-communicable diseases and lifestyle by range of age
*Significantly different (p < 0.05) ** (p < 0.001) using chi-square.
In Table 3, we can see that the average calorie intake in women was (1573±480.2 kcal/day) being lower than the SENC intake recommendations (IR) of (2300 kcal/day) and in men, it was (1877.2±624.5kcal/day), lower than the SENC IR of (3000kcal/day) [28]. The percentage of proteins/day (20.2±5.3) in women (19.6±4.4%) was lower than that of men (22±7.2%) (p < 0.05), but in both cases was higher than the recommendations of the SENC (12–15%). The percentage of carbohydrates (47.2±9%) in women was (47.1±9%) and men were (47.4±9.1%) without significant differences between sexes (p = 0.908), but in both cases was lower than the IR of the SENC of (50 –55%). The percentage of lipids (33.8±7.8%) in women was (34.9±8.1%) being higher than that of men (30.9±6.1%) (p < 0.05), in both cases within the IR of the SENC (30–35%), cholesterol intake (224.9±135.7 mg/day) was higher in men (272.4±153.9 mg/day) than in women (208.3±125.6 mg/day) (p < 0.05). The grams of fiber (18.8±7.3 g/day) in women was (18.2±6.6 g/day) and in men (20.6±8.9 g/day), without presenting significant differences between them (p = 0.144), being lower than the SENC IR of (25–30 g /day) [29].
Distribution of macronutrients by sex
1Moreiras et al. (2011) (28); 2Dapcich et al (2004) (29). Results are expressed in terms of mean±SD. *Significantly different (p < 0.05) using t-Student. % /day: Percentage of macronutrients related to total calorie intake.
As described in Fig. 1, Table 4 and Table 5, the degree of adherence to the food consumption recommendations:
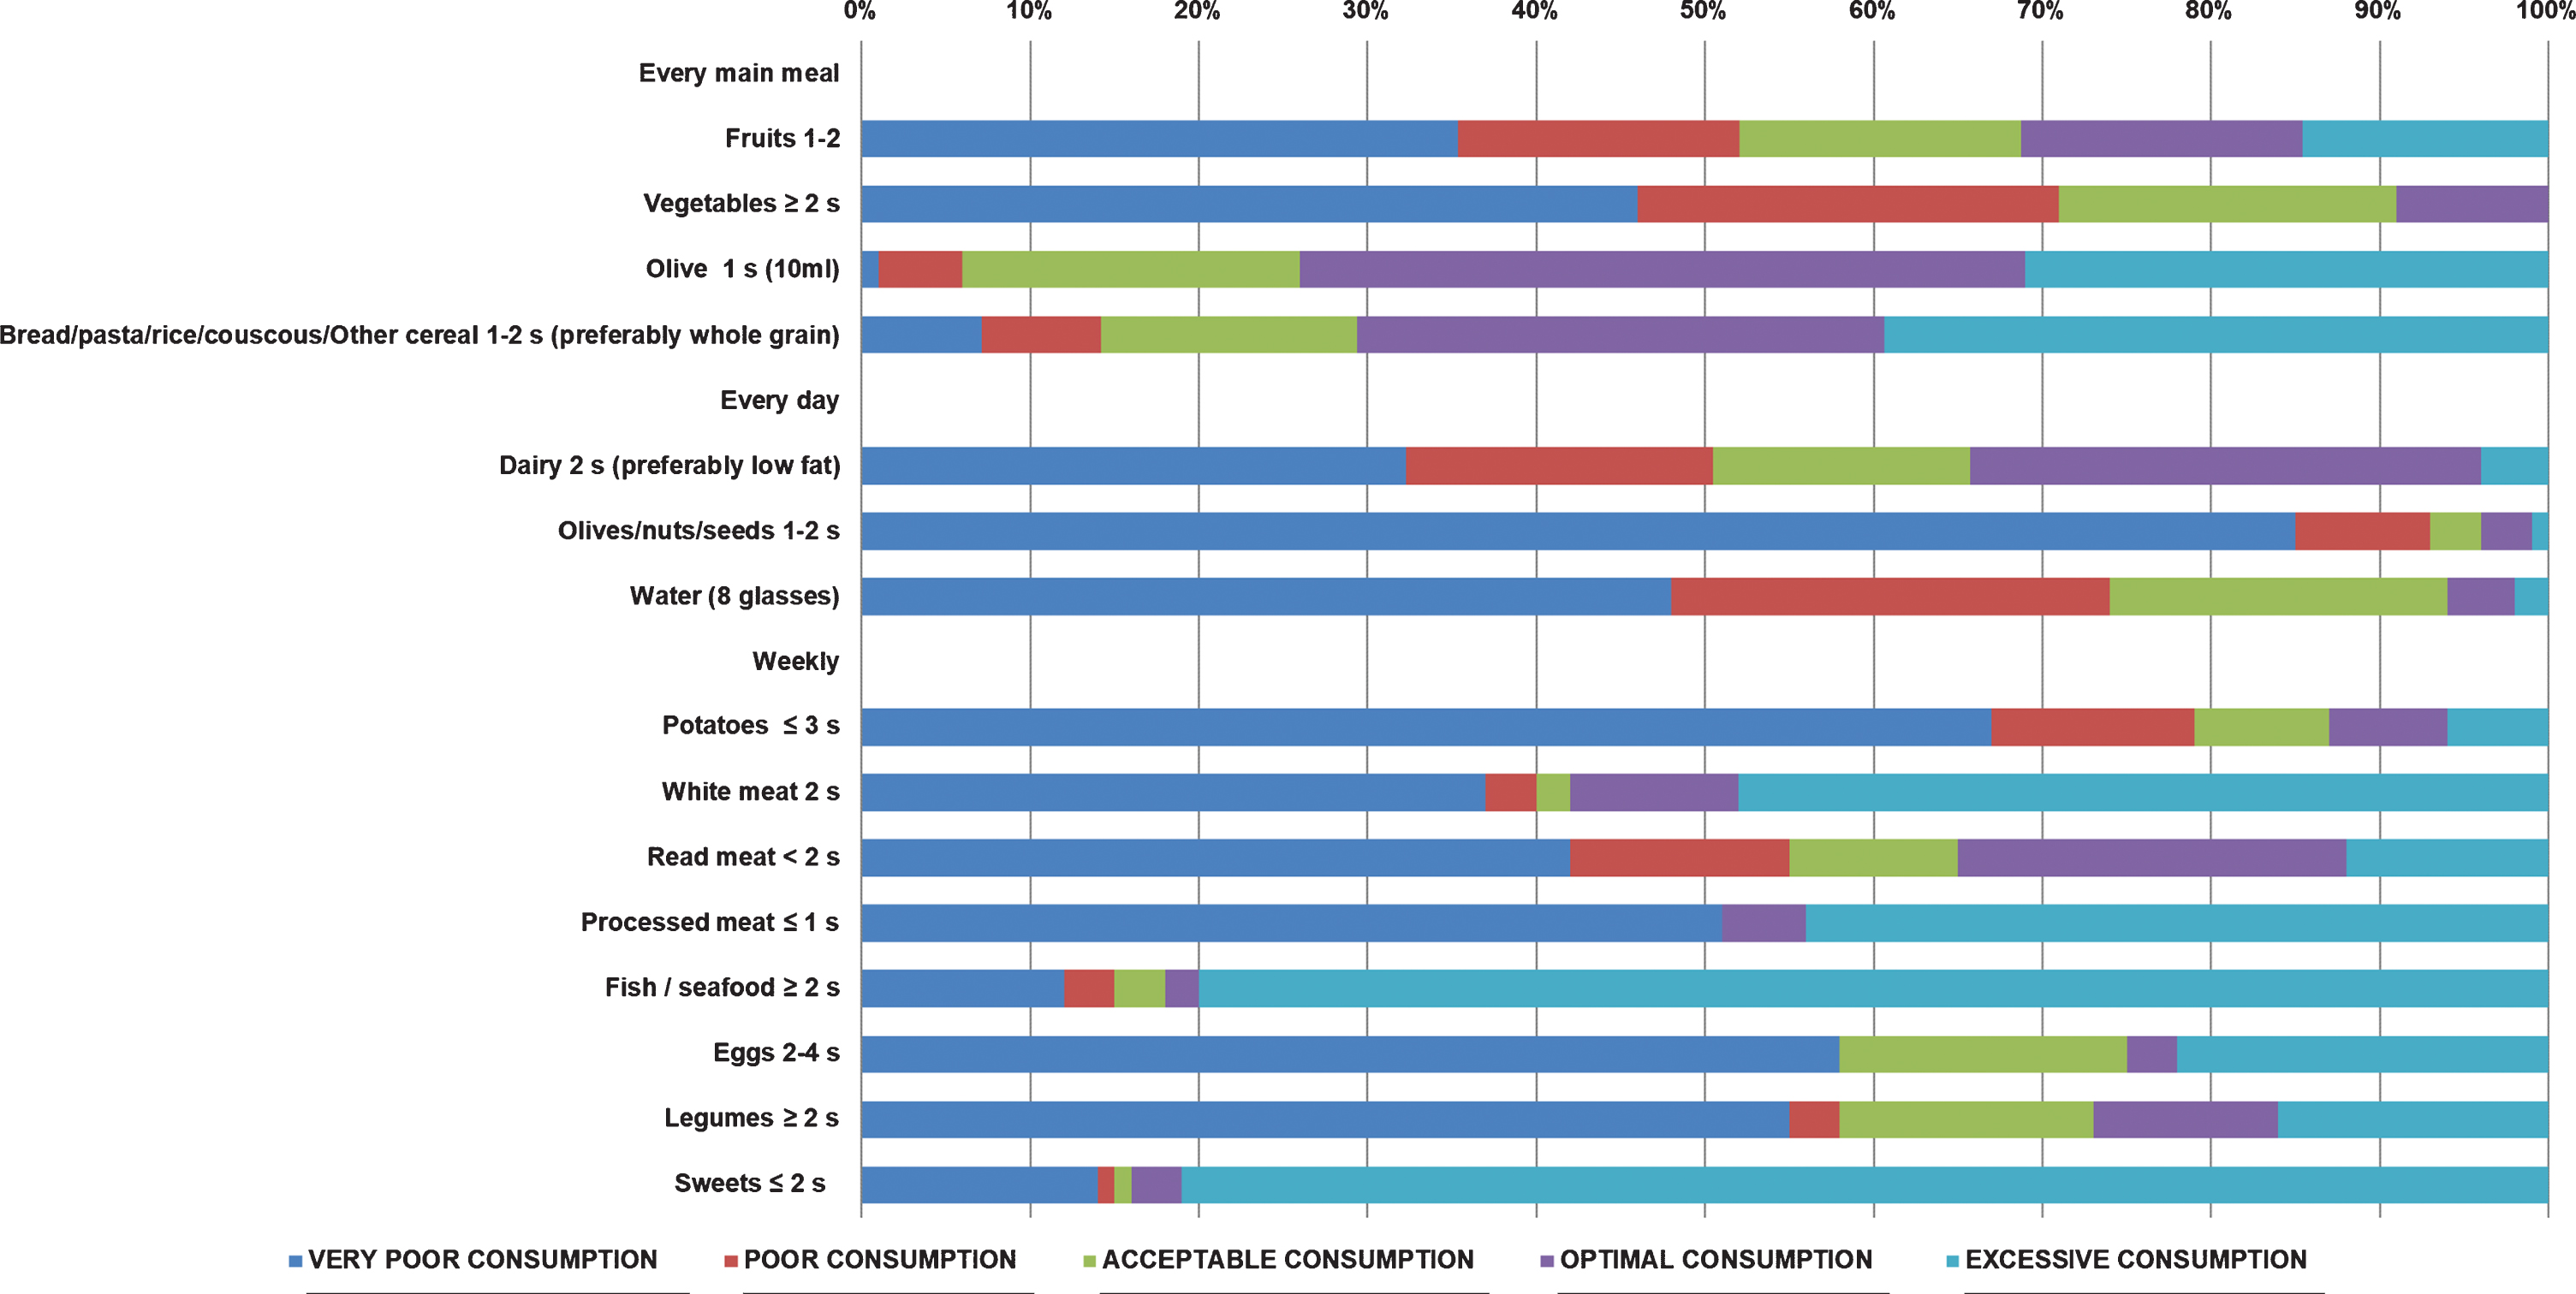
Degree of adherence to DM by postgraduate university students. Grouped by “very poor consumption”, “poor consumption”, “acceptable consumption”, “optimal consumption” and “excessive consumption”.
Percentage distribution of adequacy to DM based on the pyramid of the Mediterranean diet (2010 edition), between men and women
*Significantly different (p < 0.05) using Chi-square test.
Percentage distribution of adequacy to DM based on the pyramid of the Mediterranean diet (2010 edition), between range of age
*Significantly different (p < 0.05) using Chi-square test.
In each main meal: It was “very poor consumption” in fruits in (35.4%), being higher in students aged 18–34 years in (51%) (p < 0.001) and vegetables (46%); “Optimal consumption” in olive oil (43%) and “Excessive consumption” for (Bread/pasta/rice/couscous/other cereals) (39.4%), being higher in students aged 55–64 years by (45.5 %) (p < 0.05).
Regarding daily consumption: It was “very poor consumption” in dairy products (32.3%), nuts/seeds/olives (85%), and in water intake (8 glasses) was “very poor consumption” in the (48%) followed by a “poor consumption” (26%). No statistically significant differences were found between men and women and age groups.
In the weekly consumption: It was “very poor consumption” in potatoes (67%), red meat (42%), especially lower consumption in women (44.6%) (p < 0.05), processed meat (51%), eggs (58%) and legumes (55%). “Excessive” in white meat (48%), fish and seafood (80%) and consumption of sweets, snacks, and soft drinks (81%), being (86.5%) higher in women (p < 0.001).
When analyzing the degree of adherence to MD, we can observe that in “Poor diet quality (< 3)” there were (26%) of the students, in “Medium diet quality [4–7]” the (68%) and in “Optimal diet quality (> 8)” (6%) being female (6%) and on the range of age of “55–64” (18.2%). No significant differences were found between men and women and range or age. Table 6 and Table 7.
Quality of DM by sex
Significantly different (p < 0.05) using Chi-square test.
Quality of DM by range of age
Significantly different (p < 0.05) using Chi-square test.
In Table 8 we can see that there are no significant differences when we compare the adherence with the MD and lifestyle as age, weight, BMI, hours of exercise/week, hours of sleep/day, the number of cigarettes/day, Kcal/day, mg of cholesterol/day, % of proteins, % of carbohydrates and % of lipids. Significant differences were found in the “grams of fiber per day”, being higher in “Optimal diet quality (>8)” (25.6±3.9 g/day) (p < 0.05).
Quality of DM and its relationship with age, BMI, lifestyle, and diet
1Categories according to BMI (WHO): Underweight < 18.5kg/m2; Normal weight: 18.5–24.9 kg/m2; Overweight: 25–29.9 kg/m2; Obese≥30 kg/m2). Results are expressed in terms of mean and±SD. *Significantly different (p < 0.05) using Anova test.
In the Mediterranean area, in the last decades, most of that population have been changing healthy dietary patterns, from ancient lifestyle to globalized behaviours, especially in young people [30]. In adult people has been recently published a systematic review, that shows that 2-point increment in the adherence to a MD is associated with a 10% of all risk of mortality [31]. However, several studies indicate that in the last two decades the adherence to the MD by the Spanish population has decreased [32–34].
Analyzed dietary pattern has become an important approach in food consumption and epidemiology studies, associating the relation on diet-disease [35]. There are two ways to analyses dietary patterns, a priory, using scores or indices to assess how diet agrees with some ideal diet [36], or a posteriori using statistical methods looking the patterns within the study population as we have done in the current study.
In this study, we have a sample of Spanish postgraduate students, mostly female (74%) with a mean age of 36.6 years (±10.5), with most of them in the age range of 18 to 34 years (52%) and presenting normal weight (71%) being (60%) female (p < 0.001). The BMI of < 18.5 (insufficient weight) is represented by women in the age range of 18 to 34 years (4%), as observed in the study by Cutillas with Spanish population [37]. BMI of females was lower than for males (21.7 kg/m2 vs 25.4 kg/m2) as well as calories intake (1573±480.2 kcal/day vs 1877.2±624.5 kcal/day) contrary that was found in Zarei M. study with Iranian Postgraduate students in University of Putra Malaysia [38] were females had lower BMI, but higher calorie intake compares with males’ group.
The intake amount of calories/day for men (1877±625.4kcal/day) and women (1573±480.2kcal/day), are lower comparing with the IR of the SENC [28], we have observed a decreasing trend in energy intake, that have been reported by other studies from Spain [7, 39] and its similar in other studies from European countries [40–42]. Protein intake was (20.2±5.3%) of the energy, well above the upper SENC recommendation limit (< 15%), our results are similar to the ENIDE study with (18%) [43] and higher compared with the ANIBES study results (16.8%) [7]. Carbohydrate intake was below recommendation (47.2±9%) of the SENC energy recommendations (50–55%), similar results were obtained on the ENIDE study [43] and ANIBES study (41.1%) [7]. Fat intake (33.8±7.8%) was close to the SENC recommendations (30–35%) and cholesterol (208.3±152.3 mg/day) was close to the SENC recommendations. Fiber intake (18.8±7.3 g/day) was below SENC recommendations (25–30 g/day), lower results were obtained in the ANIBES study (1.4%) [7]. Intervention studies conclude that high-fat diets (> 35%) low carbohydrate intake (< 50%) and fiber (< 25 g/day), are associated with adverse effects on body weight and chronic disease [44].
Regarding the food consumed in each main meal: the consumption of fruit (35.4%), especially the youngest ones [18–34] (p < 0.05), and vegetable (46%) was “very poor consumption”. Decreasing fruits and vegetable intake by the Spanish population has been described in the ANIBES study [45]. MD recommendations endorse a minimum consumption of fruit to 150–300 g/day (1-2 servings/day) and up to over 300 g/day (2 servings/day) of vegetables. These recommendations are based on strong evidence that related fruit and vegetables intake with cardiovascular disease prevention, possible for decreasing risk of colon cancer, pancreatic diseases, and stroke [46]. When compared with other European countries we can observe that fruit and vegetable intake are even lower than the Spanish population [47] and similar intake has been described in Italian population [48]. A cause may be the high price, lack of time, and not being so appetizing, as has been described in other studies [49, 50].
The consumption of olive oil was “optimal consumption” in the (43%), among the Spanish population, olive oil consumption is quite common, and its price is affordable [51]. Cereal consumption was “excessive consumption” in the (39%), especially in students aged [–64], followed by “optimal consumption” in the (31%). In the last decades carbohydrate intake in the Spanish diet came from grain and derivates, being bread the most consumed [7]. In Spain, there has been a moderate decrease in the consumption of cereals as derivatives, preferable whole grains, replaced by other groups more processed and transformed [52].
In daily consumption: the consumption of dairy products was “very poor consumption” in the (32.3%) and “optimal consumption” in the (30.3%), milk and dairy products have experienced a reduction in the last years in the Spanish population [53] if we compare with other European countries, we can conclude that Netherlands has a higher consumption than Spain and Belgium [47]. Olives/nuts/seeds group intake was “very poor consumption” in the (85%), MD is characterized by an intake of olive, nuts, and seeds as a source of fiber, non-saturated fat and vegetal proteins [54], in Spanish population the intake of nuts, has been decreased in the last decades [53].
Water intake was “very poor consumption” in the (48%) followed by a “poor consumption” (26%), in Spain the intake of soft drinks has increased 27% in the last decades, displacing water and alcoholic beverages [53].
In weekly consumption: a “very poor consumption” in the (67%), was for potatoes, MD recommendations endorse a maximum consumption of 470 g/week (< 3 servings/week) reduction in the intake of potatoes was found as well in the ANIBES study [45]. Legumes were “very poor consumption” in the (55%), the consume of legumes in Spain have decreased in the last decades, MD recommendations (≥2 servings/week) is to increase legumes consumption for being a source of proteins, fiber and have an important role in colon cancer prevention, glucose reduction and risk of cardiovascular diseases [55]. Eggs consumption was “very poor consumption” in the (58%), egg consumption has experienced a decrease from the de 4.3 medium-sized/week in 2000 [39], one reason could be the bad press receive for the high cholesterol content; recently review, did not show evidence to support a role of dietary cholesterol in the development of cardiovascular diseases. Eggs contain minimal saturated fatty acids (1.56g/egg), high-quality protein, and they are rich in several micronutrients [56]. Red meat (42%) was “very poor consumption” especially lower consumption in women (p < 0.05) and processed meat (51%) was “very poor consumption”, one of the reasons could be the advice of the World Health Organization (WHO) to avoid high intake of red meat and processed meat for the risk to develop colon cancer [57]. Although “excessive consumption” was found in white meat (48%), fish, and seafood (80%). Finally, sweets were “excessive consumption” (81%), especially in women (p < 0.05), the association was found in sugary soft drinks, displacing water consumption [58].
In our analysis we can conclude that women are frequently more weight-conscious and try to limit calories, reducing the intake of carbohydrates and fat, improving protein [59]. Besides, consumption of fruit and vegetables generally increases during the transition from young to adult [60].
In the analysis of the quality of the diet, “Medium diet quality [4–7]” (68%), followed by a “Poor diet quality (≤3)” (26%) and finally in “Optimal diet quality (≥8)” (6%) being female on the range of age of “55–64”. Moving away from the recommendations of the MD, choosing more palatable foods, that require less time to be prepared. Age, BMI, or lifestyle were not found to influence the final classification, assuming that the different age groups behave similarly when it comes to moving away from the MD pattern. A diet with a mayor intake of fiber, correlates with a greater adherence to the MD.
Limitations
The cross-sectional design provides evidence for associations but not for a causal relationship. Studies based on being self-reported surveys and a 3-d meal record and where it is possible that occasionally foods were not evaluated correctly, we did not use MEDAS-14 to compare the adherence to the MD with our results. A self-filling questionnaire could be another limitation, especially on the anthropometric measures. Our sample size is small to be a representative population and finally the inadequate distribution among genders and age groups.
Conclusions
Spanish postgraduate students from the food area have good health and a healthy lifestyle but are moving away from the MD model. These results show us the importance of establishing awareness campaigns for the improvement of eating habits aimed at the postgraduate university population, who must adapt to the high demand of their studies together with a full or part-time job and be aware that their diet and lifestyle will determine the future of your health. Similar studies should be done to compare our results.
Footnotes
Acknowledgments
We thank Anna Marín, Lili Zabala and Marilyn Montejo (Fundación Unibersitaria Iberoamericana) for their colaboration collecting data. There was no external funding for the study.
Conflict of interest
The study authors declare that they have no conflicts of interest.