
Abstract
BACKGROUND:
Polyphenols are a group of compounds distributed in foods of plant origin and have been considered as effective protective agents against chronic diseases. To date, there are limited data on polyphenol intakes worldwide.
OBJECTIVE:
The aim of the present study was to describe the intake of polyphenols and their subclasses in Chile based on data extracted from the National Food Consumption Survey 2010 –2012 (ENCA).
METHODS:
A total of 3658 participants were selected from whom information on food consumption frequency, anthropometric, clinical, socioeconomic and lifestyle variables were available.
RESULTS:
The mean intake value of total polyphenols was 979.5 + 695.5 mg/day. A higher intake was observed in men than in women. In addition, among adults, there is a higher consumption in the South macrozone. An increase in the intake of total polyphenols was evidenced when the population belonged to the high socioeconomic stratum, and the most consumed types were flavonoids and phenolic acids.
CONCLUSION:
Due to the growing evidence that shows a protective effect of polyphenol consumption, it is necessary to carry out more research related to the consumption of these compounds, promoting the consumption of foods that provide them and thus contributing to improve the current epidemiological.
Introduction
Polyphenols are a group of bioactive compounds widely distributed in foods of plant origin and are an important part of the human diet [1]. The quality of evidence with respect to the protective factor of plant-based foods (fruits, veges, whole grain cereals, cocoa, and seeds) for cardiovascular and chronic diseases is increasingly compelling [2], with polyphenols being considered effective protective agents, due to their antioxidant capacity [3]. More than 500 different polyphenols have been identified, which are classified according to their chemical structure in flavonoids, phenolic acids, lignans and stilbenes, differing in their bioavailability and biological effectiveness [4]. The group of flavonoids is the most abundant class of polyphenols found in the diet, including flavonols, flavanones, isoflavones, anthocyanins and flavonoids, followed by phenolic acids (benzoic acid and hydroxycinnamic acid), lignans and stilbenes [5]. Polyphenols can reduce the harmful effects of advanced glycation through various mechanisms, such as the inhibition of diverse intermediary products in the formation of reactive oxygen species (ROS), the inhibition of Schiff base, Amadori products, and the formation of dicarbonyl groups [6]. Similarly, other mechanisms with effects on intracellular and intercellular signalling pathways have been identified, such as the regulation of nuclear transcription factors, the metabolism of fats and the modulation of the synthesis of inflammatory mediators such as cytokines, tumour necrosis factor-alpha (TNFα), interleukin-6 (IL-6) and C-reactive protein (CRP) [7]. Moreover, recent research has reported that a higher intake of polyphenols, especially lignans, some types of flavonoids and phenolic acids, has an inverse association with the occurrence of cardiovascular events [8, 9], high blood pressure [10], type 2 diabetes mellitus [11, 12] and chronic kidney disease [13]. Furthermore, it has been documented that in individuals with metabolic syndrome, a higher intake of some polyphenol subclasses such as hydroxycinnamic acids, alkylmethoxyphenol, and methoxyphenol was inversely associated with serum uric acid levels and hyperuricemia [14]. Similarly, these protective effects have been found for diverse types of cancer, a disease that, due to epidemiological transition, has become the leading cause of death in Chile, ahead of chronic diseases as from the year 2019 [15]. Particularly, it has been reported a significant inverse association between the intake of total polyphenols and some specific subtypes, such as stilbenes and lignans, and the risk of gastric cancer [16, 17], breast cancer in postmenopausal women [18], prostate cancer [19], and skin cancer [20]. It has been observed that some spices such as turmeric, curry, pepper, clove, cinnamon, and extracts from red bilberries, black grapes or raspberries have been identified among the foods with the greatest content of polyphenols, having a great antioxidant potential [21, 22]. Considering the foregoing, it is relevant to study the consumption of antioxidant food sources in different populations, however, there is limited data currently available on polyphenol intake. In the European countries, total polyphenol intake varies from 584 to 1786 mg/day [23], with Denmark being the country with the highest intake, specifically 1786 mg/day in men and 1626 mg/day in women, whereas the lowest intake was that of Greece with 744 mg/day in men and 584 mg/day in women, where the main food sources are non-alcoholic beverages (coffee, tea, fruit juice), fruits, veges, and wine [24]. On the other hand, the daily intake of flavonoids in the United States has been estimated to range from 358 to 413 mg/day, mostly consisting of flavanols from sources such as apple, orange juice and strawberries, with consumption increasing with age and income [25], whereas in Hispanic population, specifically in Mexico, the average total polyphenol intake ranges from 536 to 750 mg/day [23]. Similarly, the average daily total polyphenol intake in Brazil has been estimated in 1198.6 mg/day, consisting particularly of phenolic acids and flavonoids from sources such as coffee, pulses, and polenta [26]. The objective of the present study was to describe dietary polyphenol intake in Chile, using the Phenol-Explorer database, based on data extracted from the National Food Consumption Survey 2010 –2012.
Material and method
Study design
Data were extracted from the National Food Consumption Survey (ENCA, as its acronym in Spanish) 2010–2012, which was conducted between November 2010 and January 2011 in Chile [27]. The database is publicly available, and reuse is permitted (www.minsal.cl/enca/, accessed in November 2022). The ENCA is a cross-sectional observational study designed to know consumption patterns in the context of behaviours and dietary habits of the Chilean population, providing a background for the design of public policies. Researchers used a non-probabilistic stratified sampling approach, considering 10 strata determined by 2 variables: the first was “Macrozone” (North, Northern Center, Southern Center, South, and Metropolitan); and the second, “Area of residence” (urban and rural), multi-stage for the selection of sampling units (commune, census block, household, and person); the systematic random sampling method was applied for the selection of the individuals that were surveyed. The final sample size consisted of 5120 individuals, with 4920 complete and valid surveys having been conducted. For the present study, a total of 3658 participants were selected, including men and women aged > 18 years, whose information on frequency of food consumption and anthropometric, clinical and lifestyle variables was available (Fig. 1).
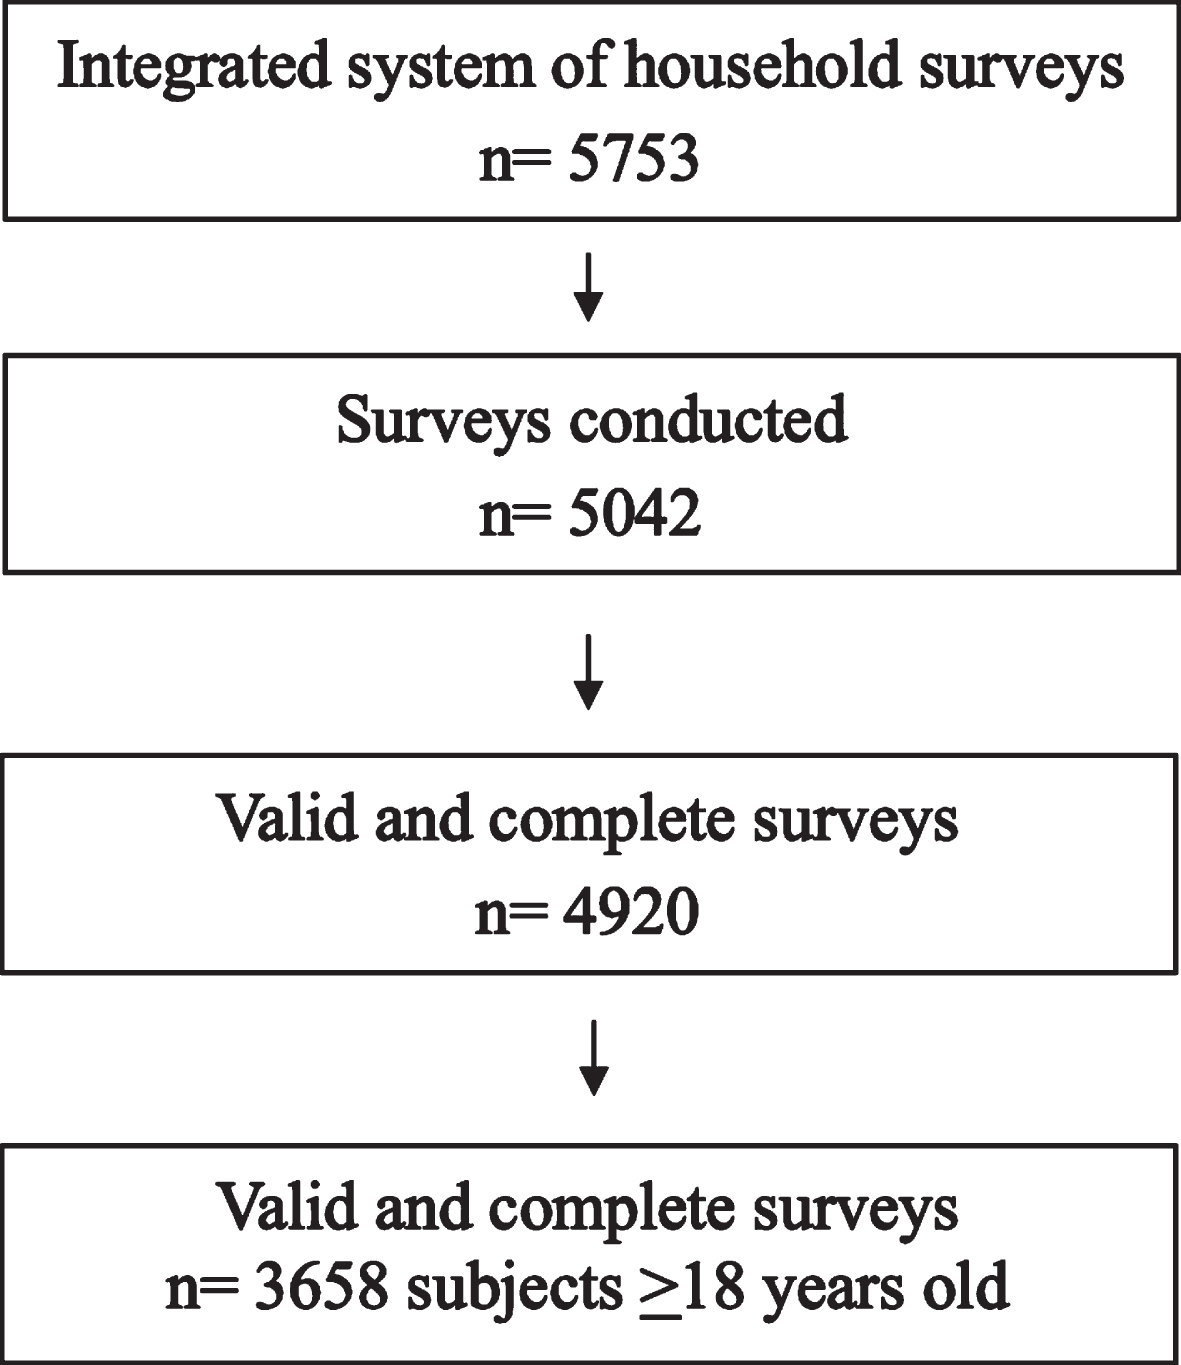
Flowchart of the study design.
The ENCA collected information on the household characteristics using a structured questionnaire which was applied by means of a personal interview that included socioeconomic, health and lifestyles variables. Variables considered for this study were: sex (female or male); age (years); age group (18–64 years and > 65 years); region of residence (Iquique, Antofagasta, Copiapó, La Serena, Valparaiso, Rancagua, Santiago, Talca, Concepción, Temuco, Valdivia, Puerto Montt, Punta Arenas); area (urban or rural); macrozone, according to the distribution established by the Regional Ministerial Secretariats of Chile, and recoded for the purposes of this study (North, Center, South, and Metropolitan); socioeconomic level (low, middle, and high); educational level (do not know/do not answer, unschooled/illiterate, primary education, secondary education, and higher education); healthy eating index (unhealthy, changes are required, healthy); current diseases (high blood pressure, type 2 diabetes mellitus, high cholesterol, acute myocardial infarction, and stroke); and intensity of daily activities (physical inactivity, little activity, moderate activity, vigorous activity, do not answer). In addition, anthropometric variables such as weight (kg), height (m), and waist circumference (cm) were included. The presence of abdominal obesity was assessed on the basis of these data, as a conditioning risk factor for cardiovascular risk (waist circumference > 90 cm and > 80 in men and women respectively) [28], and nutritional status was classified according to Body Mass Index (BMI) in the categories: low weight (≤18.5 kg/m2), normal weight (18.5–24.9 kg/m2), overweight (25–29.9 kg/m2), and obesity (≥30 kg/m2) for adults; and underweight (≤23 kg/m2), normal weight (23.1–27.9 kg/m2), overweight (28–31.9 kg/m2), and obesity (≥32 kg/m2) for older adults.
Food intake assessment
Food intake was assessed through the application of a food frequency of consumption questionnaire (FFQ) that allows to know the usual pattern of consumption of the participants, considering information on the food type, frequency and quantity consumed during the month prior to the interview. To quantify consumption in household measures, the Atlas Fotográfico de Preparaciones Típicas Chilenas [Photographic Atlas of Typical Chilean Preparations] was used [29], which facilitated the indication of portion size by the interviewee. Subsequently, portions were converted to grams (g) or millilitres (ml), as appropriate. Food groups were structured as follows: a) cereals, potatoes, and fresh legumes; b) veges; c) fruits; d) dairy products; e) fish, meats, eggs, and dried legumes; f) oils and fats; g) sugars; h) drinks and beverages; i) sweeteners; and j) alcoholic drinks.
Estimation of polyphenols intake
For the estimation of polyphenol intake in the Chilean population, those foods that did not contain polyphenols or whose content was very low were excluded, such as foods of animal origin and some cereals, or those foods that because of their very low consumption, contribute insignificantly to polyphenol intake (example cocoa or chocolate powder). The information on polyphenol content from food sources was obtained from the Phenol-Explorer database (www.phenol-explorer.eu, accessed in November 2022) which contains data on 459 foods and their composition, including 9 classes and 67 subclasses; this data was mainly obtained by chromatography. In the case of lignans and phenolic acids in specific food sources such as nuts, olives and pulses, chromatography was performed after hydrolysis. With the purpose of achieving a more accurate measurement, an additional coefficient was applied to the value of the content of each polyphenol in fresh foods, which is also referred to as retention factor, determined by the formula [Concentration in processed foods = (RF x CFF)/PF], where RF = Retention factor; CFF = Concentration in fresh foods; PF = Performance factor, and that consists of the proportion of a given polyphenol retained after processing, adjusted for change in water content of the food product, included in the information provided by the Phenol-Explorer database [30]. The following classes of polyphenols were considered in this study: flavonoids (flavanols, flavones, flavonols, anthocyanins, others), phenolic acids (hydroxybenzoic acid, hydroxycinnamic acid), stilbenes, lignans and other polyphenols (hydroxybenzaldehydes, hydroxybenzyl ketones, hydroxycoumarin). Total polyphenol content was calculated as the sum of the individual compounds (classes). Individual polyphenol intake was estimated by multiplying the content of individual polyphenols of each food item by the daily food intake, whereas total polyphenol intake was estimated as the sum of individual polyphenol intakes. Some foods present in the FFQ could coincide with several entries in the Phenol-Explorer database (for instance, olive oil could be considered as extra virgin or virgin olive oil), and in such cases, the food that was consumed the most among the Chilean population was considered (in this example: virgin olive oil).
Statistical analysis
The statistical analysis was performed with the IBM SPSS Statistics v21 software. Descriptive statistics for quantitative variables were described with average and standard deviation, while categorical variables were described with frequencies and percentages. The normality of data distribution was verified with the Kolmogorov Smirnov test, and the difference between mean polyphenol intake, with respect to sociodemographic, lifestyle and nutritional status variables, and the intake of polyphenol classes according to age group was tested with the Mann Whitney or Kruskall Wallis test, as appropriate. A p value of <0.05 was considered statistically significant for all tests.
Results
Total polyphenols intake
The sample was composed of 3658 participants, whose average age was 49.4 + 18.8 years old, and it was mostly represented by women (64.4%). Mean body weight for the total population was 72.1 + 14.9 kg, with a BMI of 28.5 + 5.3 kg/m2. Participants were divided into two groups according to their age in adults (18–64 years) and older adults (≥65 years), whose frequencies and percentages regarding sociodemographic, lifestyle and nutritional status characteristics are shown in 1. The value for the mean intake of total polyphenols was 979.5 + 695.5 mg/day, with the greatest intake being observed in adults (986.8 + 710.8 mg/day), with respect to older adults (957.5 + 647.1 mg/day), without showing a statistically significant difference (p = 0.265). Total polyphenol intake is presented according to the different variables in 2. A higher intake of total polyphenols is observed in men when compared to women, both in adults and older adults (p < 0.0001). When analysing intake according to the place of residence of the total population, the regions of Valdivia, Concepción and Talca are those with the greatest consumption (Supplementary material SI), while when comparing by macrozone, in the group of adults there is a greater consumption in the South macrozone (p < 0.0001), in contrast with what it is observed in older adults, with consumption increasing in the Center macrozone (p < 0.0001), and showing a significant difference when comparing by socioeconomic level, with an increase in the intake of total polyphenols being found when the population belonged to high socioeconomic status, which is further complemented with a high consumption of polyphenols in individuals that follow a healthy diet, according to the Eating Index. Additionally, a higher intake was observed among subjects with waist circumference within normal limits, nevertheless, this difference was not significant.
General characteristics of the participants (n = 3658)
General characteristics of the participants (n = 3658)
Data are presented as frequencies (n) and percentages according to age groups. (ɛ)Recoding considered the distribution established by the Regional Ministerial Secretariats of Chile. (Ψ)Classified according to Body Mass Index (BMI = kg/m2). (τ)Classified according to waist circumference range (≥90 cm and > 80 cm in men and women, respectively). (&)Healthy Eating Index. (η)Cardiovascular Risk.
Intake of total polyphenols according to sociodemographic characteristics, lifestyle, and nutritional status of the participants (n = 3658)
Data are presented as mean and standard deviation (SD). Comparisons between categories were made using the U Mann-Whitney test or the Kruskal Wallis test, as appropriate. (*) statistical significance p < 0.05. (Ξ)Recoding considered the distribution established by the Regional Ministerial Secretariats of Chile. (Ψ)Classified according to Body Mass Index (BMI = kg/m2). (τ)Classified according to waist circumference range (≥90 cm and > 80 cm in men and women, respectively). (&)Healthy Eating Index. (η)Cardiovascular Risk.
Among the food items considered in the FFQ applied during the data collection phase of the ENCA, 99 of them contained polyphenols, according to the Phenol-Explorer database. A total of 5 classes and 15 subclasses of polyphenols were identified in these foods. The main classes were flavonoids (426.5 + 325.7 mg/day), phenolic acids (494.3 + 575.1 mg/day), stilbenes (0.59 + 2.10 mg/day), lignans (40.4 + 52.3 mg/day), and other polyphenols such as hydroxybenzaldehydes, hydroxybenzyl ketones, and hydroxycoumarin (18.5 + 77.5 mg/day), which contribute with 43.5%, 50.5%, 0.06%, 4.1%, and 1.9% to total intake, respectively. The intake of different classes and subclasses of polyphenols, according to the general characteristics of the population, is shown in Figs. 2and 3 . Details of polyphenol subclass averages by age, sex and area of residence are shown in supplementary material II. In brief, it is observed a significant difference in the consumption of flavonoids, phenolic acids, stilbenes and other polyphenols among adults and older adults. With respect to the place of residence, the South macrozone is the region that contributes the most to total polyphenol intake, with an average of 1013.0 + 753.5 mg/day, represented by the consumption of phenolic acids (818.5 + 706.4 mg/day), followed by flavonoids (258.3 + 261.8 mg/day). Similarly, when comparing the intake of polyphenol subclasses by socioeconomic level, a significantly greater consumption is observed in the high socioeconomic level for all classes (p < 0.005), except for total flavonoids. In addition, polyphenol subclasses are shown in Fig. 4. Within the flavonoid group, flavanols are the compounds that contribute the most to total flavonoid intake (73.2%), followed by anthocyanins (15.6%), while in the case of phenolic acids, the most abundant compound is hydroxycinnamic acid (87.3%), followed by hydroxybenzoic acid (15.6%).

Polyphenol classes according to (a) age group, (b) sex, and (c) area of residence. Data are presented as mean and standard deviation (SD). Comparisons between categories were made using the U Mann-Whitney test. Different signs between categories represent statistical significance (p < 0.05).
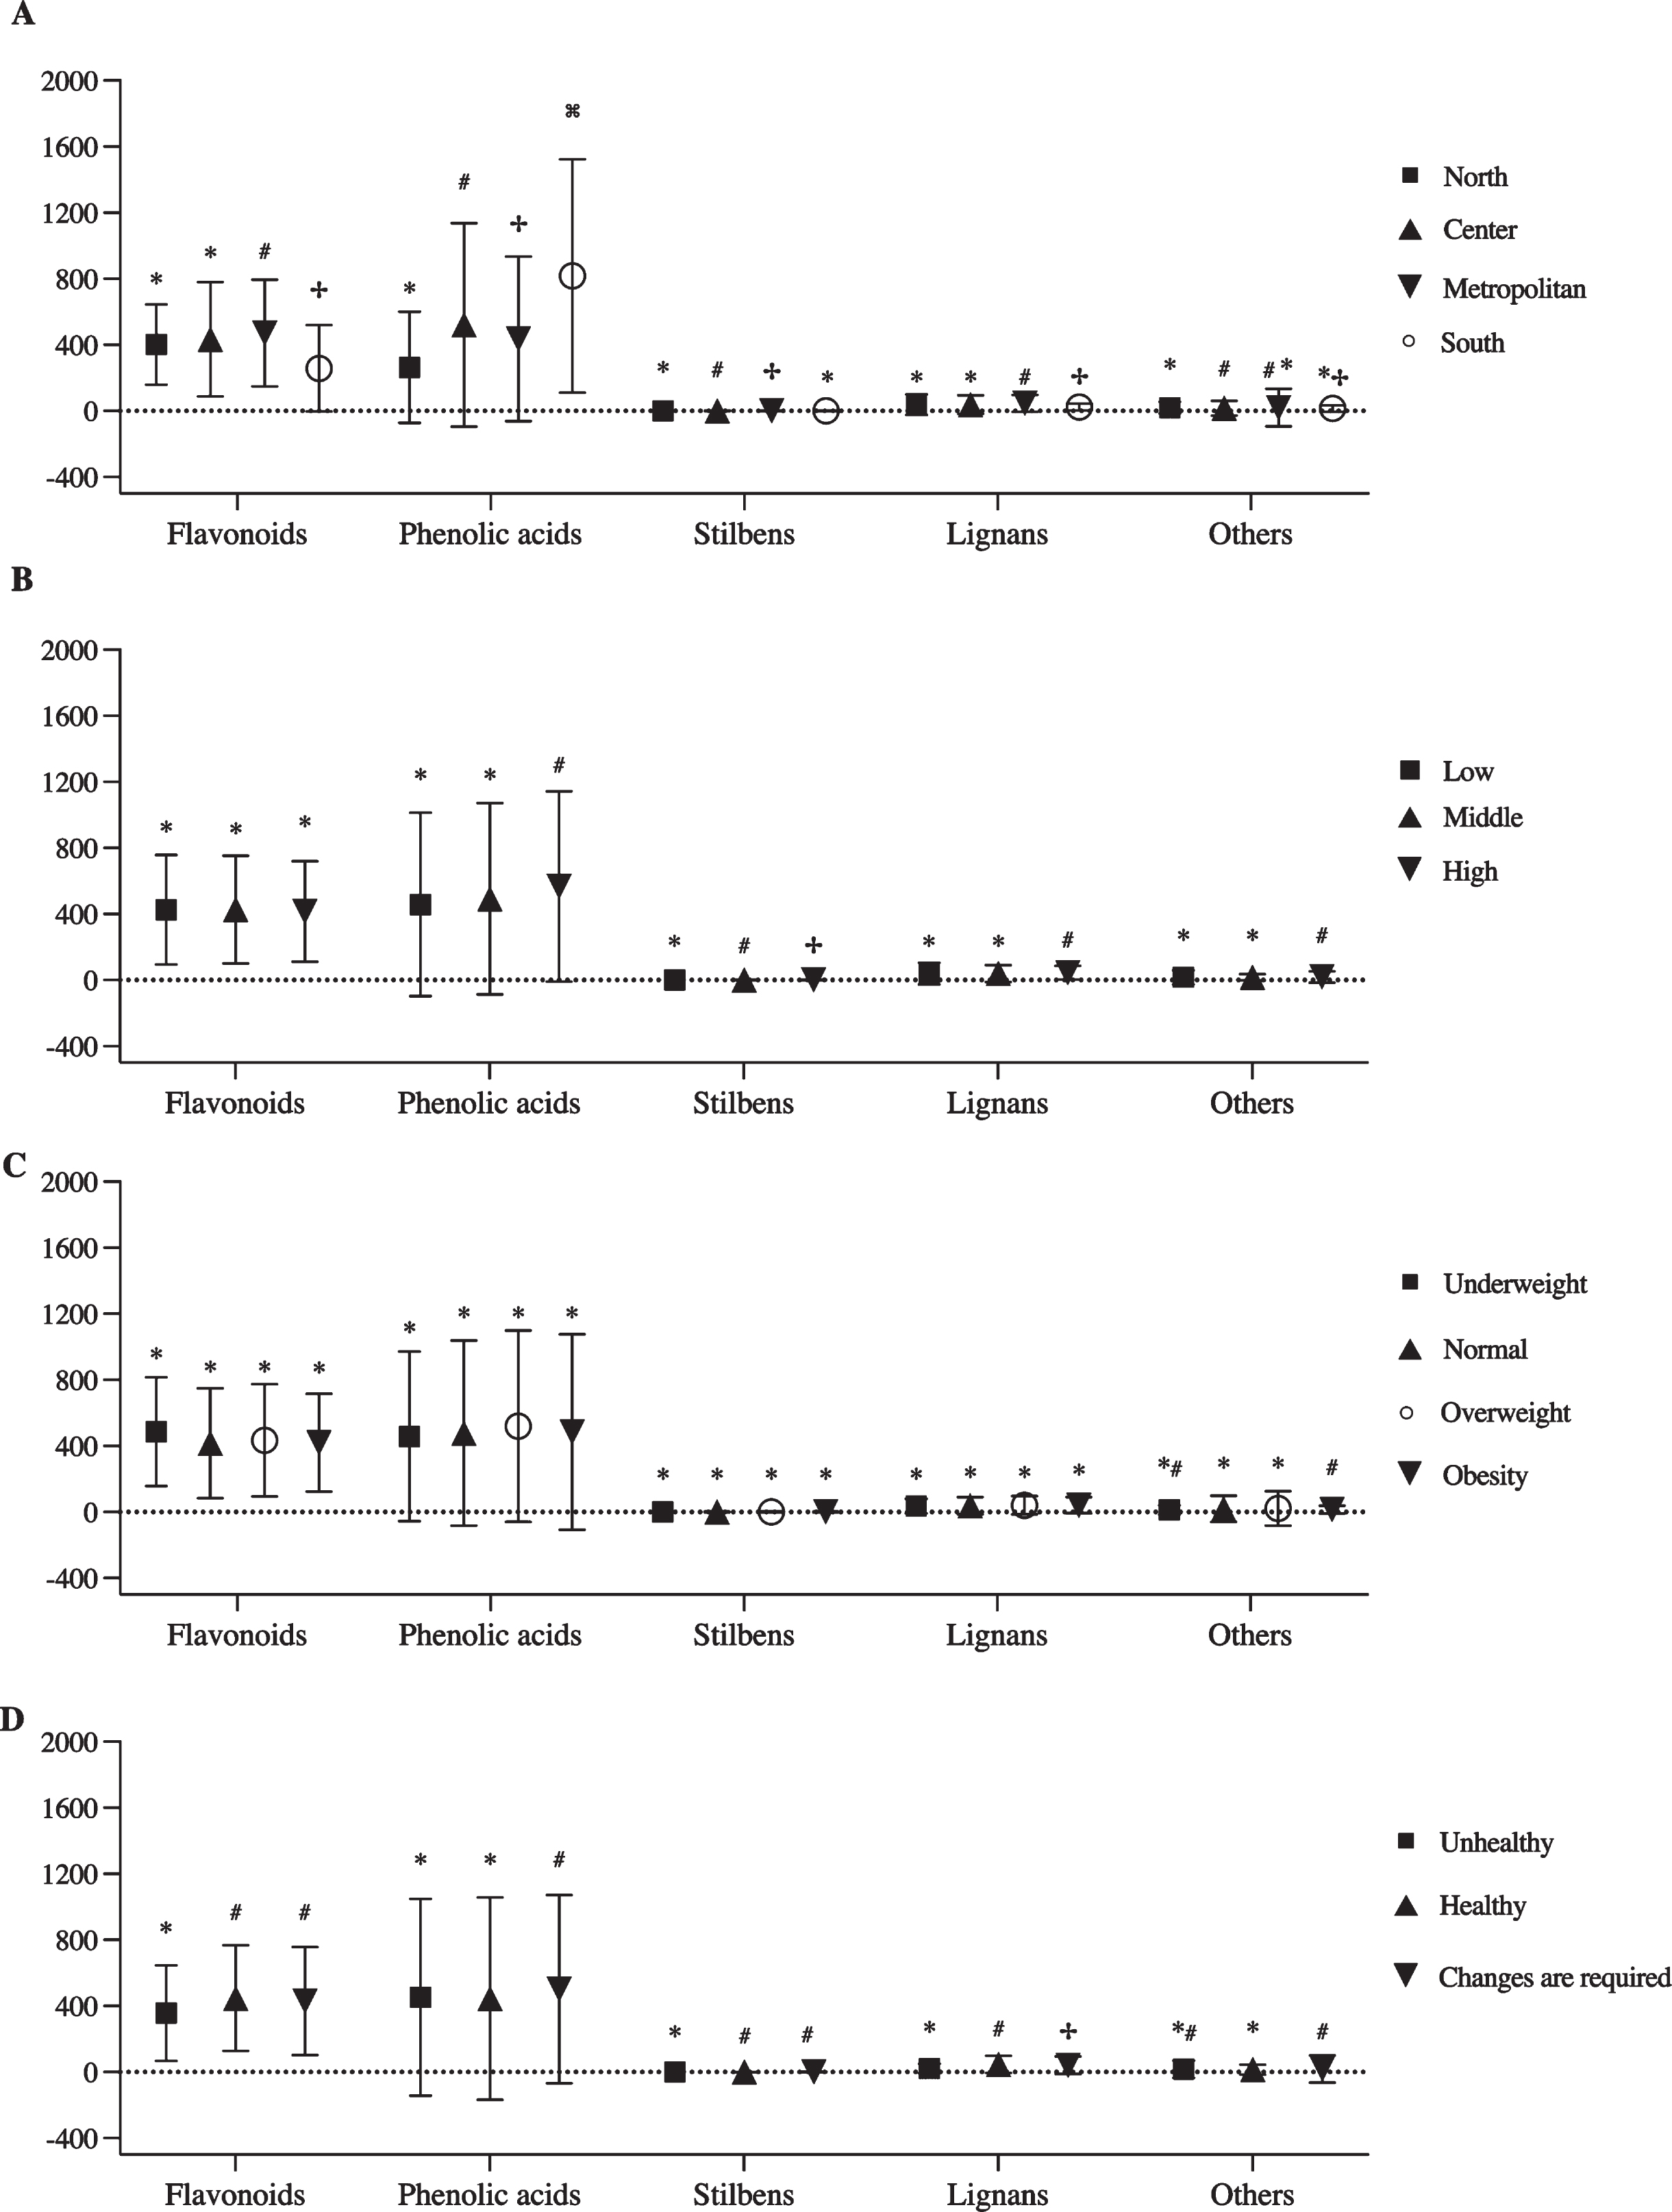
Polyphenol classes according to (a) macrozone, (b) socioeconomic level, (c) nutritional status, and (d) diet quality index. Data are presented as mean and standard deviation (SD). Comparisons between categories were made using the Kruskall-Wallis test. Different signs between categories represent statistical significance (p < 0.05).
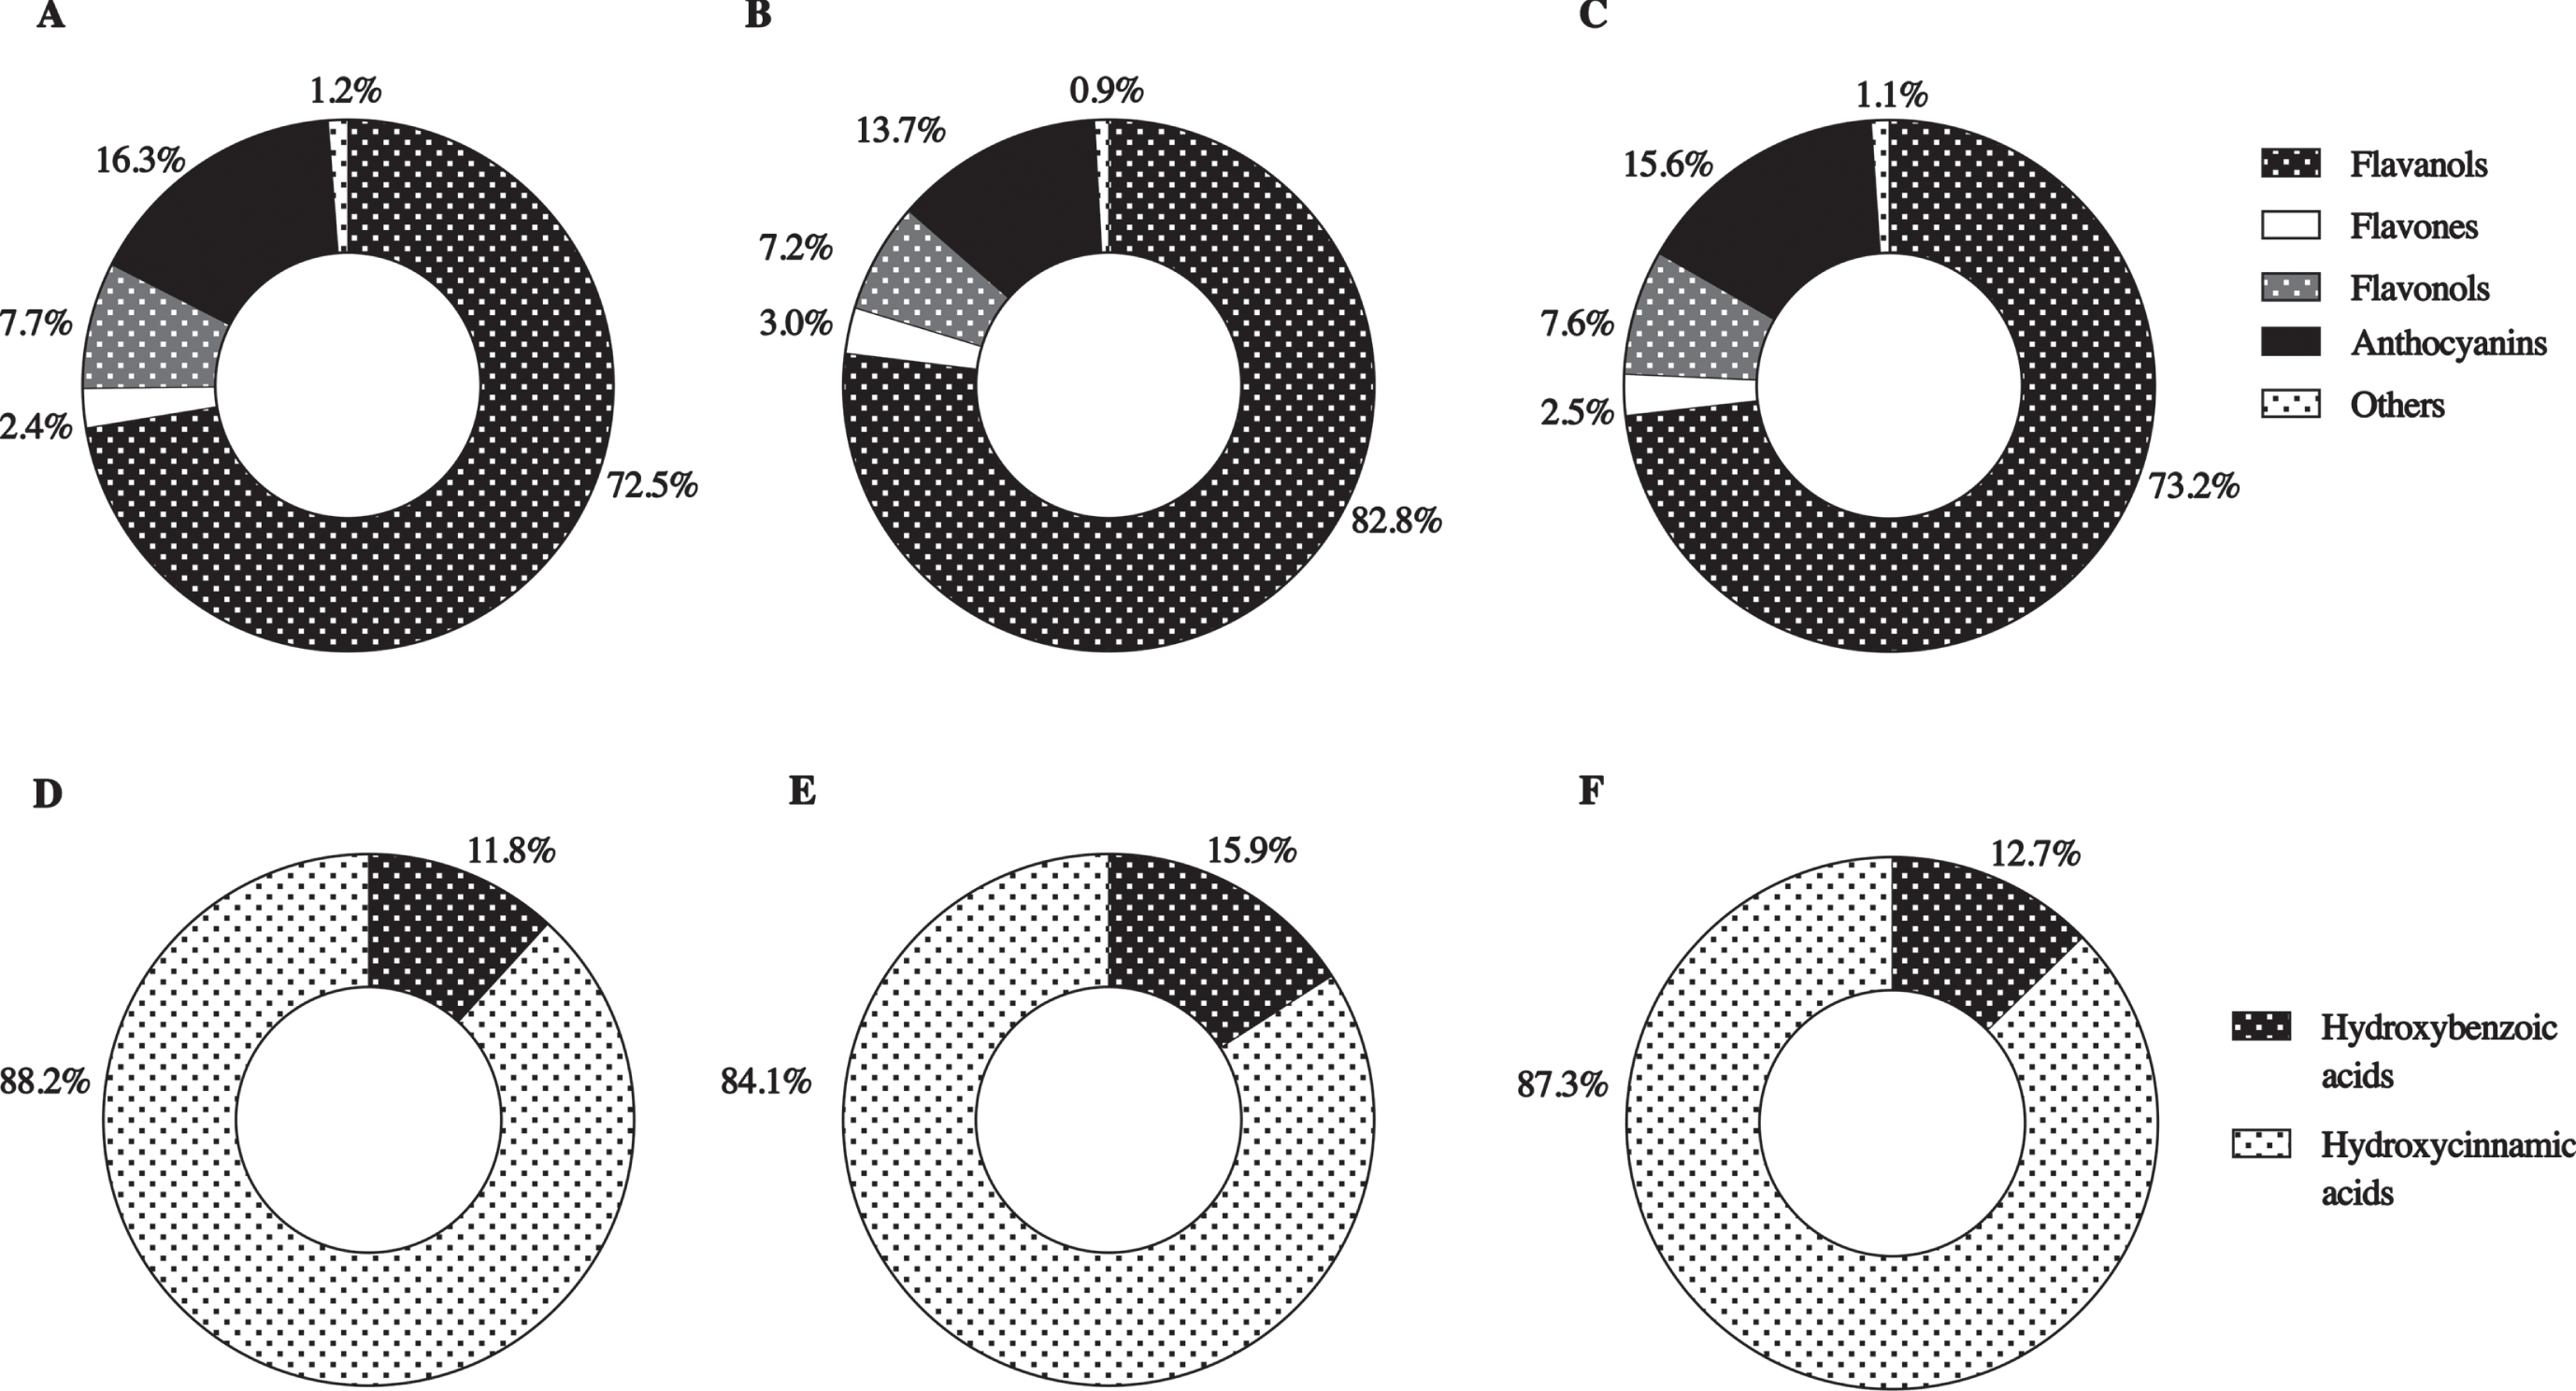
Percentage distribution of flavonoid subclasses according to age groups in (A) 18–64 years, (B) 65 years or older, (C) total population; and phenolic acids subclasses according to age groups in (D) 18–64 years, (E) 65 years or older, (F) total population (n = 3658).
The objective of the present investigation was to describe polyphenol intake and polyphenol classes in the population residing in Chile, considering data from the National Food Consumption Survey conducted between the years 2010 and 2011 [31], which considered the application of the FFQ, an instrument that allows to compare consumption differences between the age groups of adults and older adults. Furthermore, the use of Phenol-Explorer allows a direct comparison with studies that have considered the intake of these compounds in other countries, using the same database. As far we know, this it is the first study that quantifies the consumption of polyphenols in the Chilean population. The observed mean total polyphenol intake was of 979.5 mg/day, with a slightly greater consumption in adults (986.8 mg/day), with respect to older adults (957.5 mg/day), ranging from 726.9 mg/day in the North macrozone to 1116.6 mg/day in the other end of the country, which may be associated with greater availability of fruits and vegetables in the regions of the South macrozone, a geographical area with higher levels of rainfall and humidity, factors that favourably contribute to agriculture [32]. When comparing the average intake of total polyphenols in the Chilean population, it is observed an intake higher than that reported in studies including Brazilian (364.3 mg/day) [33] and Mexican populations (694 mg/day) [34], and a similar intake to that of the American (884.1 mg/day) [35] and Finnish populations (863 mg/day) [36]; nevertheless, the consumption is much lower when compared to European countries (1147.5 mg/day), specially Denmark, with an average intake of 1786 mg/day in men and 1626 mg/day in women. These differences can be explained by dietary patterns, that in the case of Europe correspond to a Mediterranean profile, higher in vegetables and whole grains [24]. Although in this investigation no significant differences were found between polyphenol intake in adults and older adults, the latter presented a lower intake, a scenario in which not only it is necessary to pay attention to the quantity of polyphenols consumed, but also to the fact that as subjects age, the activity of transporters declines, as in the case of hydrochloric acid and enzymes associated to the metabolism of polyphenols, negatively affecting their bioavailability [37]. The becomes relevant since it has been demonstrated that there is a correlation between polyphenol intake and the reduction of risk factors for chronic diseases [38], which have a higher prevalence as the population ages, such as high blood pressure, which affects to 73.3% of older adults versus 45.1% of adults, and type 2 diabetes mellitus, whose prevalence is around 30.6% and 18.3% in older adults and adults, respectively [39]. In addition, in this study it was observed that those who have 3 or more chronic diseases reported a significantly lower intake of these antioxidants, in comparison with those who have 2 or less diseases. Lifestyle, dietary habits and, specifically, a diet high in polyphenols, play an important role in healthy aging, as well as in the prevention and reduction of the risk of cognitive impairment and Alzheimer’s disease [40, 41]. This is a critical point when considering that the percentage of older people residing in Chile has been progressively increasing, representing 18.1% of the total population, and this figure is expected to reach 32.1% by 2050 [42]. Moreover, these compounds that have antioxidant properties may also have a protective role against body weight gain and adipose tissue [43], a fact consistent with the findings of this study, which showed that individuals without abdominal obesity have a slightly higher intake compared to those who do have abdominal obesity. In addition, socioeconomic level is another variable that makes a difference in the consumption of these compounds, with a greater consumption being observed in people that belong to a high socioeconomic level, a result that is directly associated with the consumption of foods that are sources of polyphenols, since, according to data reported by the ENCA, individuals belonging to high socioeconomic level consumed 252.7 g of vegetables per day, which is a significant difference with the amount consumed by subjects from the low socioeconomic level; a similar situation is encountered regarding the daily consumption of fruits, with an average of 216 g and 148.8 g for the high and low strata, respectively, showing a significant difference. In fact, people of high socioeconomic level were those that showed greater adherence to the recommendations of the Dietary Guidelines related to the consumption of fruits, vegetables, and pulses [31], food items that are the main sources of polyphenols. Nevertheless, the most consumed fruits and vegetables were banana, apple, orange, tomato, lettuce, and carrot, with some of these items, such as apple, banana, lettuce and carrot having a lower content of polyphenols when compared to other foods that are grown or found in Chile, where we can highlight maqui (which has a high number of anthocyanins), blackberries, raspberries, cherries, mulberries, grapes and red pepper [44]. Additionally, the ENCA established the Healthy Eating Index to determine diet quality of the individuals, finding that 86.9% of the population “require changes” [31], and indeed correspond to the group that has a lower intake of polyphenols. This research found that the main classes of polyphenols consumed were phenolic acids (494.3 575.1 mg/day), specifically hydroxycinnamic acids, both in adults and older adults’ population. Due to the widespread presence of phenolic acids in food of plant origin, most of them are an essential part of the human diet [45], and according to literature, estimated consumption ranges from 25 to 1000 mg per day, depending on the foods consumed, whether they are fruits, vegetables, grains, tea, coffee and/or spices [46]. On the other hand, flavonoids were the second most consumed group, which is consistent with that reported in literature, since they usually represent two thirds of dietary polyphenols [47]. The flavonoid family, according to the Phenol-Explorer database, includes flavones, flavonols, isoflavones, flavanones, flavanols and anthocyanins, which originate from food sources such as fruits, especially citrus fruits and berries, vegetables, red wine, soy products and tea. In the present study, the most consumed type of flavonoid corresponds to flavonols, followed in a much smaller percentage by anthocyanins, both in adults and older adults; whereas considering the place of residence, individuals living in the South macrozone are those that contribute the most to total polyphenol intake, consuming phenolic acids and flavonoids in the first and second place, respectively; these results may be linked, considering specific food crops depending on the geographic region of the country, with the Center and South being the regions that assign larger soil areas to the farming of vegetable crops and pulses [48], which may increase the availability of these foods for their inhabitants. Due to the growing evidence that shows a protective effect of polyphenol intake against diverse diseases such as cancer, cardiovascular disease and neurodegenerative disease [14], pathologies which, coincidentally, are found to be the main causes of morbidity and mortality in Chile [15], is that it is necessary to conduct more studies related to the consumption of these compounds in the country; this evidence would allow to promote a greater consumption of the foods that contain them, from the perspective of prevention, thus contributing to improve the current epidemiological and nutritional profile of Chile. The results of this study should be interpreted considering some limitations. In the first place, the differences between polyphenol intake when comparing different populations are subjected to methodological differences that can lead to a possible bias associated to the use of food consumption instruments, such as memory bias. Secondly, the Chilean National Food Consumption Survey, in the case of fruits and vegetables, does not specify if the food was consumed fresh or cooked, peeled or unpeeled, with these variables affecting the amount of antioxidants, and therefore causing an underestimation or overestimation of the intake of total polyphenols, since polyphenols are mostly concentrated in the skin of fruits, and, for instance, in the case of a peeled apple, it is observed that it loses up to 50% of its antioxidant activity [49], while when cooked, antioxidant activity is reduced to about 50% in foods such as garlic and onion [44], since polyphenols are sensitive to thermal processing and water-soluble, reason why they are lost in the cooking water [50].
Conclusion
The present study provided a description of the intake of dietary polyphenols and their main classes in the adult and older adult population residing in Chile. Since there is a low availability of data in Latin America, more studies should be conducted to allow a comprehensive descriptive analysis of the intake of polyphenols, their classes, and subclasses, as a key step in the future development of dietary guidelines with specific recommendations regarding these antioxidant compounds.
Footnotes
Author contributions
Carla Guzmán performed the study, analyzed data, and supervised the study, contributed to interpretation of data, as well as drafting and editing the manuscript. Paola Araneda and Gloria Muñoz contributed to interpretation of data, as well as drafting and editing the manuscript. Paulina Arancibia and Felipe Gacitúa contributed to interpretation of data. All authors have approved of the final version of the article. The content has not been published elsewhere.
Disclosure statement
No potential conflict of interest was reported by the authors.
Funding
This project was not funded.