



Abstract
BACKGROUND:
Sugary drink and junk food consumption increases during the withdrawal period, leading to subsequent psychological and metabolic alterations.
OBJECTIVES:
We aimed to investigate the relationship of sucrose consumption with serum insulin levels, leptin levels, brain Dopamine-2 receptor (D2R) expression, food consumption, and anxiety-depression findings in morphine-withdrawal rats.
METHODS:
Thirty-six male Wistar albino rats were divided into six groups: Control, sucrose-free, 5% sucrose, 10% sucrose, 20% sucrose, and an addiction test. Saline was intraperitoneally injected to the control group, and morphine was intraperitoneally injected to the other groups for 14 days. After 14 days, naloxone was administered to the addiction test group, and addiction symptoms were observed and this group was sacrificed on the same day. Other groups were fed ad libitum with different concentrations of sucrose solution for one week. Behavioral parameters were evaluated at the end of the experiment. Leptin and insulin concentrations in serum and D2R levels in brain tissues were detected using an enzyme-linked immunosorbent assay. D2R concentrations in brain tissues were evaluated utilizing immunohistochemistry.
RESULTS:
We observed decreased food consumption and increased fluid consumption in rats that consumed sucrose water during the withdrawal period. The level of depression and binge eating behavior was elevated in groups consuming sucrose, and the 10% sucrose group had the highest carbohydrate consumption and anxiety levels. In addition, the 10% sucrose group had the lowest brain D2R expression. The leptin level was highest in the 20% sucrose group.
CONCLUSIONS:
These results show the possible effects of sugary drinks consumed during the withdrawal period.
Introduction
Stimuli that strengthen the behavior biologically or cognitively are called rewards. While the reward ensures the continuation of the behavior, it also prevents burnout. Rewards typically have appetite-stimulating and motivational functions [1, 2]. The dopaminergic mesolimbic system is critical to the reward system and motivational behavior [3]. Dopaminergic pathways arise in the ventral tegmental region and bind to the nucleus accumbens (NAc) in the ventral striatum and prefrontal cortex [4]. Dopaminergic connections form the basis of wanting behavior. Wanting behavior enables decision-making and motor action to provide a reward [5]. However, dopamine (DA) and dopamine receptors are the elements that make up the addiction mechanism. It has been reported that the Dopamine-2 receptor (D2R), one of the subtypes of dopamine receptors, has a significant relationship with antipsychotic drugs. Therefore, research on addiction is done on D2R [6]. D2R activity in the accumbens determines the severity of somatic symptoms of opiate withdrawal. In addition, the blockade of D2R appears to cause somatic withdrawal symptoms in opiate-dependent animals [7]. In addition, the duration of substance use also causes different effects on the DA level. While there is an increase in DA levels in acute substance use, there is a decrease in DA function in chronic substance exposure. After substance addiction, the postsynaptic D2R level decreases and does not return to normal for a long time, creating a strong desire to use substances [3].
The reward mechanism is activated not only with substance use but also with eating. This causes addictive effects. Researchers even think that highly processed foods should be labeled with an addictive warning, like tobacco sales standards [8]. However, substance use has much greater effects on the reward center compared to natural rewards such as eating [9]. Eating behavior occurs homeostatically and hedonically. Homeostatic regulation increases motivation to eat due to the depletion of energy stores, while hedonic regulation is reward-centered. However, this reward pathway affects not only food consumption but also substance use motivation, which affects the addiction process by using this pathway [10]. The most delicious foods are sugary, salty, and fatty foods. It is thought that delicious and processed foods can cause addiction by affecting more hedonic hunger [11].
Substance use and sugar consumption have similar psychological and physiological effects. When substance addicts stop using substances, they show psychological symptoms, especially anxiety and depression. In experimental studies, it has been reported that sugar consumption causes psychological symptoms similar to substance addiction [12]. Long-term sugar consumption has been shown to cause the brain to reprogram its neurological circuits, similar to a heroin or cocaine addiction. This is explained as the increase in DA in the brain, which increases the desire for sweet taste [13]. In one study, the addiction-inducing effects of cocaine use and sucrose consumption on the brain were compared by analyzing several brain structures. It reported that the impact of the two substances overlap exactly and cause neuronal plasticity in the brain [14].
Although sugar consumption and substance use have relatively known similar physiological effects on the brain reward center, the molecular effect mechanisms of sugar consumption on eating behavior and depression remain unclear. In this study, we aimed to investigate the relationship of sucrose consumption with serum insulin levels, leptin levels, brain D2R expression, food consumption, and anxiety-depression findings in morphine-withdrawn rats.
Materials and methods
Chemicals and materials
During the experimental protocol, morphine hydrochloride (Galen Pharmaceutical Co. - Istanbul, Turkey), naloxone hydrochloride dihydrate (Sigma Aldrich-St. Louis, MO, USA N7758), physiological saline (0.9% isotonic sodium chloride S0817), xylazine (Bioveta 2%), ketamine (Alfamine 10%) chemicals were used. Insulin injector, glass measuring cylinder (250 and 500 ml), precision scale (0.1 g sensitivity), analytical balance (0.0001 g sensitivity), thermometer (Thermo TA-288), glass homogenizer, centrifuge device (Thermo Scientific) were used. Insulin, leptin, and D2R measurements were made using commercial kits. Rat insulin Enzyme-linked immunosorbent assay (ELISA) kit (BTLab E0707Ra), rat leptin ELISA kit (BTLab E0561Ra), and rat D2R ELISA kit (BTLab E0221Ra) were used in the analysis. D2R antibodies (Santa Cruz Biotechnology sc-5303) were used in the immunohistochemical analysis.
Animal experiments
This study is an experimental study conducted between July 2021 and August 2021 at the Experimental Animals Application and Research Center of Tekirdağ Namík Kemal University. Tekirdağ Namík Kemal University Animal Experiments Ethics Committee approved the present study (Approval number: T2019-349). A total of 36 adult Wistar albino male rats (8 weeks old) were randomly assigned to six groups (2 rats per cage) with the same biological and physiological characteristics under standard laboratory conditions (humidity 45–55%, temperature 22±1 °C, and 12 hours of light / dark cycle).
Morphine was administered to all groups except the control group for two weeks (14 days) from the beginning of the experiment. Morphine was intraperitoneally (IP) injected using insulin injectors as 0.75 mg in the first 12 days and 3 mg in the 13th and 14th days. Saline (0.9% NaCl) was IP injected to the control group for two Weeks [15]. The addiction test group was administered the morphine antagonist naloxone (2 mg/kg) on the 14th day of the experiment. The addiction model was confirmed by observing the behavioral responses (jumping behavior, trembling, diarrhea, etc.) for 30 minutes, and then, the rats were sacrificed [16] (Fig. 1). A special diet plan was applied to the remaining groups in which their drinks were changed for one week. Sucrose groups were fed with 5%, 10%, and 20% sucrose solution, respectively, while the control and Sucrose-free groups were fed with water ad libitum. The binge eating behavior of the rats was evaluated by recording the amount of fluid consumed in the first hour of accessing the sucrose solutions [17]. In addition, daily fluid and food consumption were evaluated for one week. At the end of a one-week special diet plan (the morning of the 22nd day of the experiment), psychoanalytic tests were performed according to double-blind. At the end of the experiments, xylazine (10 mg/kg) and ketamine (90 mg/kg) were injected, blood was taken from the hearts of the rats, and the animals were sacrificed. After sacrificing the rats, serum and tissue samples were taken.

The schema of the experimental design.
During the experiment, the rats were fed ad libitum with standard dry pellet feed, water, or sucrose solution under laboratory conditions. The food and fluid consumption of the rats were measured every day, except for the 1-week acclimatization phase. In addition to these measurements, the amount of fluid consumed within the first hour of accessing the sucrose solution on the 15th day was recorded.
Forced swim test and elevated plus maze test
According to Porsolt, behavioral hopelessness is when the animal does not try to escape the situation and remains inactive. Behavioral hopelessness is an indicator of depression [18]. The forced swim test (FST) was applied by placing the rats swimming in a cylinder (20 cm in diameter, 50 cm in height) filled with water exceeding the animal’s length. In this test, the periods of inactivity were observed with camera recording for 5 minutes. The rats swam for 15 minutes the day before the test to acclimate. The water in the cylinder was changed before each animal was released into the water. After the test, the rats were dried with a towel and removed to their cages. A 6-minute FST was applied on the last day of the experiment, 24 hours after this pre-test. After 1 minute of contact with the water, the rats were evaluated with 5 minutes of camera recording. As a result of the evaluation, the level of depression was determined. The immobility times of the rats were calculated. Immobility is defined as the absence of escape behaviors (swimming, diving, climbing) other than the movements necessary to stay above the water and keep the head above the water [18, 19].
The elevated plus maze (EPM) test was first described in 1985 and used to evaluate anxiety-like behaviors [20]. The fact that rats are in an unfamiliar environment and an elevated area is a factor that increases anxiety. The EPM test is a plus-shaped device with open and closed walls, 50 cm high from the ground, 50 cm arm length, and 10 cm arm width [21]. The rats were taken to the test room one hour before the test with their cages. White noise was used in the test room to reduce the effects of external noise. At the beginning of the test, rats were left in the center square and observed through the camera for 5 minutes. The time spent by the rats in closed and open arms was evaluated. Behavior observation software was used to assess the EPM and FST tests [22].
Biochemical analysis
Blood samples were transferred into a biochemistry tube with gel that facilitates serum separation. The blood samples were kept at room conditions for approximately 20–40 minutes for coagulation, and then these blood samples were centrifuged at 3500 rpm at +4°C for 10 minutes. The serum samples were transferred to sterile microcentrifuge tubes and stored at –80°C until analysis. Serum leptin and insulin levels were detected with commercial sandwich ELISA kits [23, 24].
To analyze D2R levels in brain tissue with ELISA, 100 mg of brain tissue was homogenized in 1 ml of phosphate-buffered saline (PBS) and kept at –20 °C overnight. After two freeze-thaw cycles were performed to break the cell membranes, the homogenates were centrifuged at 5000 x g, at +4 °C for 5 minutes. D2R levels in the supernatant were measured with sandwich ELISA [25, 26].
Immunohistochemical analysis
D2R immunohistochemical staining of brain tissue was performed on 5μm sections obtained from paraffin blocks. D2R immunohistochemical marking was performed using the indirect immunohistochemical method. The obtained preparations were evaluated with an Olympus BX40 (Olympus, Japan) camera-attached microscope and image analysis program (Zeiss, Blue edition 2.6). Brain D2R immunoreactivity was evaluated semiquantitatively. Anti-D2R expression assessment was performed according to the method of Carter et al. (staining distribution 0.1%, < 25%; 0.4%, 26–50%; 0.6%, 51–75%; 0.9%, 76–100%, and staining intensity 0 = no staining; 0,5 = very little staining; 1 = little staining; 2 = moderate staining; 3 = very strong staining). Immunohistochemical staining was calculated as distribution×staining intensity [27]. All of the D2R immunostained sections were analyzed by the two histologists who were blinded to the experimental groups. Slides were examined under low power magnification (4x objective) to identify NAc identify. At least ten slides were scored for each animal for groups; in total, 60 slides were analyzed per group at 400x magnification [28].
Statistical analyses
G*Power-3.1 program was used in the experimental design. According to the principle of Cohen, the sample size was determined as 36 with an effect size of 0.70, an α error of 0.05, and a power of (1–β) 80%. The groups were formed to include six rats in each group [29]. PASW Statistics 18 statistical package program was used to analyze the resulting data. Variables were expressed with tables and graphs. Kolmogorov-Smirnov normality test was used for normality test. Since all variables showed normal distribution, comparisons were made with parametric tests, and the results were given as mean±sd. By performing the normality test, analysis of variance (ANOVA) was used to compare independent groups and analysis of variance was used for repeated measurements in comparison of dependent groups. Post-hoc multiple comparison tests were used for subgroup comparisons. “Spearman” correlation test was used to examine the relationship between data that did not have a normal distribution. A p-value of < 0.05 was considered statistically significant.
Results
Food and water consumption
During the morphine administration, the control group’s food consumption amount was significantly lower than the other groups (p < 0.05). It was determined that there was a significant difference in the average amount of food consumed per rat between the groups during the withdrawal period (p < 0.05) (Table 1).
Weekly food consumption of rats (g/day)
Weekly food consumption of rats (g/day)
p1independent group comparison (ANOVA), a-e difference between groups with different letters. p2difference between weeks (Analysis of variance in repeated measures), there is a difference between weeks with 1–3 different numbers. *p < 0.05.
When each group was compared within itself in weekly food consumption amounts, a difference was found in all groups except the control group. (p < 0.05). It was determined that the amount of food consumed during the withdrawal period was significantly higher in the sucrose-free group compared to the morphine administration period and significantly lower in the 5%, 10%, and 20% groups (p < 0.05) (Table 1).
There was a difference in the average fluid intake between the groups in the 1st, 2nd, and 3rd weeks (p < 0.05). The amount of fluid consumed during the withdrawal period was significantly lower in the control group than in the other groups. The amount of fluid consumed during the withdrawal period was significantly lower in the control group than in the other groups. (Table 2). When each group was examined, there was a difference in the amount of fluid consumption between weeks, except for the control group (p < 0.05). While the amount of fluid consumed during the withdrawal and the morphine administration period were similar in the control group, it was found that it increased significantly in the sucrose-free, 5%, 10%, and 20% sucrose groups during the withdrawal period (p < 0.05) (Table 2).
Weekly fluid consumption amounts of rats (ml/day)
p1 independent group comparison (ANOVA), a-c difference between groups with different letters. p2 difference between weeks (Analysis of variance in repeated measures), there is a difference between weeks with 1–3 different numbers. *p < 0.05.
The amount of fluid consumed in the first hour of accessing the sucrose solution was lower in the control group than in the other groups. It was found that the consumption of the sucrose-free group was higher than in the control group and lower than in the 10% and 20% sucrose groups [F (49,375), p < 0.001]. There was no significant difference between the 10% and 20% sucrose groups, and they consumed a higher amount than the control group, sucrose-free and 5% sucrose group (Fig. 2).

The amount of fluid consumed by rats in 1 hour when they first accessed sucrose solution. Data are expressed as the means±SD. There is a significant (p < 0.001) difference between groups with different a-c letters.
EPM and FST were applied to evaluate the effects of sucrose consumption on rats’ anxiety and depression levels during the withdrawal period.
EPM and FST parameters are shown in Fig. 3. There was no significant difference between the EPM and FST parameters of the groups (p < 0.05) (Fig. 3). It was determined that the 10% sucrose group had a higher value in the time spent in the closed arm than the other groups, and there was no significant difference between them. There was no significant difference in the parameters of the time spent in the open arm of the rats.
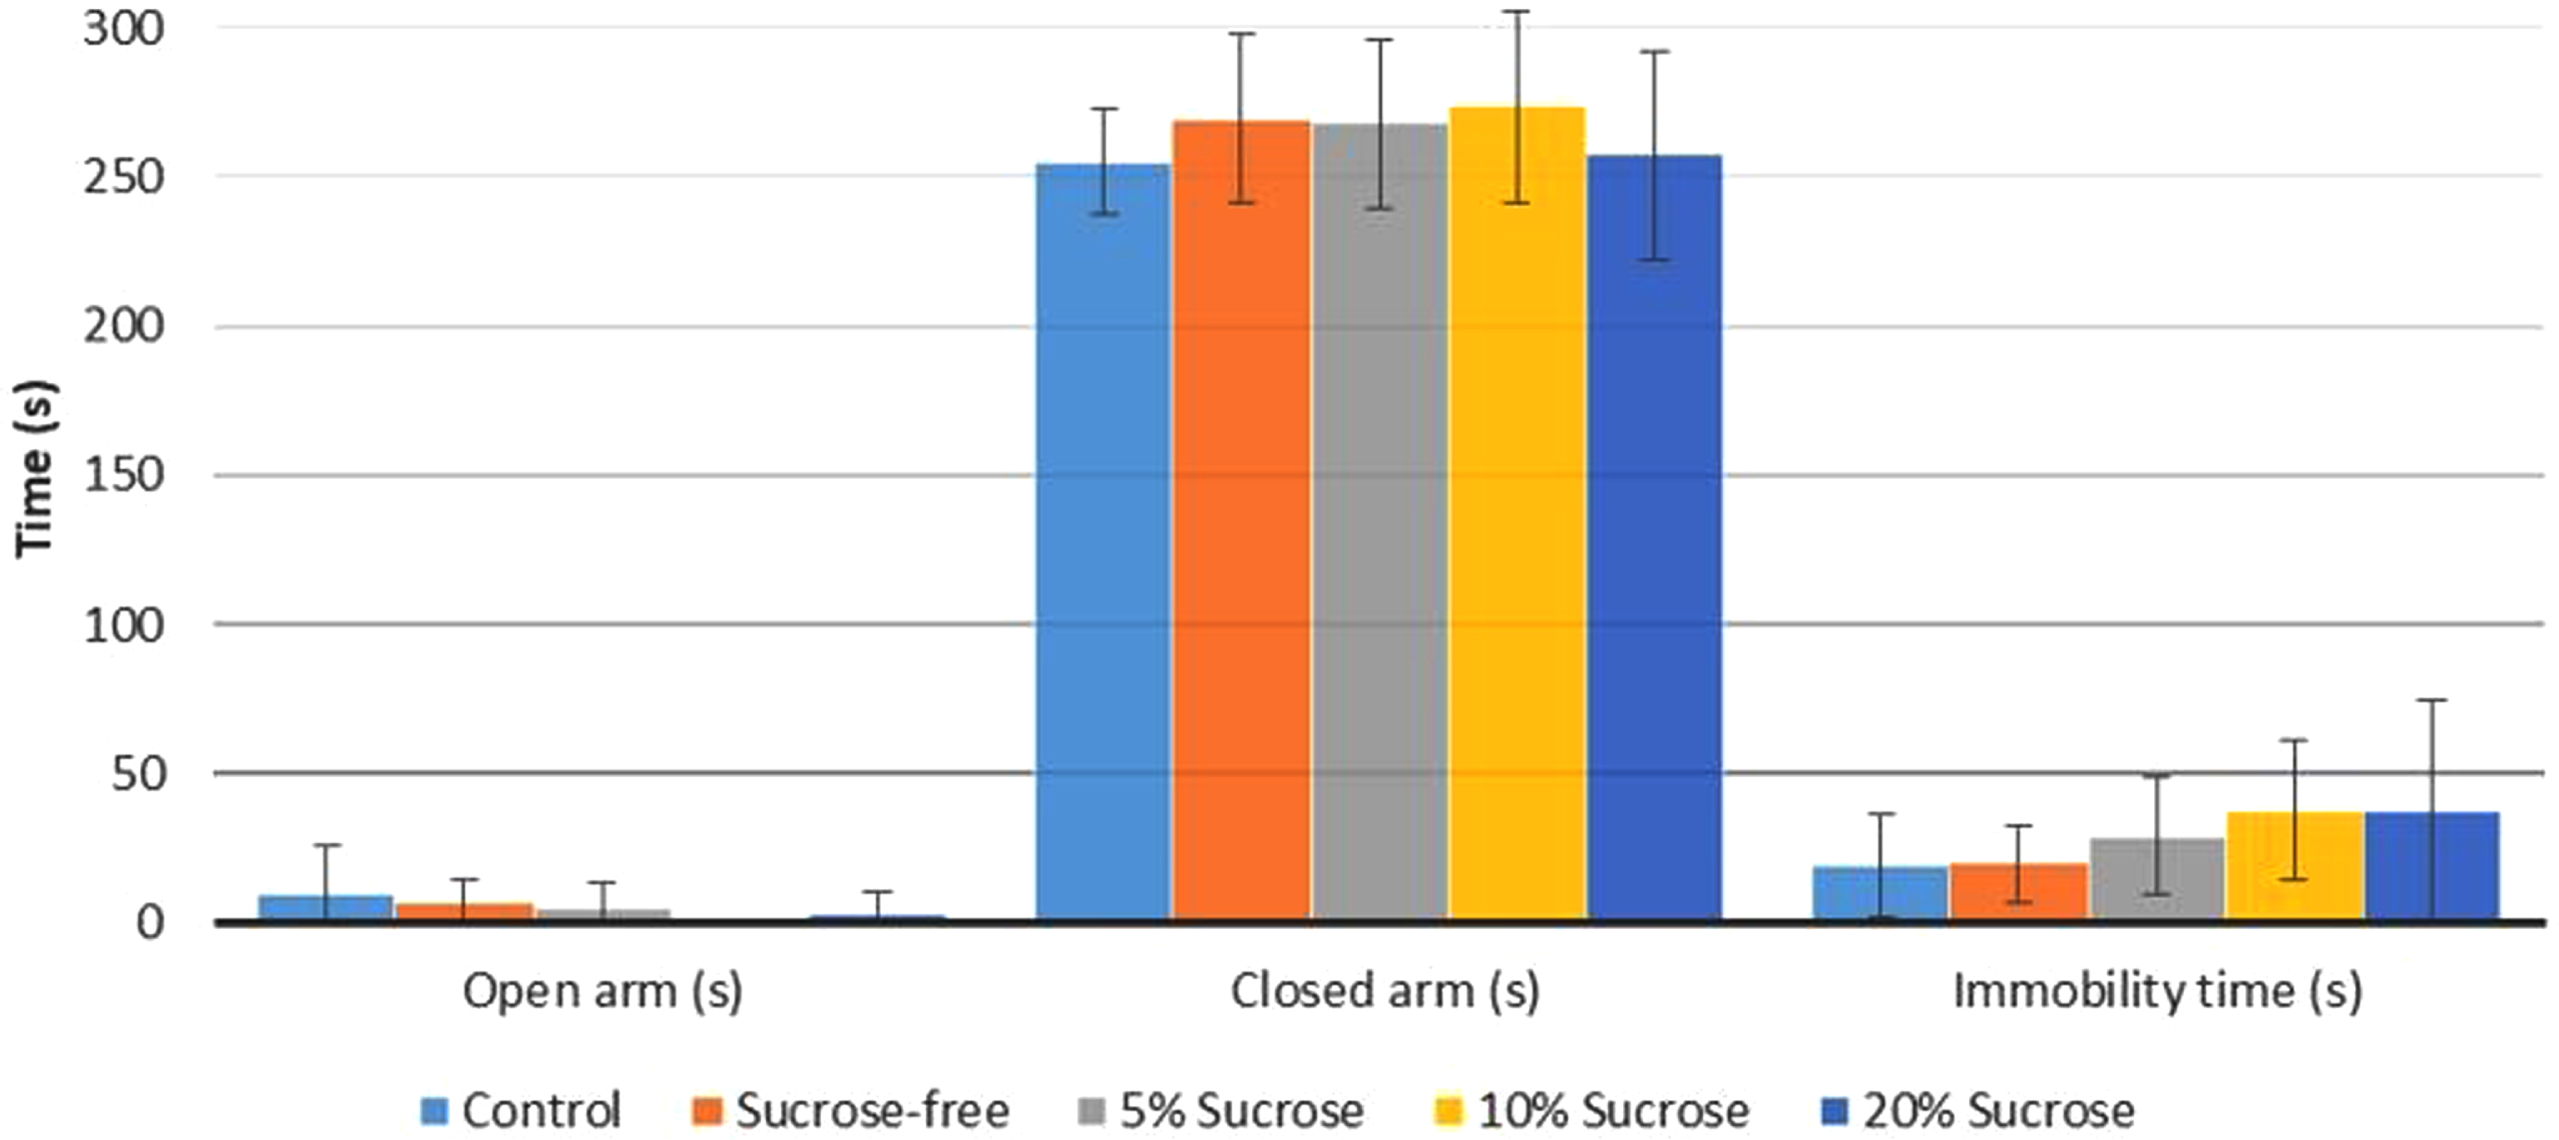
Assessment of behavioral parameters in the EPM and FST. No difference in open and closed arm time in the EPM and no difference in immobility time. Data are expressed as the means±SD.
The immobility time determined in the FST was higher in the groups given sucrose water. In the 10% sucrose and 20% sucrose groups, the immobility time was higher than in the other groups, but no significant difference was found. The control and sucrose-free groups’ immobility time was also similar (Fig. 3).
The leptin, insulin, and D2R levels of the rats are shown in Fig. 4. A significant difference was found between the leptin levels of the groups (Fig. 4-a). The leptin levels in the 20% sucrose group were significantly higher than in the 10% sucrose and control group. The lowest insulin levels among the groups were in the control group, and no significant difference was found between the other groups (Fig. 4-b). Although the D2R levels of the groups were the lowest in the 10% sucrose group and the highest in the control group, no significant difference was found between the groups (Fig. 4-c).
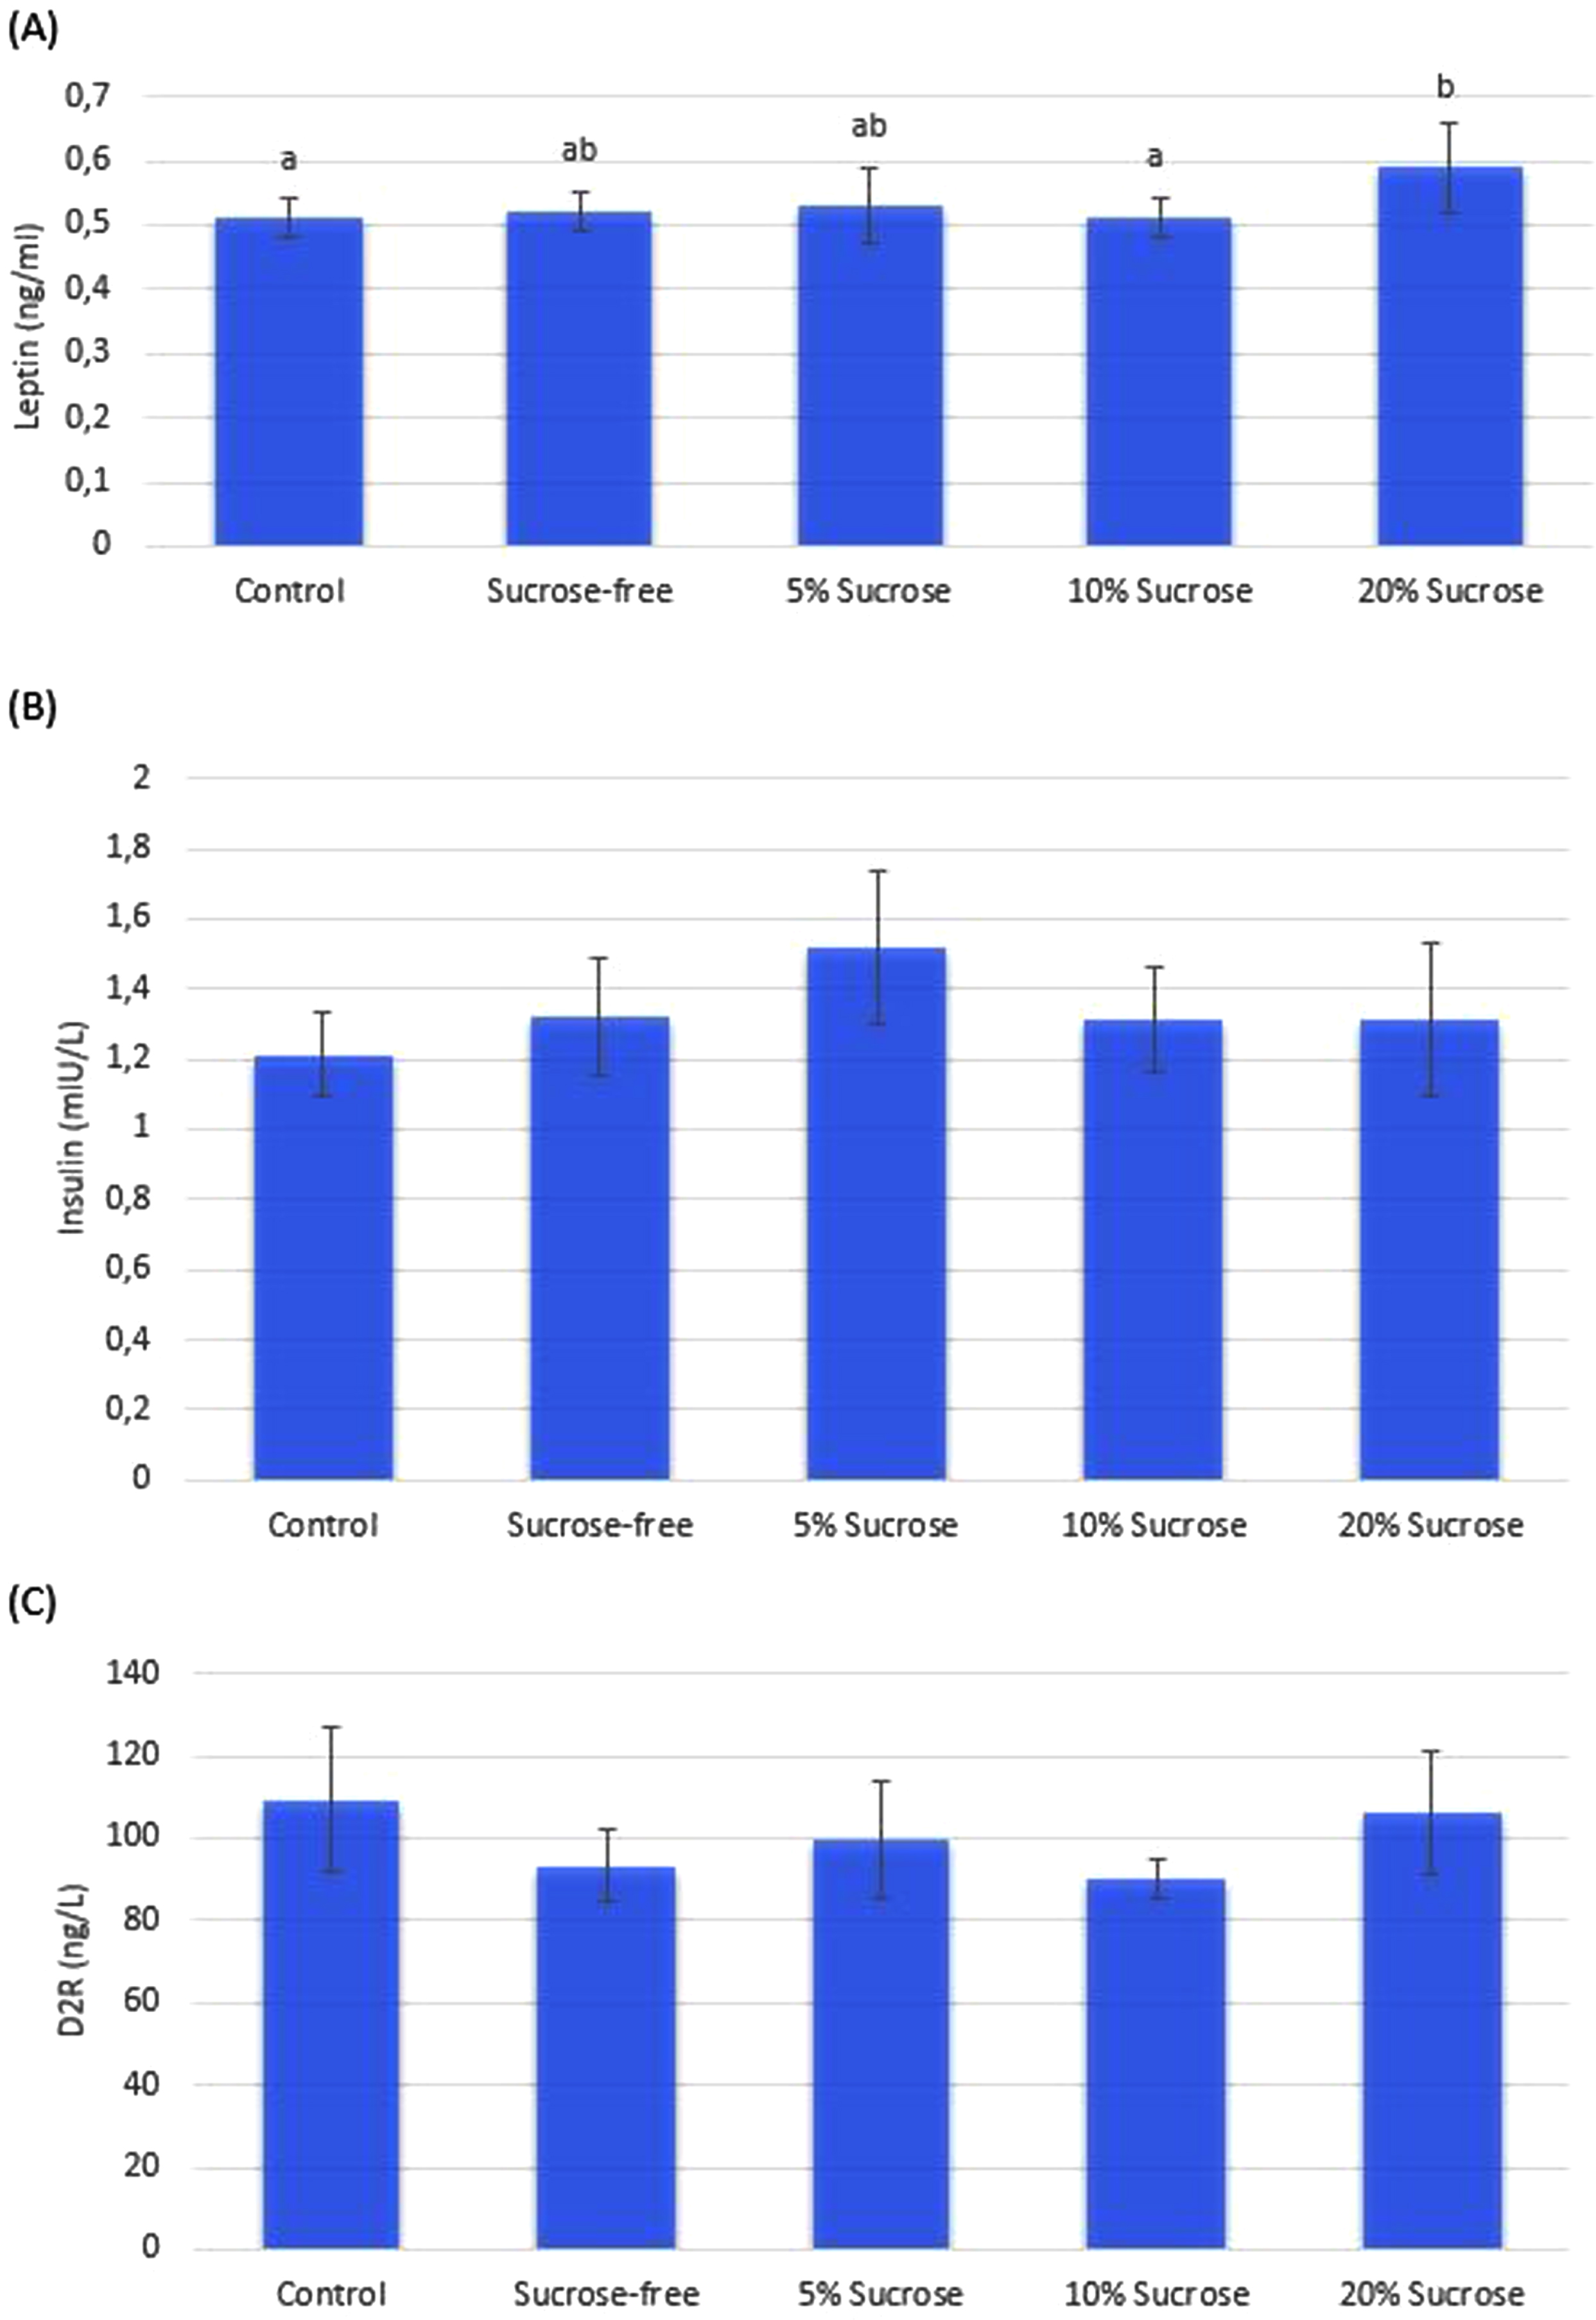
Insulin, leptin, D2R values. The leptin value of the 20% sucrose group was significantly higher than the control and 10% groups (Fig. 4-a). There was no significant difference between groups in insulin and D2R parameters (Fig. 4-b and 4-c). There is a significant (p < 0.05) difference between groups with different a-b letters.
D2R immunoreactivity in the brain NAc region was determined with the indirect immunohistochemical method. Immunoreactivity was observed in red-pink color in D2R-positive staining neuron cell membranes. NAc D2R immunohistochemical staining findings of the groups are shown in Fig. 5.
Semiquantitative evaluations of the NAc D2R immunoreactivity were presented in Fig. 5. There was a significant difference between the groups (p < 0.05). The lowest D2R immunoreactivity was in the 10% sucrose group, while the highest D2R immunoreactivity was in the control group (p < 0.05). Moreover, the D2R immunoreactivity of the morphine-administered groups was lower than in the control group (Fig. 5). There was a significant difference between the groups [F (4,072), p < 0.05]. The D2R immunoreactivity of the dependent groups was lower than the control group. The group with the lowest D2R immunoreactivity was found in the 10% sucrose group and the highest in the control group (Fig. 5).
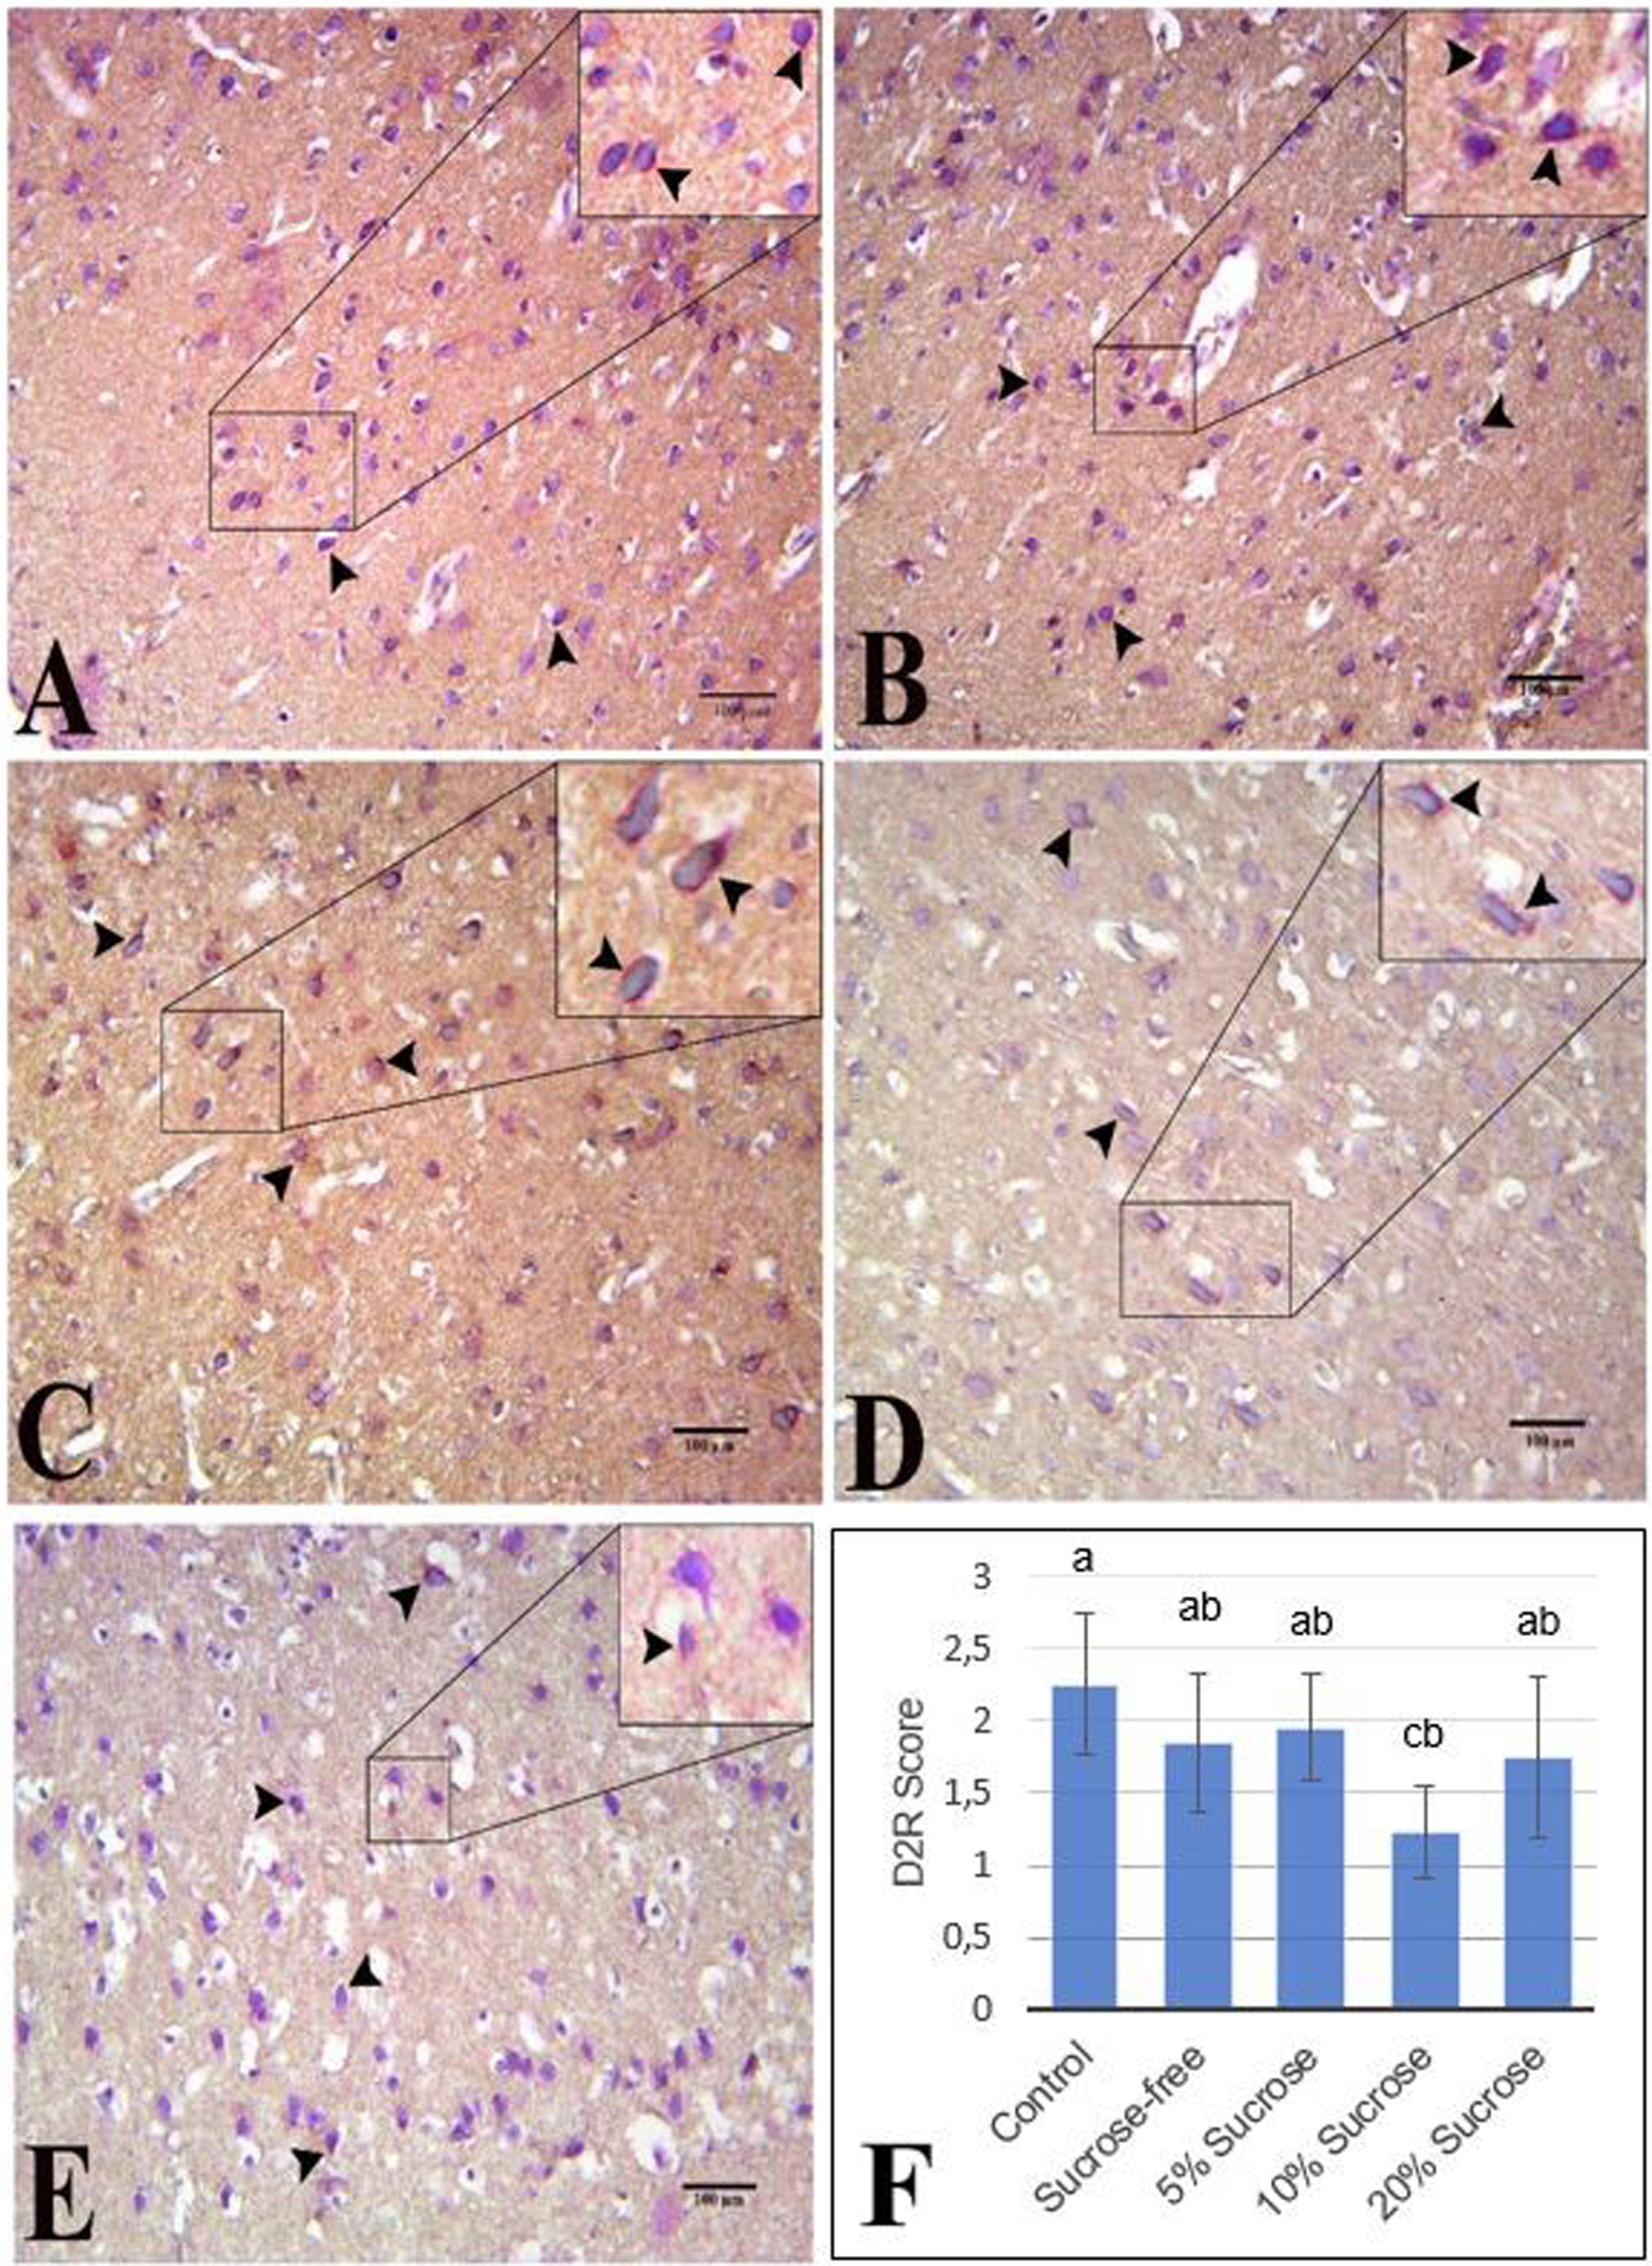
Immunohistochemical staining of NAc D2R - A: Control group, B: No sucrose group, C: 5% sucrose group, D: 10% sucrose group, E: 20% sucrose group (arrowhead; D2R immunoreactivity, magnification: 200X, bar; 100μm). F: Semiquantitative assessment of D2R immunoreactivity in the nucleus accumbens. 10% sucrose group was significantly lower than the control group. There is a significant (p < 0.05) difference between groups with different a-c letters.
Our results indicated that the 10% sucrose group was the group with the highest carbohydrate consumption, the highest fluid consumption in the first hour of access, the lowest NAc D2R level, and the highest level of anxiety and depression. Also, it was found that those who consumed sucrose during the withdrawal period had higher levels of anxiety and depression than those who did not, but this was not at a significant level.
It is observed that individuals addicted to alcohol and substance generally consume only one meal, and their nutritional and appetite status is impaired [30]. Furthermore, it is reported that substance addicts eat rich in high-energy items such as fat and sugar, and their consumption of fruits and vegetables is low [31].
In a study performed by Langerman et al., a decrease was observed in the amount of food and liquid consumption of rats at the beginning of the withdrawal period compared to the control group. However, the food and liquid consumption of the rats increased over time and exceeded the level that they consumed during the morphine-administered period [32]. In another study in which rats were applied eight days of morphine followed by an 8-day withdrawal period, it was reported that the food consumption and energy intake of the morphine group were lower than the control group during the morphine administration period. Moreover, it was observed in the same study that from the second day of the withdrawal period, the food consumption and energy intake increased above the level of the morphine administration period [33]. In our study, we found that the amount of food consumed during the withdrawal period was significantly higher in the sucrose-free group compared to the amount of food consumed in the morphine administration period (2nd week), and it was significantly lower in the 5%, 10%, and 20% sucrose groups (Table 1). These results are because the consumption of sucrose-containing beverages of the groups with sucrose prevented the rats from consuming food.
In a study conducted with substance addicts, it is reported that 30% of the daily dietary energy of individuals comes from added sugar, and they tend to consume sugar [34]. Researchers gave mice water containing sucrose at all concentrations (0.15%, 1.5%, 15%, 30%) and monitored their water consumption for 2 hours. Fluid intake was significantly reduced for lower sucrose concentrations (1.5%, 0.15%) but not for higher concentrations (15%, 30%) [35]. In an experimental study evaluating the substance-seeking behavior of rats, it was observed that the consumption of sucrose-containing water increased during the withdrawal period [36]. Our data showed that the amount of energy intake during the withdrawal period was significantly lower in the control group than in the sucrose-free group, 5% and 10% sucrose groups, while it was similar to the 20% sucrose group (Table 2). The low energy intake of the control group is due to their low food consumption and not consuming additional sucrose beverages compared to the other groups. However, the low energy level in the 20% group is due to decreased food consumption and insufficient energy from fluid consumption.
Binge eating is a complex psychopathological behavior associated with the brain’s reward center [37]. It is also closely related to overactive opiate receptors. It is thought that this may be due to the excessive sense of pleasure caused by the Food [38]. In the present study, binge eating behavior was evaluated for the 1 hour when they first accessed sucrose solution during the withdrawal period. Accordingly, our results revealed that the groups that consume sucrose beverages in the first 1-hour period when they reach sucrose consume more liquid than the group that consumes only water (Fig. 1). However, the 10% sucrose group had the highest fluid consumption both in the first 1-hour access and during the withdrawal period. (Fig. 2 and Table 2). Our results are consistent with the literature [39, 40]. 10% sucrose solution was stated to be palatable for rats and, therefore, had the highest consumption value.
Studies have shown that there is an increased risk of developing an anxiety disorder in individuals with opiate addiction. [41, 42]. The immobility time of animals in the FST indicates behavioral despair. Behavioral despair is an indicator of depression [20]. Many studies show that adult rats’ immobility increased in the FST during opiate withdrawal. However, it is seen that methodological differences can change the results [43–46]. In the FST performed after the 4-week withdrawal period, it was observed that the morphine-administered groups remained immobile significantly more than the saline-administered group [43]. The study examining the effects of opiates on behaviors showed that the dysphoric impact of opiates (increase in FST immobility time) started on the 3rd day of withdrawal and continued until the 6th day of withdrawal [45]. A study comparing the withdrawal period of adolescent and adult mice found that the adolescent rats had less immobility time on the 3rd day of the withdrawal period than the healthy control group. However, a significant increase in immobility time was found on day 9. In adult mice, there was no difference in the immobility time on day three compared to the control group, but an increase in immobility time was observed on the 9th day. In this study, it was emphasized that the psychological effects of withdrawal might vary according to age [46]. In another study, it was reported that there was no significant difference in FST immobility time between the saline-administered group and the morphine-administered group [47]. In our study, we unveiled that the morphine-administered rats had a longer immobility time compared to the control group, but the consumption of sucrose did not have a significant effect on the immobility time (Fig. 3).
The elevated plus-maze test is a test used to assess anxiety. It is thought that the experimental animal staying away from the open arm and spending time in the closed arms is caused by anxiety [48]. Morphine-administered rats seem to spend more time in the open arm than the control group. It is stated that this result indicates a lower level of anxiety and fear [49]. In one study, an increase in the time spent in the open arm of rats administered morphine was found, but spontaneous morphine withdrawal did not have a significant effect on the EPM measurements during the withdrawal period. It is reported that spontaneous withdrawal animals will not show dramatic behavioral results similar to morphine antagonist-induced withdrawal. However, it is stated that inconsistent findings in the EPM and social interaction tests cannot be attributed to the lack of adequate opiate addiction, which may be due to many factors [44]. Similarly, in this study, the time spent in the closed arm was lower in the morphine-administered groups (Fig. 3).
Some studies have shown that sugar consumption negatively affects anxiety and depression, but the effects of long or short-term consumption make a difference [50–52]. In a study, at the end of the morphine administration, rats were given drinks containing sucrose at different rates. Afterward, morphine withdrawal was created by administering a morphine antagonist. Behavioral symptoms during the withdrawal period seem to decrease more in groups receiving higher doses (25–30%) of sucrose solution. However, in this study, the withdrawal period that did not develop naturally was created with the administration of an antagonist, and the short-term effect of sucrose consumption was observed [52]. We observed that the groups consuming sucrose beverages had a longer period of immobility than the sucrose-free group (Fig. 3). In the EPM test, the 10% sucrose group had a higher time spent in the closed arm than the other groups, but no significant difference was found (Fig. 3). This may be because the 10% sucrose group consumes the most sucrose beverages, and their D2R levels are the most affected.
Binge eating behavior is associated with the reward center. Binge-eating sugar shows symptoms similar to opiate withdrawal [53]. There is a positive relationship between depression and binge eating behavior [54]. It has been reported that binge eating stimulates DA release in the NAc shell, and long-term sugar consumption is associated with depression symptoms [40]. In our study, in parallel with the literature, binge eating behavior and depression levels were higher in rats with access to sucrose water in the first hour compared to rats without access (Figs. 2 and 3).
Circulating leptin and insulin levels are affected by the use of opiates. In a study by Houshyar et al., morphine was administered to the rats for eight days. Afterward, the withdrawal period findings were examined for eight days. Plasma leptin and insulin levels were reduced in morphine-treated rats 12 hours after the last morphine injection, but no significant difference was measured after eight days [34]. However, a study conducted on mice found that serum leptin levels did not affect heroin-seeking behavior [55]. In another study, it was found that there was no difference in leptin and insulin levels at the end of 8 days of withdrawal compared to the control group [56]. In our study, blood samples were taken on the 8th day of the withdrawal period. No significant difference was found between the morphine-administered sucrose-free group and the saline-administered control group on leptin and insulin levels (Fig. 4-a, 4-b). These results could be due to the disappearance of morphine’s effect on leptin and insulin over time, as reported in the literature. Leptin and insulin levels can be affected by sucrose consumption. In a study, no difference was observed between the groups in the plasma insulin levels measured after one week in rats that consumed sucrose beverages. However, after five weeks, plasma insulin levels increased in rats that received a 30% sucrose beverage. However, the plasma leptin level did not change at the end of the first week when the rats consumed 30% sucrose water [57]. Similarly, this study found no significant difference in insulin levels due to 1-week sucrose consumption. However, the leptin level was significantly higher in the 20% sucrose group than in the control group (Fig. 4-a). The reason may be the consumption of a greater amount of 20% sucrose solution with the effect of the withdrawal period and the development of leptin resistance in rats.
Chronic use of addictive substances or long-term consumption of palatable foods decreases extracellular DA and D2R levels. As a result, there is more substance use or consumption of delicious foods [58]. In a study related to this, there is a positive relationship between the prolongation of the D2R down-regulation state, which occurs as a result of chronic substance use after detoxification (treatment), and the high risk of relapse [59]. Another study reported that reduced DA-D2R binding increases susceptibility to cocaine abuse, which is also an effect of cocaine exposure, contributing to the continuation of drug use [60]. Similarly, in this study, brain D2R levels were lower in the morphine-administered sucrose-free group compared to the saline-administered control group. In addition, brain and NAc D2R levels were found in the lowest 10% sucrose group (Figs. 4-c, 5).
Addictive substances increase DA release in the NAc, which acts as a positive reinforcer for substance use [4]. D2R elevation in NAc seems to prevent somatic symptoms of opiate withdrawal. On the other hand, it has been reported that blocking D2R causes somatic withdrawal symptoms [7]. Substance addicts continue to use substances to avoid adverse symptoms resulting from withdrawal [61]. In a study examining depression, one of the withdrawal symptoms, it was observed that the immobility time in the FST was decreased by dopaminergic agonists and increased by DA antagonist treatment [62]. In another study, reductions in DA release following discontinuation of opiate administration were treated with the DA agonist selegiline. It has been reported that dopamine agonists can prevent changes in stress-induced immobility and resulting presynaptic dopaminergic function deficiencies in opiate-deprived rats [44]. Following repeated consumption of ultra-processed food, animals show mesolimbic dopamine receptor reduction and behavioral changes consistent with tolerance. Sugar, an ultra-processed food, has a similar effect [63]. In our study, immobility time (depression indicator) was found to be higher in the groups that consumed sucrose solutions with dopaminergic agonist effect compared to the groups that did not consume sucrose (Fig. 3). This may be because sucrose consumption’s instant and long-term effects differ [58, 64].
There is an inverse relationship between palatable food consumption and D2R. It is observed that D2R levels decrease, and compulsive food-seeking behavior develops in rats consuming a cafeteria diet (consisting of foods such as sausage and chocolate) [65]. In the study of Colantuoni et al., it is seen that the D2R level of rats consuming 25% glucose solution decreased in the NAc core and Shell [17]. In our study, both the lowest brain D2R expression and the highest binge eating behavior were found in the 10% sucrose group (Figs. 2, 4-c, 5). In addition, this study shows that 10% sucrose water reduces D2R levels in both brain tissue and NAc (Figs. 4-c and 5). This result may indicate that long-term consumption of a sugary beverage is insufficient to lower DA and D2R levels; it also needs to be delicious.
An important limitation of the study is that changes in leptin, insulin, and D2R levels could not be determined throughout the experimental period and were only measured at the sacrification stage.
Conclusions
As a result, it was observed that the food consumption of rats that consumed sucrose solution during the withdrawal period decreased, and their fluid consumption increased. In addition, it is observed that brain D2R expression decreases the most in the 10% sucrose group, depending on sucrose consumption during the withdrawal period. However, the 10% sucrose group was found to have the highest anxiety level. These results indicate that the potential effects of sugary drinks consumed during substance withdrawal should be considered as part of the rehabilitation process.
Footnotes
Acknowledgment
The results presented in this paper were part of the Ph.D. thesis of Serkan Aslan. The authors would like to thank the practice staff for their assistance with this study.
Funding
This work was supported by Research Fund of the Tekirdağ Namík Kemal University. Project Number: (23.GA.21.304)
Conflict of interest disclosure
There are no known conflicts of interest in the publication of this article. The manuscript was read and approved by all authors.
Author contribution
Serkan Aslan: Methodology, Writing-review & editing, and conducted the experiments. Eda Köksal: Methodology and Writing-review & editing. İhsan Karaboğa: Conducted the experiments and histological examinations.
Ethical statements
The protocol of this study was approved by the Ethical Committee of Tekirdağ Namík Kemal University.
Consent to publication
All the authors agreed to publish this article.
Data availability statement
Data available on request from the authors.