




Abstract
BACKGROUND:
Picky eating is defined as “consuming a limited variety of foods, being strict about the preparation and presentation of preferred foods, and being reluctant to try new foods”.
OBJECTIVE:
The aim of this study was to investigate the relationship between the picky eating behaviours of adults and the “MEDFICTS (Meats, Eggs, Dairy, Frying, Fats in Bakery Products, Prepared Foods, Fats Added at the Table, Snacks) Dietary Assessment Questionnaire” score and “Visceral Adiposity Index (VAI)”.
METHODS:
In this cross sectional study, data of 580 adults aged between 19–64 years were evaluated. Descriptive Information Form, “Adult Picky Eating Questionnaire (APEQ)”, “MEDFICTS Diet Assessment Questionnaire”, “International Physical Activity Questionnaire - Short Form (IPAQ-SF)” were used to collect data. The VAI score was calculated with the formula using the “Body Mass Index (BMI)”, “Waist Circumference (WC)”, “High Density Lipoprotein (HDL)” and “Triglyceride (TG)” levels.
RESULTS:
There is a negative relationship between APEQ total score (β:–0.228, p < 0.05), APEQ “Food Presentation” (β:–0.172, p < 0.05) and “Taste Avoidance” (β:–0.117, p < 0.05) subscales and MEDFICTS score. There is a negative relationship between APEQ total score (β:–0.089, p < 0.05), APEQ “Food Presentation” (β:–0.112, p < 0.05) subscales and VAI.
CONCLUSIONS:
In adults, picky eating behavior is associated with decreased MEDFICTS Diet Assessment Questionnaire score and reductions in VAI.
Keywords
Introduction
Picky eating is defined as “consuming a limited variety of foods, being strict about the preparation and presentation of preferred foods, and being reluctant to try new foods” [1]. Picky eating affects 15–35% of children and adults [2]. Picky eating is also a restricting eating pattern that can result in symptoms of “Avoidant/Restrictive Food Intake Disorder (ARFID)”, a new diagnosis in the “Diagnostic and Statistical Manual of Mental Disorders, Fifth Edition (DSM-5)” [3].
In general, dietary saturated fat intake increases the risk of obesity and Cardiovascular Disease (CVD) [4, 5]. Literature states that individuals with restrictive eating behaviors consume less dietary energy and fat [6]. Picky eating behaviours may lead to changes in dietary intake and differences in psychosocial outcomes. [7]. In a study by Pesch et al [8], it was reported that picky eaters in childhood had poor diet quality in young adulthood. This includes reduced intake of fruit, whole grains and vegetables and and more frequent consumption of snack foods, sugar-sweetened drinks and food from fast-food restaurants [8]. However, information about the dietary fat and cholesterol intake levels of individuals with picky eating behaviors is insufficient.
MEDFICTS, one of the dietary assessment tools for assessing fat and cholesterol intake, was developed as part of the “National Cholesterol Education Program Adult Treatment Panel Guideline” and measures adherence to recommended “Step 1 and Step 2 diets for the prevention and treatment of CVD” [9]. The “Step 1” and “Step 2 diets” recommend dietary changes to lower cholesterol levels and improve heart health [10]. Assessing the amount of dietary fat consumed by individuals with picky eating behaviors and their MEDFICTS Diet Assessment Questionnaire score plays a key role in planning dietary interventions to prevent CVD in these individuals.
“The Visceral Adiposity Index (VAI)” is derived from biochemical, metabolic, and anthropometric measurements, including “Waist Circumference (WC)”, “Body Mass Index (BMI)”, “Triglycerides (TG)”, and “High-Density Lipoprotein (HDL)”, and is indicative of fat distribution and function [11, 12]. VAI has been shown to be an independent predictor of cardiovascular and cerebrovascular events in many studies [11, 14]. The relationship between picky eating and obesity in adults is complex and involves the interaction of many factors [2]. Although it is not yet clear how picky eating behaviors contribute to low body weight and protect against obesity, several studies have demonstrated that they are associated with low BMI [2, 15–17]. However, the relationship between picky eating behaviors and VAI is still unclear. Revealing the relationship between picky eating behaviors and VAI in adults will lead to studies to elucidate the issue.
The aim of this study was to investigate the relationship between the picky eating behaviours of adults and the “MEDFICTS Dietary Assessment Questionnaire” score and VAI.
Material and methods
Study design and sample
This study was conducted in five randomly selected Family Health Centres (FHCs) located in the east, west, middle, north and south regions of Bandırma, a district of Balıkesir province located on the Marmara Sea coast in northwest Turkey. We calculated the sample size to be included in the study as 528 people in the G*Power 3.1.9.7 program (power = 90%, significance level α = 0.05, effect size d = 0.02 [18, 19]. Total number of people who applied to five FHCs between February 2023 and June 2023 was 3061. A total of 321 people refused to participated in the study. Of the remaining individuals, 2160 were excluded based on exclusion criteria such as not being in the 19–64 age group, being pregnant or lactating, and not having TG and HDL measurements. Consequently, the data obtained from the 580 individuals who volunteered to participate were analyzed (Fig. 1).
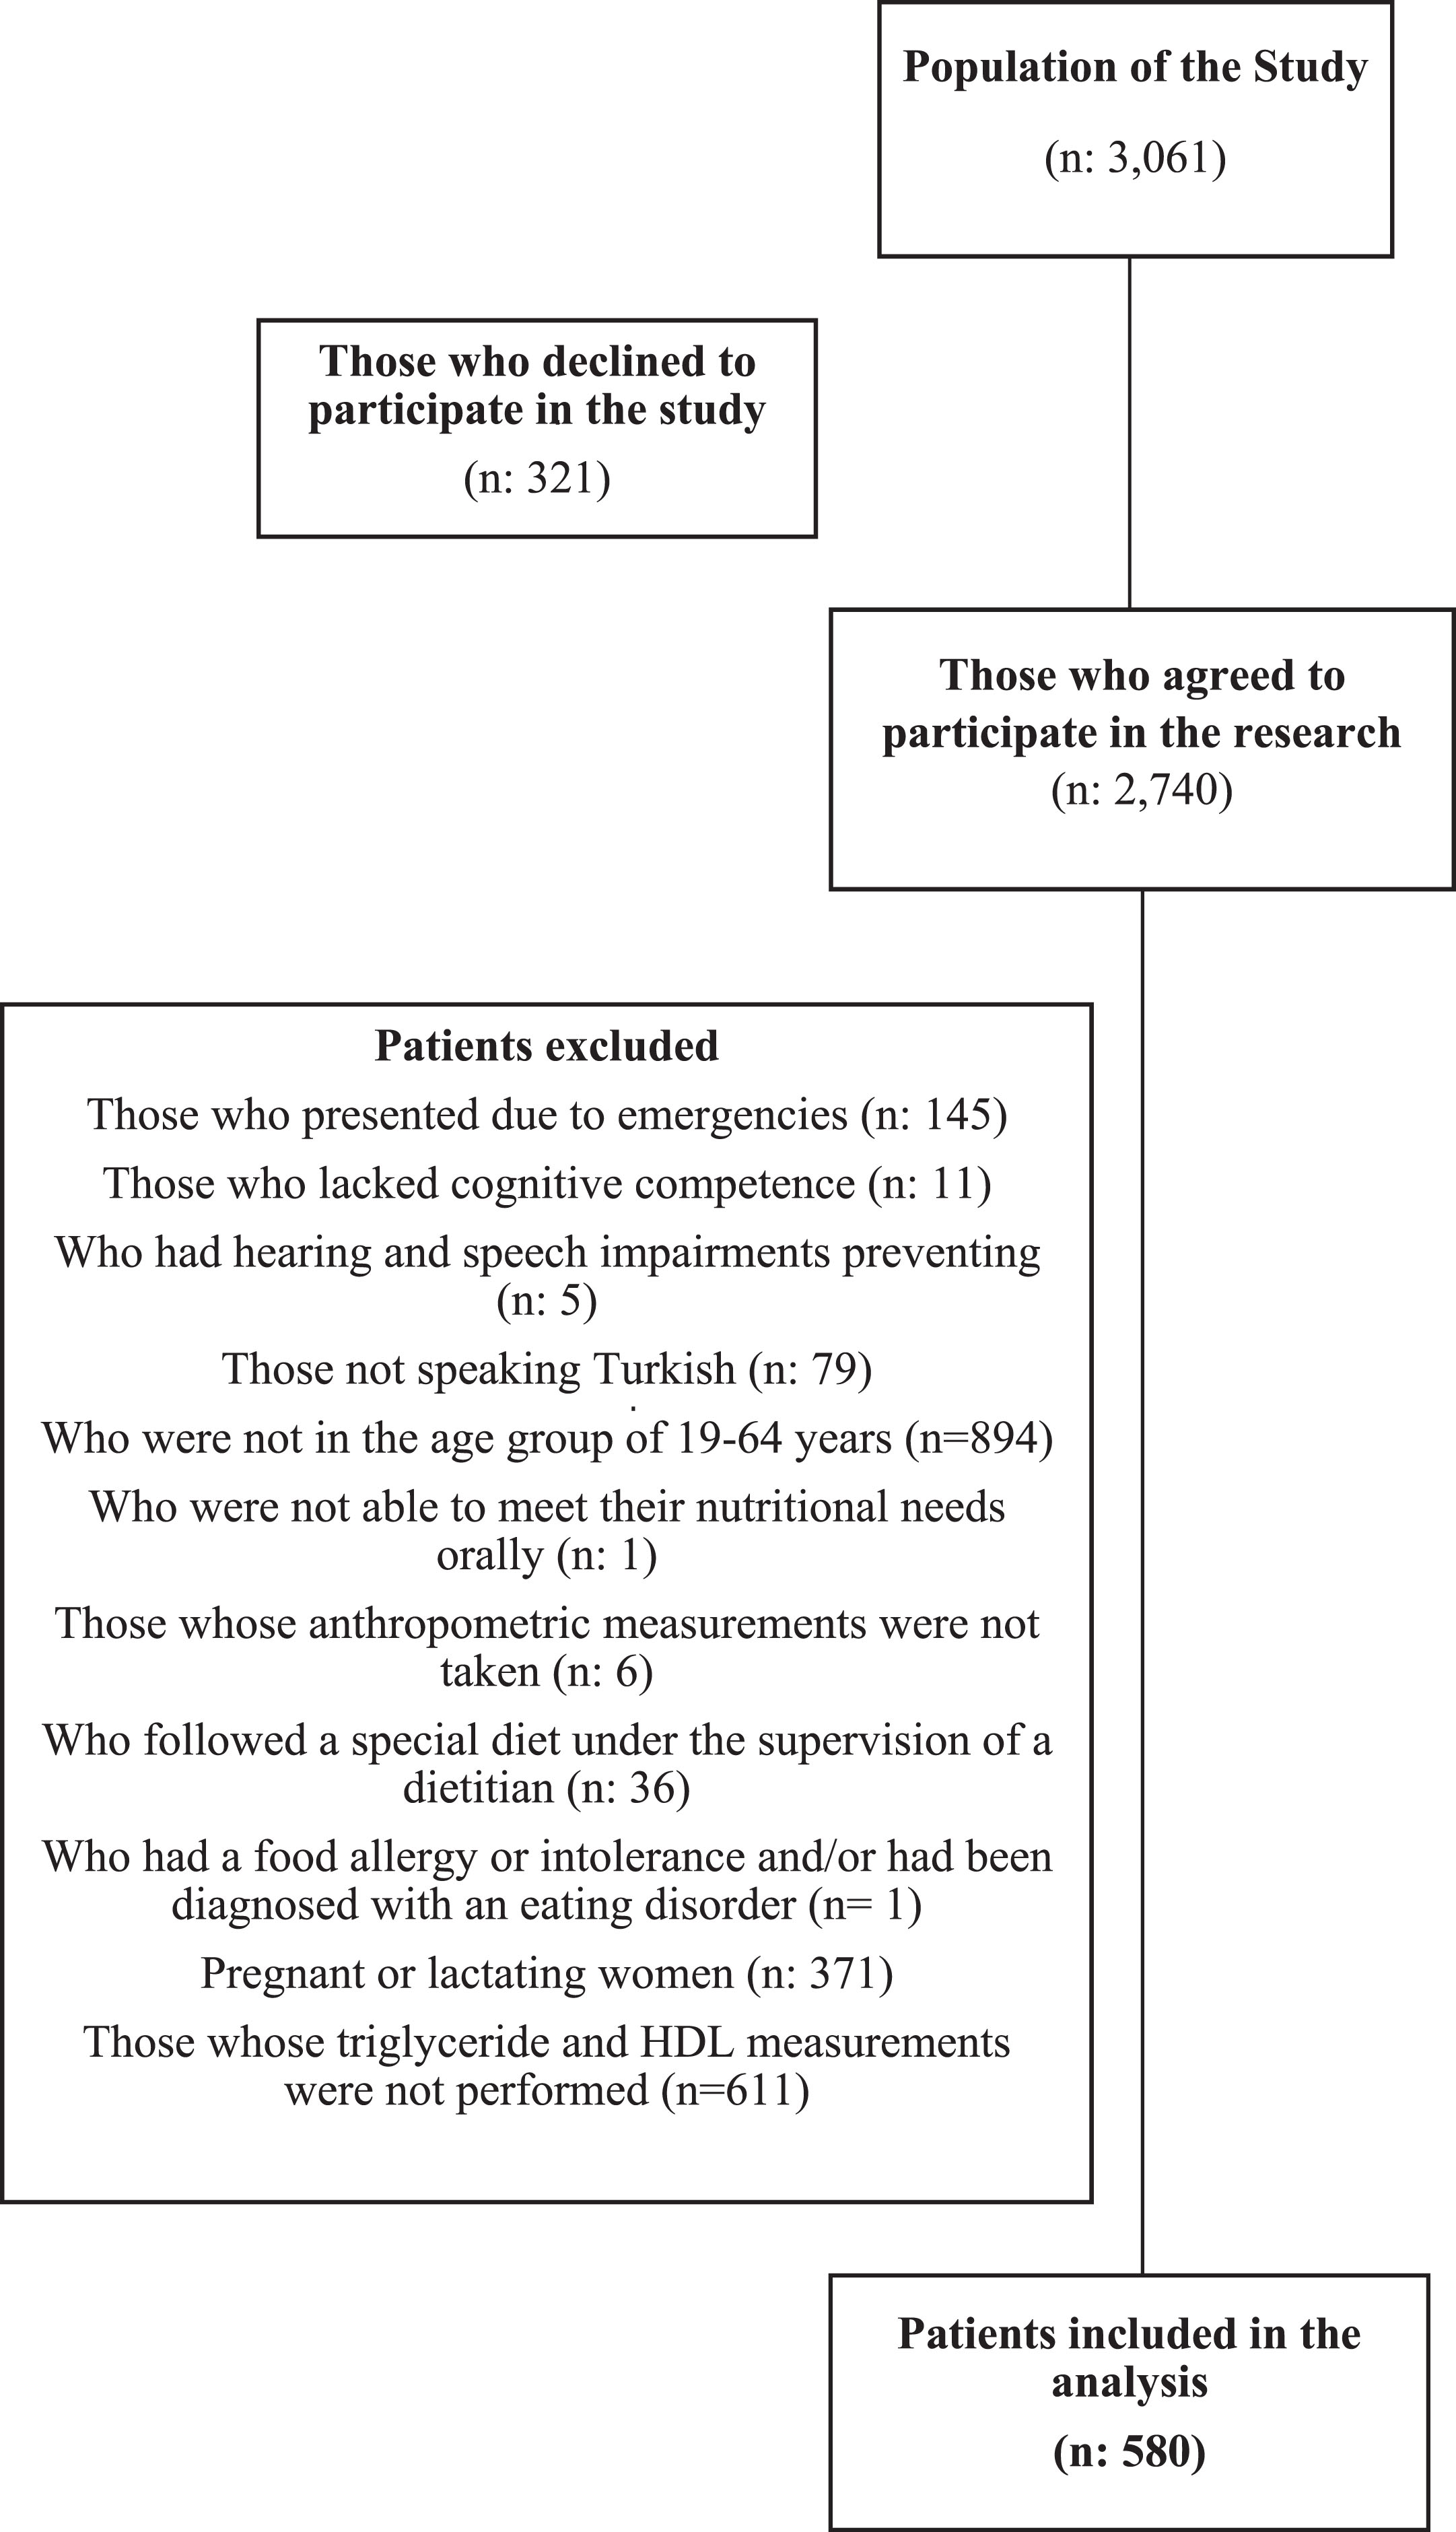
Flowchart of participant inclusion in the study.
Researchers collected the data through face-to-face interviews. The researchers measured the body weight and height of the participants and calculated their BMI calculation by dividing the body weight in kilograms by the square of the height in metres, and measured their WC with a non-stretchable measuring tape [20]. VAI was calculated by the formula using BMI, WC, HDL and TG levels [11]. The HDL and TG values used in calculating the index were obtained from the records kept in the FHCs.
“VAI (Female): [WC (cm) / (36.58+(1.89 x BMI)] x [TG (mmol/L)/0.81] x [1.52/ HDL (mmol/L)]”
“VAI (Male): [WC (cm)/ (39.68+(1.88 x BMI)] x [TG (mmol/L)/1.03] x [1.31/ HDL (mmol/L)]”
Data collection tools
Descriptive information form
It consists of eight questions questioning the identifying characteristics of the individuals participating in the study.
Adult Picky Eating Questionnaire (APEQ)
Ellis et al. [21] developed the APEQ to assess picky eating behaviors in adults, and Ayyıldız and Esin [22] adapted it into Turkish. The APEQ consists of 16 items and the following 4 subscales: “Meal Presentation”, “Food Variety”, “Meal Disengagement”, and “Taste Aversion”. Responses on a five-point Likert scale ranged from never (1) to always (5). While strict preferences in preparing and serving meals are assessed in the “Meal Presentation” sub-dimension, the diversity of foods and food groups included in the diet is assessed in the “Food Variety” sub-dimension, avoidant behavior at mealtimes is assessed in the “Meal Disengagement” sub-dimension, and the rejection of bitter and sour foods is assessed in the “Taste Aversion” sub-dimension. The higher the score obtained from the APEQ, the more the person displays picky eating behavior [21, 22].
MEDFICTS (Meats, Eggs, Dairy, Fried foods, fat in baked goods, Convenience foods, fats added at the Table, Snacks) Diet Assessment Questionnaire
“The MEDFICTS Diet Assessment Questionnaire” (hereafter referred to as “MEDFICTS”) consists of eight main categories: “meats, eggs, dairy products, fried foods, bakery products, ready meals, table oils, and snacks”. Additionally, each category is divided into two groups based on the fat content of the foods: Group 1 and Group 2. Portion size is specified for each food category. The score is calculated for each food item within the categories by selecting the appropriate option from the “Weekly Consumption” frequency and “Portion Size” columns. In the “Weekly Consumption” frequency column, a response of “Rarely/Never” is awarded 0 points, “3 or less” is awarded 3 points, and “4 or more” is awarded 7 points. In the “Portion Size” column, a response of “small” is awarded 1 point, “medium” is awarded 2 points, and “large” is awarded 3 points. The weekly consumption score for each category is multiplied by the portion size score and recorded in the score column for that group. No scoring is done for Group 2 foods. However, if the portion size for Group 2 foods in the meats category is selected as “large,” 6 points are directly recorded. After all categories have been completed and scored, the total score is determined by summing all the points. A high score obtained from the MEDFICTS indicates poor adherence to “American Heart Association Dietary Fat Intake Guidelines” [9]. Göktaş et al. [23] adapted the MEDFICTS into Turkish.
International Physical Activity Questionnaire – Short Form (IPAQ-SF)
Craig et al [24] developed the IPAQ-SF to measure physical activity level in adults, and Sağlam et al [25] adapted it into Turkish. With the IPAQ-SF, the researcher obtains information on how much time a person spends for walking, performing moderate and vigorous activities, and sitting. Higher scores obtained from IPAQ-SF indicate an increase in physical activity level [24, 25].
Data analysis
The data of the study were analysed using SPSS (Statistical Package for the Social Sciences) version 23.0. In the analysis of the data, descriptive statistics, including numbers, percentages, arithmetic mean, and standard deviation, were used. Kurtosis and skewness coefficients were used to evaluate whether the distribution was normal. The relationship between picky eating behaviors and BMI, WC, TG, and HDL levels was analyzed using Pearson correlation analysis. Simple and multivariate linear regression analyses (enter method) were used to determine the effects of picky eating behaviors on MEDFICTS score and VAI. The MEDFICTS score and VAI were the dependent variables. Picky eating behaviors were the independent variables. Sex, age, educational level, marital status, perceived economic status, presence of chronic disease, smoking status, alcohol consumption status, and physical activity level were included in the models as covariates. Model accuracy was assessed by adjusted R-squared. Variance Inflation Factor (VIF < 4) and Durbin Watson (DW: 1.5–2.5) values were considered in the evaluation of multicollinearity and autocorrelation. The level of significance for statistical tests was set at p < 0.05.
Ethical approval
The participants were informed about the aims and scope of the study and gave written consent that they agreed to participate in the study. Before conducting the study, we obtained ethical approval from Bandırma Onyedi Eylül University Health Sciences Non-Interventional Research Ethics Committee (December 19, 2022, 2022–262).
Results
The mean age of the participants was 49.73±11.38 years, of them, 75.3% were women, 83.1% were married, 38.9% had primary school education or below, 77.9% perceived their income as medium, 55.2% had at least one chronic disease. The proportion of the participants who smoked or consumed alcohol was 25.9% and 15.0%, respectively (Table 1).
Descriptive characteristics of the participants (n = 580)
Descriptive characteristics of the participants (n = 580)
SD: Standard Deviation. Min: Minimum. Max: Maximum. CVD: Cardiovasculer Disease. COPD: Chronic Obstructive Pulmonary Disease. *Multiple options were marked.
The mean scores the participants obtained from the overall APEQ and its “Meal Presentation”, “Food Variety”, “Meal Disengagement”, “Taste Aversion” sub-dimensions were 2.39±0.53, 2.54±0.68, 2.08±0.90, 2.52±0.99, and 2.20±1.04, respectively. The participants’ mean MET score, which is an indicator of their physical activity level, was 1,890.20±1,453.65. The mean score the participants obtained from the MEDFICTS was 62.28±24.74. The participants’ mean body weight, height, BMI, WC, TG and HDL levels were 75.36±14.53 kg, 1.63±0.07 m, 28.26±5.48 kg/m2, 92.50±14,63 cm, 8.10±4,00 mmol/L and 2.89±0.76 mmol/L, respectively (Table 2).
Mean values for the APEQ, IPAQ-SF, MEDFICTS score, anthropometric measurements and some biochemical parameters
APEQ: Adult Picky Eating Questionnaire. IPAQ-SF: International Physical Activity Questionnaire-Short Form. MET:Metabolic Equivalent of Task. MEDFICTS: (Meats, Eggs, Dairy, Fried foods, fat in baked goods, Convenience foods, fats added at the Table, Snacks) Diet Assessment Questionnaire. BMI: Body Mass Index. WC: Waist Circumference. TG: Triglyceride. HDL: High-Density Lipoprotein. VAI: Visceral Adiposity Index.
As is seen in Table 3, there was a statistically significant negative relationship between the mean scores obtained from the overall APEQ and its “Meal Presentation”, “Food Variety”, “Taste Aversion” sub-dimensions, and the MEDFICTS score, and between the mean scores obtained from the overall APEQ and its “Meal Presentation” sub-dimensions, and the VAI. There was also a statistically significant negative relationship between the participants’ BMI and WC values, and the mean scores they obtained from the overall APEQ and its “Meal Presentation” and “Food Variety” sub-dimensions, between the participants’ TG levels and the mean scores they obtained from the overall APEQ and its “Meal Presentation” sub-dimension, and between their HDL levels and the mean scores they obtained from the overall APEQ and its “Taste Aversion” sub-dimension (Table 3).
Relationship between the mean scores obtained from the APEQ and its sub-dimensions, and MEDFICTS score, VAI, BMI, WC, TG and HDL levels
APEQ: Adult Picky Eating Questionnaire. MEDFICTS: (Meats, Eggs, Dairy, Fried foods, fat in baked goods, Convenience foods, fats added at the Table, Snacks) Diet Assessment Questionnaire. VAI: Visseral Adiposity Index. BMI: Body Mass Index. WC: Waist Circumference. TG: Trigliserit. HDL: High Density Lipoprotein. Pearson correlation analysis.*p < 0.05, **p < 0.01, ***p < 0.001.
As seen in Table 4, picky eating behaviors (APEQ total score) (Model 1: β:–0.228, p < 0.05) are negatively associated with MEDFICTS score. “Meal Presentation” (Model 2: β:–0.189, Model 3: β:–0.160, Model 4: β:–0.172) and “Taste Avoidance” (Model 2: β:–0.162, Model 3: β:–0.145, Model 4: β:–0.117) subscales of the APEQ are negatively associated with MEDFICTS score (Table 4, p < 0.05).
Relationship between picky eating and MEDFICTS score according to linear regression analysis
SE: Standard Error. CI: Confidence Interval. MEDFICTS: (Meats, Eggs, Dairy, Fried foods, fat in baked goods, Convenience foods, fats added at the Table, Snacks) Diet Assessment Questionnaire. APEQ: Adult Picky Eating Questionnaire. *p < 0.05, **p < 0.01, ***p < 0.001. Variables included in the models: Model 1. APEQ (Continuous). Model 2: Meal Presentation (Continuous), Food Variety (Continuous), Meal Disengagement (Continuous), Taste Aversion (Continuous). Model 3. Meal Presentation (Continuous), Food Variety (Continuous), Meal Disengagement (Continuous), Taste Aversion (Continuous), Age (Continuous), Sex (Categorical). Model 4. Meal Presentation (Continuous), Food Variety (Continuous), Meal Disengagement (Continuous), Taste Aversion (Continuous), Age (Continuous), Sex (Categorical), Marital status (Categorical), Educational Status (Categorical), Perceived income status (Categorical), Presence of a chronic disease (Categorical), Smoking (Categorical), Alcohol consumption (Categorical), Physical activity level (Continuous).
Picky eating behaviors (APEQ total score) (Model 1: β:–0.089) are negatively associated with VAI. “Meal Presentation” (Model 2: β:–0.168, Model 3: β:–0.112, Model 4: β:–0.112) subscales of the APEQ are negatively associated with VAI (p < 0.05, Table 5).
Relationship between picky eating and VAI according to linear regression analysis
SE: Standard Error. CI: Confidence Interval. VAI: Visceral Adiposity Index. APEQ: Adult Picky Eating Questionnaire. *p < 0.05, **p < 0.01, ***p < 0.001. Variables included in the models: Model 1. APEQ (Continuous), Model 2: Meal Presentation (Continuous), Food Variety (Continuous), Meal Disengagement (Continuous), Taste Aversion (Continuous), Model 3. Meal Presentation (Continuous), Food Variety (Continuous), Meal Disengagement (Continuous), Taste Aversion (Continuous), Age (Continuous), Sex (Categorical). Model 4. Meal Presentation (Continuous), Food Variety (Continuous), Meal Disengagement (Continuous), Taste Aversion (Continuous), Age (Continuous), Sex (Categorical), Marital status (Categorical), Educational Status (Categorical), Perceived income status (Categorical), Presence of a chronic disease (Categorical), Smoking (Categorical), Alcohol consumption (Categorical), Physical activity level (Continuous).
This study is one of the leading studies investigating the relationship between selective eating behaviours, MEDFICTS score and VAI in adults. In a study conducted with 580 adults, the authors determined that picky eating behaviors were negatively associated with the MEDFICTS score and VAI (p < 0.05). Our analysis of the sub-dimensions of the APEQ demonstrated that there was a negative relationship between the “Meal Presentation” and “Taste Aversion” sub-dimensions and the MEDFICTS score, and between the “Meal Presentation” sub-dimension and the VAI (p < 0.05).
Adult picky eaters have a lower dietary diversity and consume less fruit and vegetables than non picky eaters [26]. In a study conducted with young adults, picky eaters preferred a limited number of foods, such as pasta, chicken, fruit, pizza, and potatoes [7]. In Kauer et al.’s study [27], adult picky eaters were more likely to reject foods with slippery or slimy textures and sauced foods than non-picky eaters, and picky eaters were more sensitive to bitter or sour tastes. In the present study, picky eating behaviors were negatively associated with the MEDFICTS score (p < 0.05). The MEDFICTS is administered to assess the consumption of “meat, eggs, dairy products, fried foods, fats in baked goods, convenience foods, fats added at the table, and snacks” in adults [28]. This result is thought to stem from the fact that most of these foods have slippery or slimy textures and that picky eaters consume a limited variety of foods. On the other hand, picky eaters’ awareness of adequate and balanced nutrition may be higher, and they may turn to healthy foods by receiving social support from communities with similar eating habits, which may cause picky eaters to consume fewer foods with high-fat content. Individuals who tend to picky eating may also increase their feeling of fullness and reduce their dietary fat intake by consuming more fiber-rich foods. In this study, we determined a negative association between the MEDFICTS score and the scores obtained from both the “Meal Presentation” sub-dimension, which assesses strict preferences regarding meal preparation and presentation, and the “Taste Aversion” sub-dimension (p < 0.05). These results might be due to the presence of food neophobia, and obsessions and/or compulsions in picky eaters. In various studies, it has been shown that levels of food neophobia and obsessive-compulsive disorder are higher in picky eaters [27, 29–31]. The negative relationship between the Taste Aversion sub-dimension and the MEDFICTS score may be because the participants of the present study lived in the Southern Marmara region of Turkey, where foods with bitter and sour tastes are less preferred. Foods with bitter and sour tastes are mostly preferred in the Eastern and Southeastern regions of Turkey.
The effects of picky eating on obesity in adults are still unclear. In some studies, it has been asserted that there is no relationship between picky eating and BMI [21, 27]. On the other hand, in longitudinal studies, it has been demonstrated that adolescents who were classified as picky eaters during childhood also have an increased risk of low body weight and short stature [17, 32]. Ellis et al. [33] reported that high BMI in adults was associated positively with low food variety and negatively with “Meal Disengagement”, two subscales of APEQ. Picky eating is generally negatively associated with BMI when measured continuously, which may protect the person against obesity [16, 34]. In the current study, scores for “Meal Presentation”, one of the sub-dimensions of the APEQ, were negatively associated with the VAI scores (p < 0.05). Although BMI and WC are parameters frequently used in the diagnosis of obesity, BMI cannot distinguish between fat mass and muscle mass, and WC cannot distinguish between visceral and subcutaneous fat [35]. An increase in the level of VAI, i.e. visceral adiposity and visceral adiposity dysfunction, is positively associated with cardiometabolic risk factors [36]. In this study, picky eating behaviors were negatively associated with VAI, which may be due to decreased dietary energy consumption because the number of foods consumed by picky eaters is limited. Regarding the “Meal Presentation” sub-dimension, picky eaters may lose body weight since they refuse to consume foods whose preparation and presentation they are not accustomed to. In this study, the MEDFICTS score decreased with the increase in picky eating behaviors in adults, which may explain the negative relationship between picky eating behaviors and VAI. In general, a decreased MEDFICTS score indicates that saturated fat, cholesterol and total fat in the person’s diet are limited and according to studies, reducing dietary fat intake protects the person against abdominal obesity [37–39].
Limitations of the study are that the results can be generalised to its own population because the study was conducted with adults applying to 5 family health centres, the data were collected based on personal declaration and the study could not clearly reveal the cause-effect relationship because it was cross-sectional. Finally, the effects of sociodemographic factors such as education level, income level, place of residence (urban or rural), and ethnicity on picky eating are still unclear.
Conclusion
In this study, participants’ adoption of stricter rules on meal preparation and presentation was associated with a decrease in MEDFICTS score and a decrease in VAI. In addition, in this study, not consuming bitter and sour foods was found to be associated with a decrease in MEDFICT score. We recommend that future studies be conducted on a community based and investigate the association with picky eating behaviours on macro-micro nutrient intake, and effects of picky eating behaviors on health should be revealed.
Funding statement
The authors report no funding.
Conflicts of interest statement
The authors declare that there are no conflicts of interest.
Author contributions
K.T.S. Conceptualization, Data curation, Formal analysis, Investigation, Methodology, Software, Supervision, Visualization, Writing – review & editing, Project administration, R.M.A. Conceptualization, Data curation, Formal analysis, Investigation, Methodology, Software, Visualization, Writing - original draft, N.D. Conceptualization, Data curation, Investigation, Methodology, Visualization, Writing – review & editing, S.A. Conceptualization, Data curation, Investigation, Methodology, Supervision, Writing – review & editing.
Data availability statement
The data that support the findings of this study are available from the corresponding author, K.T.S, upon reasonable request.