
Abstract
Introduction
The initial form of extracorporeal membrane oxygenation (ECMO) therapy used in the neonatal population was venoarterial (VA) ECMO [1]. This form of therapy provides cardiac and respiratory support to patients by cannulating an artery (often common carotid) and a vein (often internal jugular). With this form of support, ECMO allows time for the heart and lungs to recover from the underlying disease especially for neonates with respiratory failure often presenting with pulmonary hypertension [2, 3]. ECMO has helped over 35,000 neonatal patients worldwide [4].
The use of venovenous (VV) ECMO has become more widespread in the treatment of neonates with hypoxic respiratory failure refractory to medical management along with other patient populations. VV ECMO cannulation can either be single or dual-lumen. In the case of dual-lumen only a single site for cannulation is needed often in the internal jugular vein [5]. The catheter is inserted into the right atrium with the return of oxygenated blood directed toward the tricuspid valve. Advantages of VV ECMO include sparing of cannulation and ligation of a major artery, decreased risk of embolization, cardiac stun and intraventricular hemorrhage [6–8].
As the goal of VV ECMO is to provide respiratory support to the patient, a desired oxygen delivery rate is used to set the ECMO pump flow. VV ECMO for neonates aims for an oxygen delivery rate of 6 cc/kg/min which usually equates to a pump flow of 120 mL/kg/min [9]. Recirculation however can reduce effective oxygen delivery [10]. Recirculation of oxygenated blood back into the ECMO circuit while unoxygenated blood returns to the heart reduces the efficiency of the system and can cause severe hypoxemia [2, 11]. The percent of oxygen actually delivered versus desired oxygen delivery is hereafter referred to as the percent oxygen delivery.
The percent of oxygenated blood that gets recirculated can be affected by two major factors: catheter position/configuration and blood flow [12, 13]. The former includes variables related to the catheter. Proper orientation of the dual-lumen catheter so that oxygenated and deoxygenated blood do not mix is key [13]. Orientation of the catheter may be affected by insertion technique, as well as size and position of the patient (supine, seated, head/neck rotated). The second factor, blood flow, may include factors such as the ECMO pump flow, cardiac output, and preload on the heart.
In an effort to minimize catheter related contributions to recirculation, several redesigns of the catheter have been introduced [14]. However, if cardiac output is also a determinant of effective VV ECMO, then even optimal (lowest recirculation) positioning of the catheter will not improve treatment delivery. The heart’s low cardiac output will not be able to pump out all of the oxygenated blood causing some to recirculate. To our knowledge, the effect of cardiac output on efficiency of VV ECMO has not been previously studied. Recently, a new device to noninvasively and quantitatively measure percent recirculation during VV ECMO was introduced (ELSA Monitor, Transonic Systems, Inc., Ithaca, NY). The ELSA Monitor has previously been studied in the quantifying of recirculation when positioning the cannula during VV ECMO [12]. The aim of this study was to investigate the influence of central hemodynamics on the percent oxygen delivery through recirculation measurements in lambs on VV ECMO. It was also the intention to compare results of recirculation measured by the ELSA Monitor with those obtained using blood sampling of oxygen saturations from the central venous line (CVL Method).
Methods
Experimental procedure
After IACUC approval, this study was performed on seven newborn lambs (weighing between 3.9 and 5.9 kg with a mean of 4.7 kg) at Children’s National Health System, Washington, D.C. The following procedure was utilized: Anesthesia and intubation Insertion of femoral arterial and venous catheters Measurement of initial hemodynamic status (COstatus Monitor) Insertion of dual lumen catheter (V15, OriGen Biomedical, Austin, TX) Pump was set at prescribed flow 110–120 mL/kg/min [9] Recirculation (by ELSA) was minimized by variation of catheter position using 90 degree rotation intervals Measurement of hemodynamic status (COstatus Monitor) during VV ECMO (ECMO pump flow was decreased to the level of no recirculation as measured by the ELSA Monitor, approximately 210 mL/min) Recirculation was measured by ELSA and CVL methods at varying ECMO pump flows from 200–600 mL/min (This ranged for the different animals anywhere from 34 mL/min/kg to 154 mL/min/kg) Euthanization of animal
Cardiac output measurement before and during VV ECMO
The COstatus Monitor (Transonic Systems Inc., Ithaca, NY) uses the technique of ultrasound dilution (UD). UD principle was first introduced in 1995 for use in hemodialysis and has been used extensively since in this field [15]. The underlying concept is that the ultrasound velocity of blood decreases with an injection of saline producing a dilution curve. Blood has an ultrasound velocity of 1580 m/sec while saline (0.9% NaCl) has an ultrasound velocity of 1533 m/sec. The COstatus system consists of an extracorporeal loop (AV loop) primed with heparinized saline connected to the arterial and venous catheters. On the AV loop are two clamp-on flow/dilution sensors and a small pump that circulates blood at 12 mL/min.
Each lamb was connected to the COstatus system prior to VV ECMO for measurements of hemodynamic status including cardiac output and blood volume parameters. Measurements were made by three or more injections of 1 mL/kg of body temperature isotonic saline into the extracorporeal loop. Figure 1a shows the resulting dilution curve produced before beginning VV ECMO.
During VV ECMO, each lamb was measured with the COstatus Monitor and the ELSA Monitor described in the following section (Fig. 2). Using COstatus while on VV ECMO requires reposition venous side of the AV loop to the ECMO circuit after the pump and before the oxygenator. Figure 1b is a resulting dilution curve of COstatus produced while on VV ECMO. Measurements of CO during VV ECMO with COstatus were performed at an ECMO pump flow of 210 mL/min.
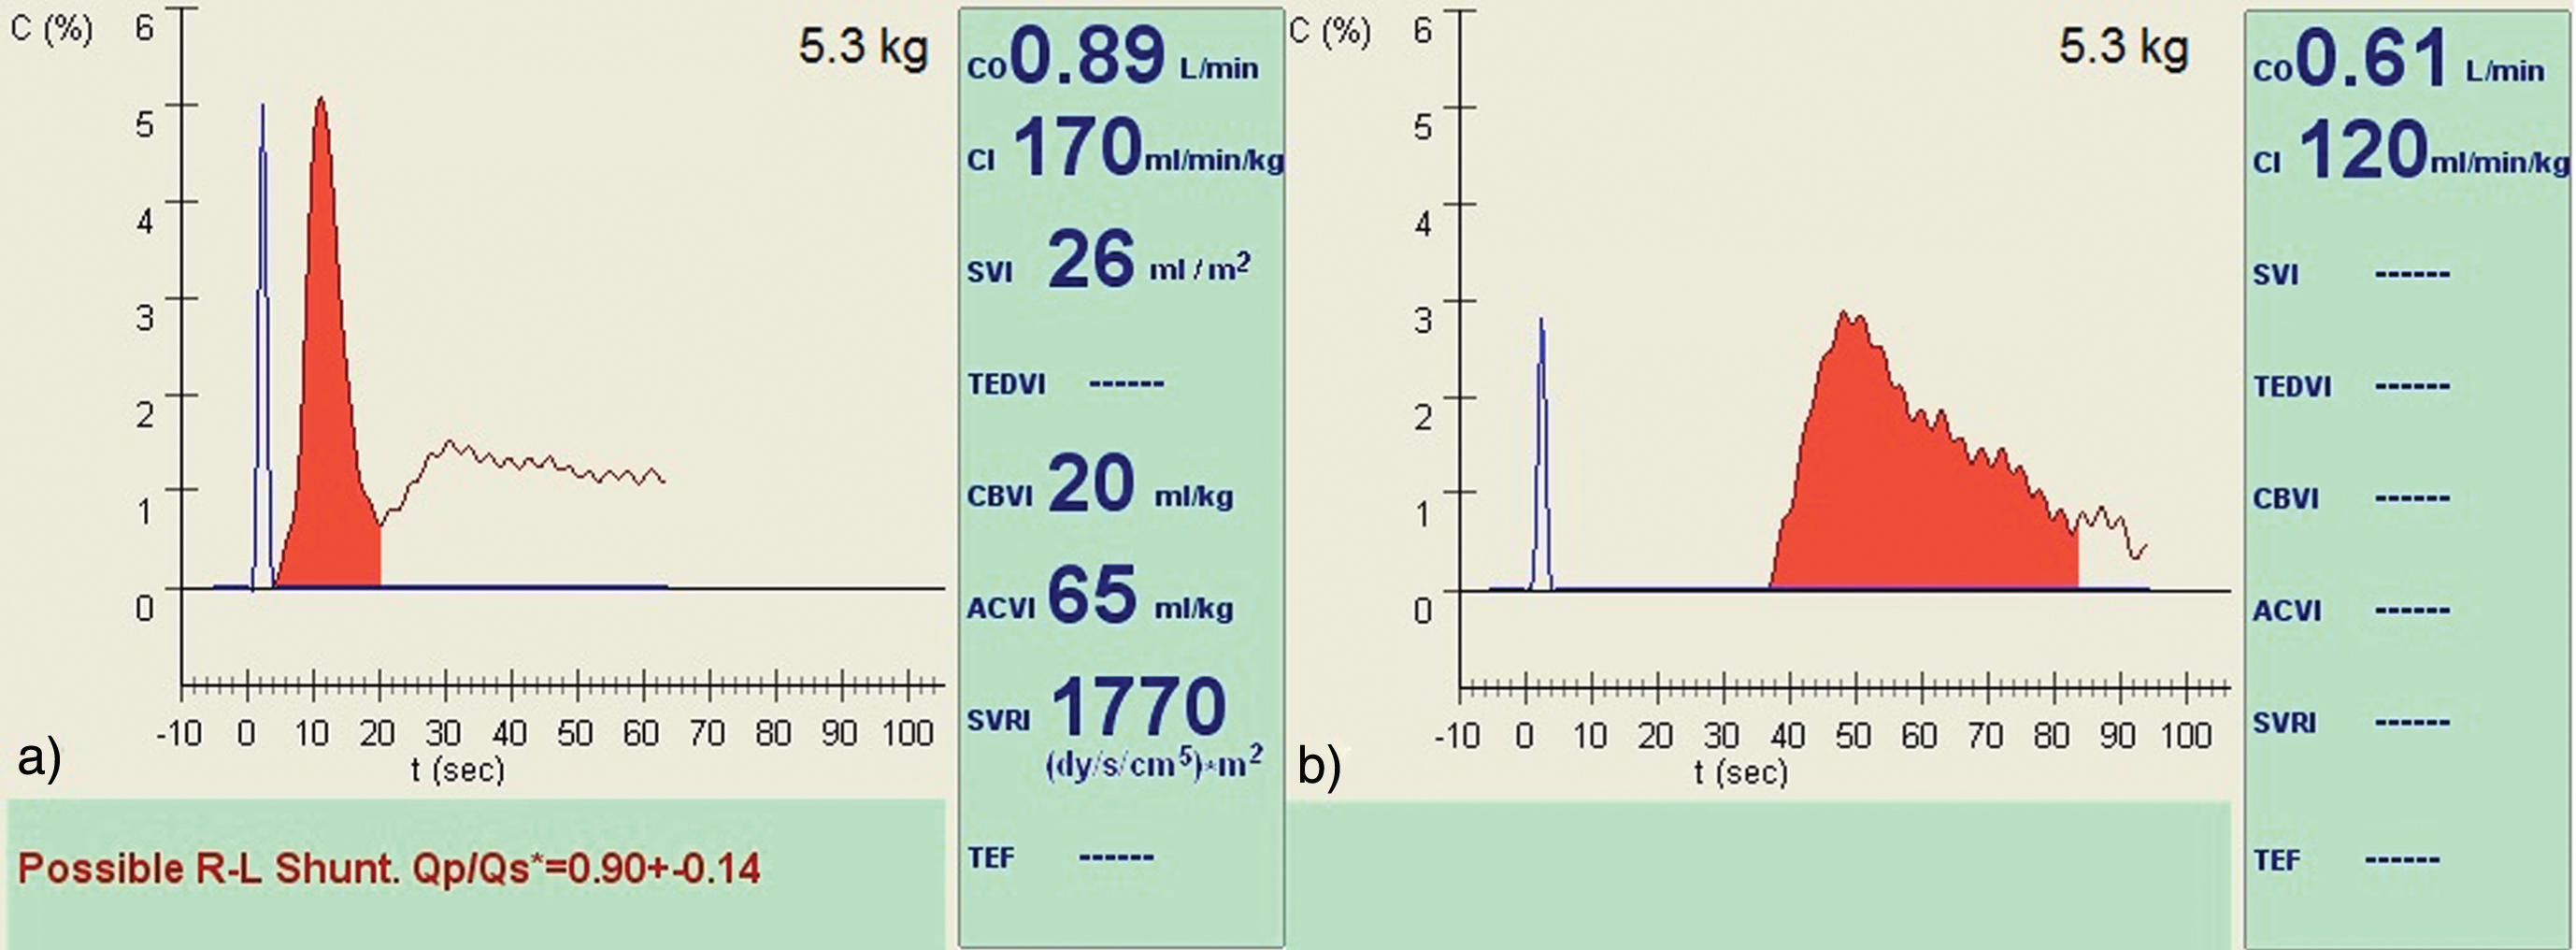
a) COstatus Monitor screenshot of 5.3 kg lamb before VV ECMO. The R-L Shunt message can be ignored as it is displayed based on the shape of the curve and calibrated to human circulation b) Same lamb during VV ECMO.
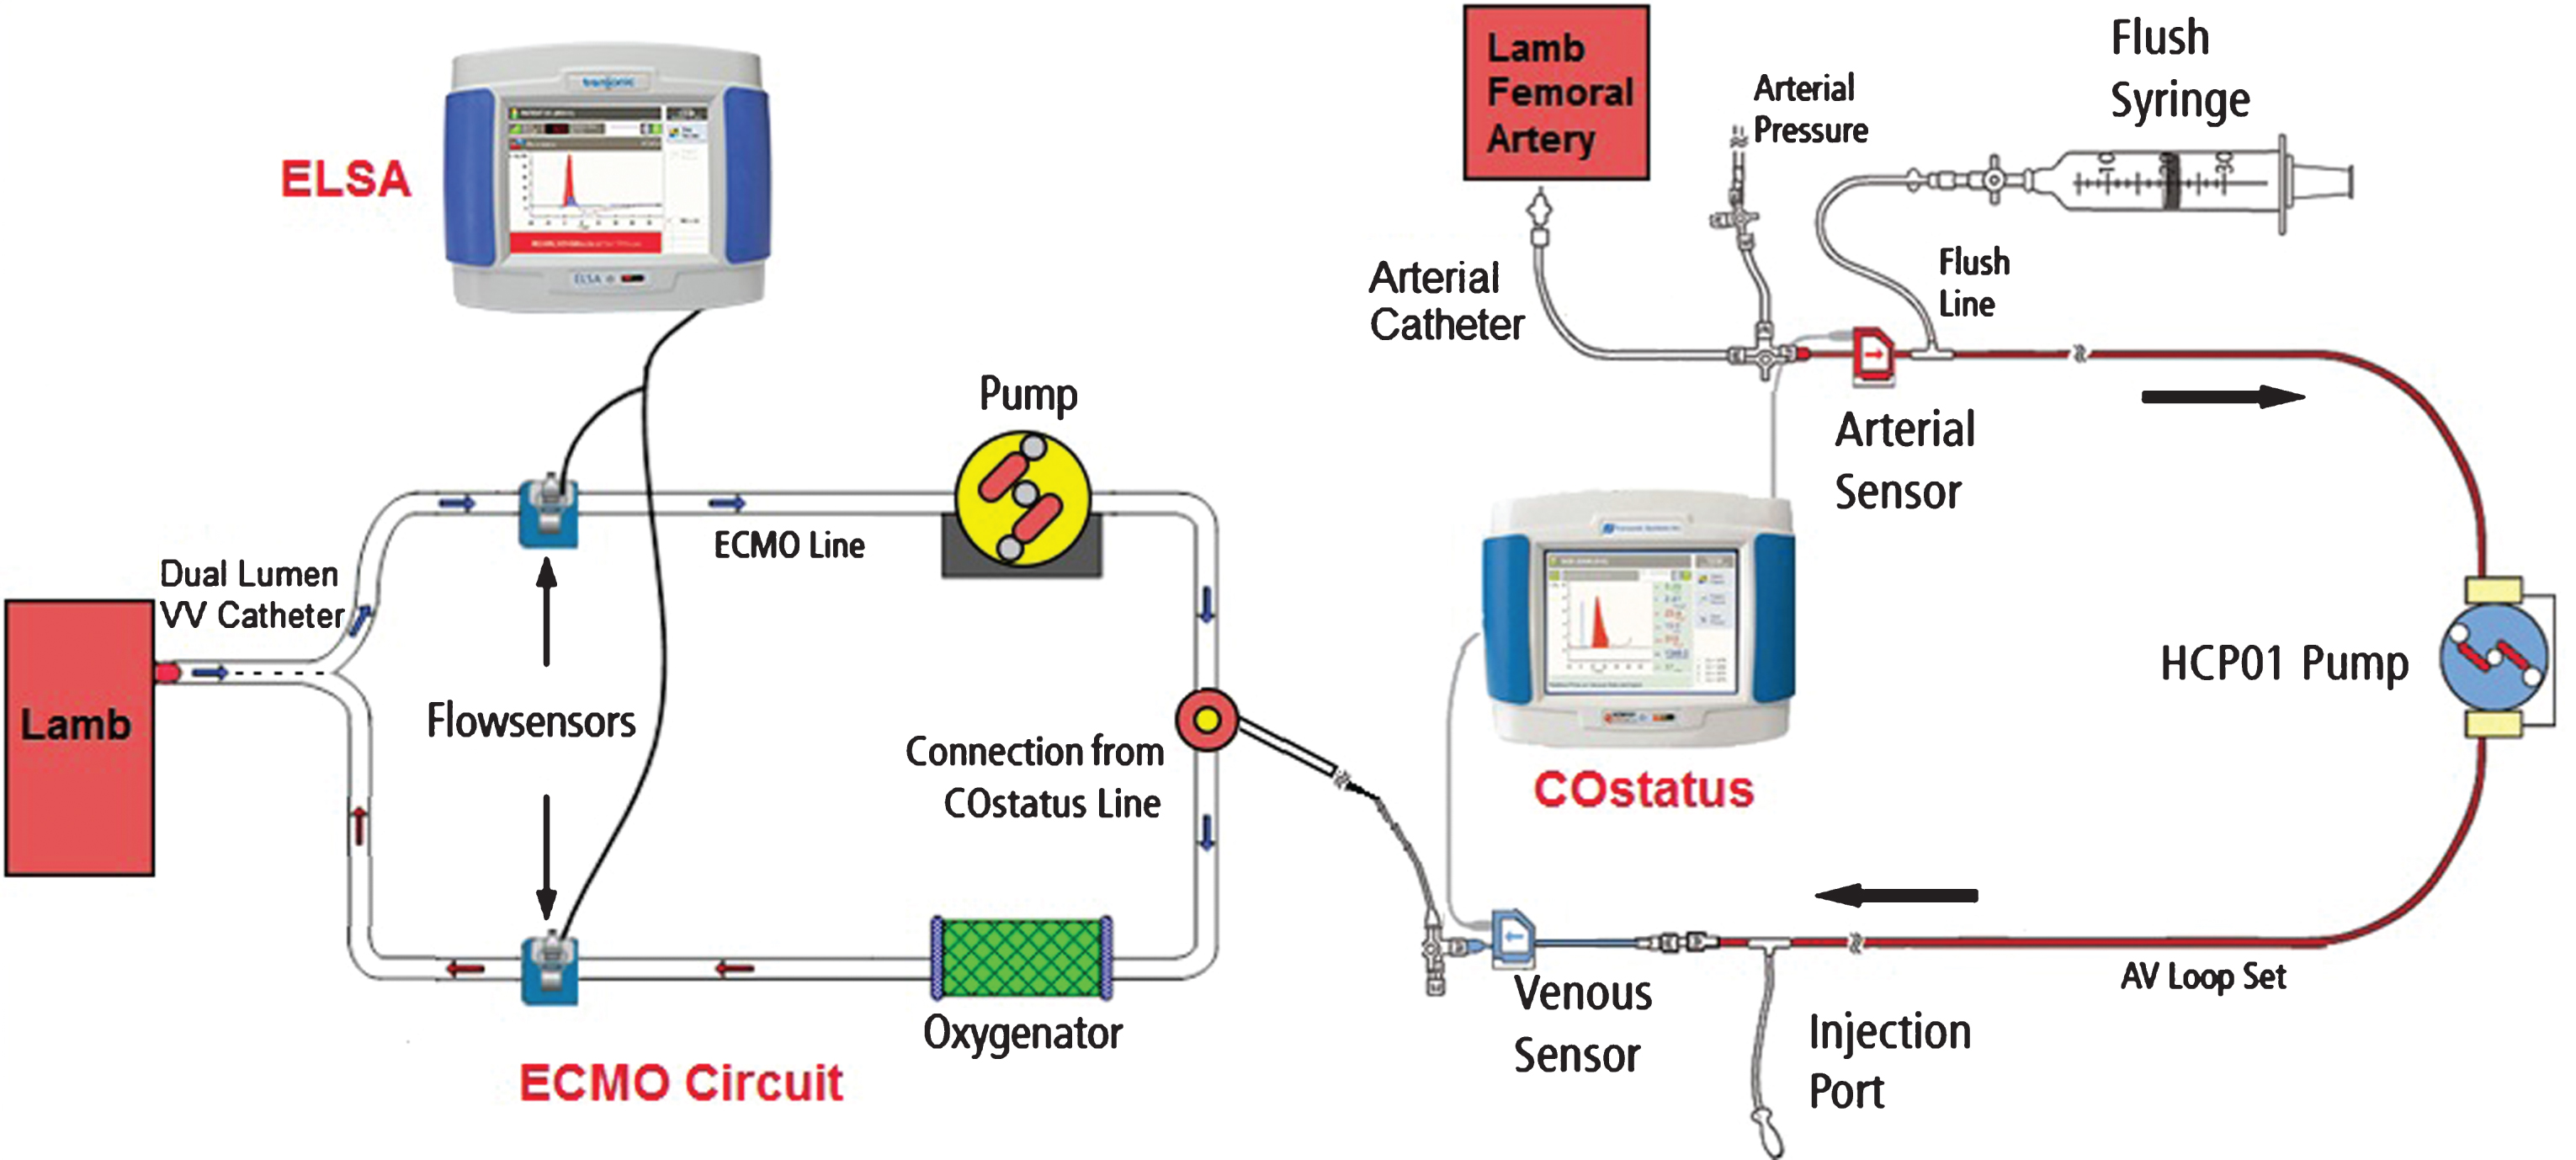
Lamb on VV ECMO setup with COstatus Monitor and ELSA Monitor.
The ELSA Monitor also uses the technique of ultrasound dilution to measure recirculation. The ELSA Monitor involved the placement of two flow sensors on each end of the ECMO circuit (Fig. 2). These sensors recorded simultaneous dilution curves after saline injections to determine the percent recirculation (REC%) of oxygenated blood. The lambs were injected with 5–10 mL of isotonic saline to measure recirculation. Recirculation is calculated using the ratio of the areas under each dilution curve:
Where: Sv –area under the venous curve; Sa –area under the arterial curve.
In addition to the measurements of percent recirculation, the ELSA Monitor also calculated Effective Cardiac Flow (ECF):
Where: Qb –prescribed ECMO circuit blood flow.
ECF represents the actual delivered flow to the body after taking into account recirculation of oxygenated blood. Qb represents the prescribed ECMO circuit blood flow or the desired flow to the body. The desired flow (Qb) equates to 120 mL/kg/min (an oxygen delivery rate of 6 cc/kg/min) [9]. The ratio of the ECF:Qb is analogous to the ratio of actual oxygen delivery rate:desired oxygen delivery rate. This gives the percent oxygen delivery:
The percent oxygen delivery is therefore related to the percent recirculation.
Measurements of recirculation were performed by taking blood samples from the SVC, IVC, and a location before and after membrane oxygenation according to the CVL method. The following formula was used to calculate recirculation [10]:
Statistics
A two-tailed paired t-test was performed to test the significance of the changes in cardiac index before VV ECMO and during VV ECMO.
Results
The cardiac index (CI), recirculation, and % oxygen delivery values were obtained from the seven newborn lambs (Table 1). CI ranged from 120 to 310 mL/min/kg. The two lambs with the lowest CI (120 and 130 mL/min/kg) required intensive treatment before VV ECMO. One of these lambs (#2) was hypovolemic before beginning VV ECMO and died during the first session with 45% recirculation at only half of the prescribed pump flow.CI had a tendency to decrease during the transition to VV ECMO, although not statistically significantly (Fig. 3).
Results of cardiac index and recirculation measurements
Results of cardiac index and recirculation measurements
*** - Values recorded at 50% of prescribed pump flow, just before animal died while on ECMO.
At the prescribed pump flow of 110–120 ml/min/kg, the optimal catheter position with the lowest percent recirculation was established (Fig. 4, Table 1). Using that value the percent of prescribed oxygen delivery was calculated. Percent oxygen delivery was then plotted versus CI with R2 = 0.74 and p-value 0.028.
Recirculation measurements by the ELSA Monitor and CVL method were compared for pump flows ranging between 200 and 600 mL/min. Calculated recirculation by CVL overestimated recirculation when compared to the ELSA Monitor (bias 10%), but the two methods correlated well with an R2 value of 0.8.
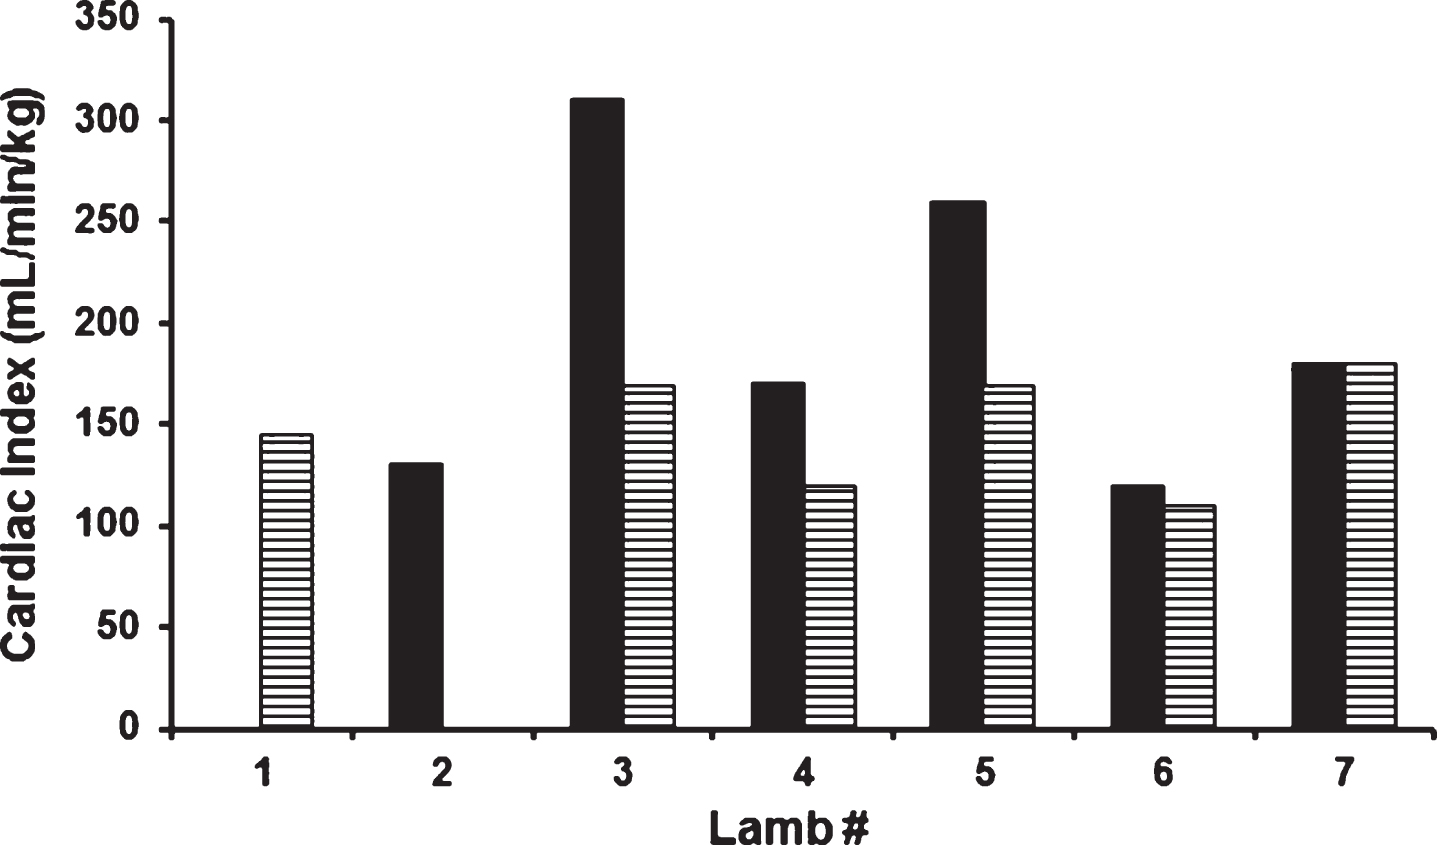
Cardiac Index before (solid bars) and during (striped bars) VV ECMO. The cardiac index measurement during ECMO was performed at a pump flow of 200 mL/min in the absence of recirculation. In lamb #1 CO measurements before ECMO were missed. Lamb #2 died before CO measurement was performed during VV ECMO.
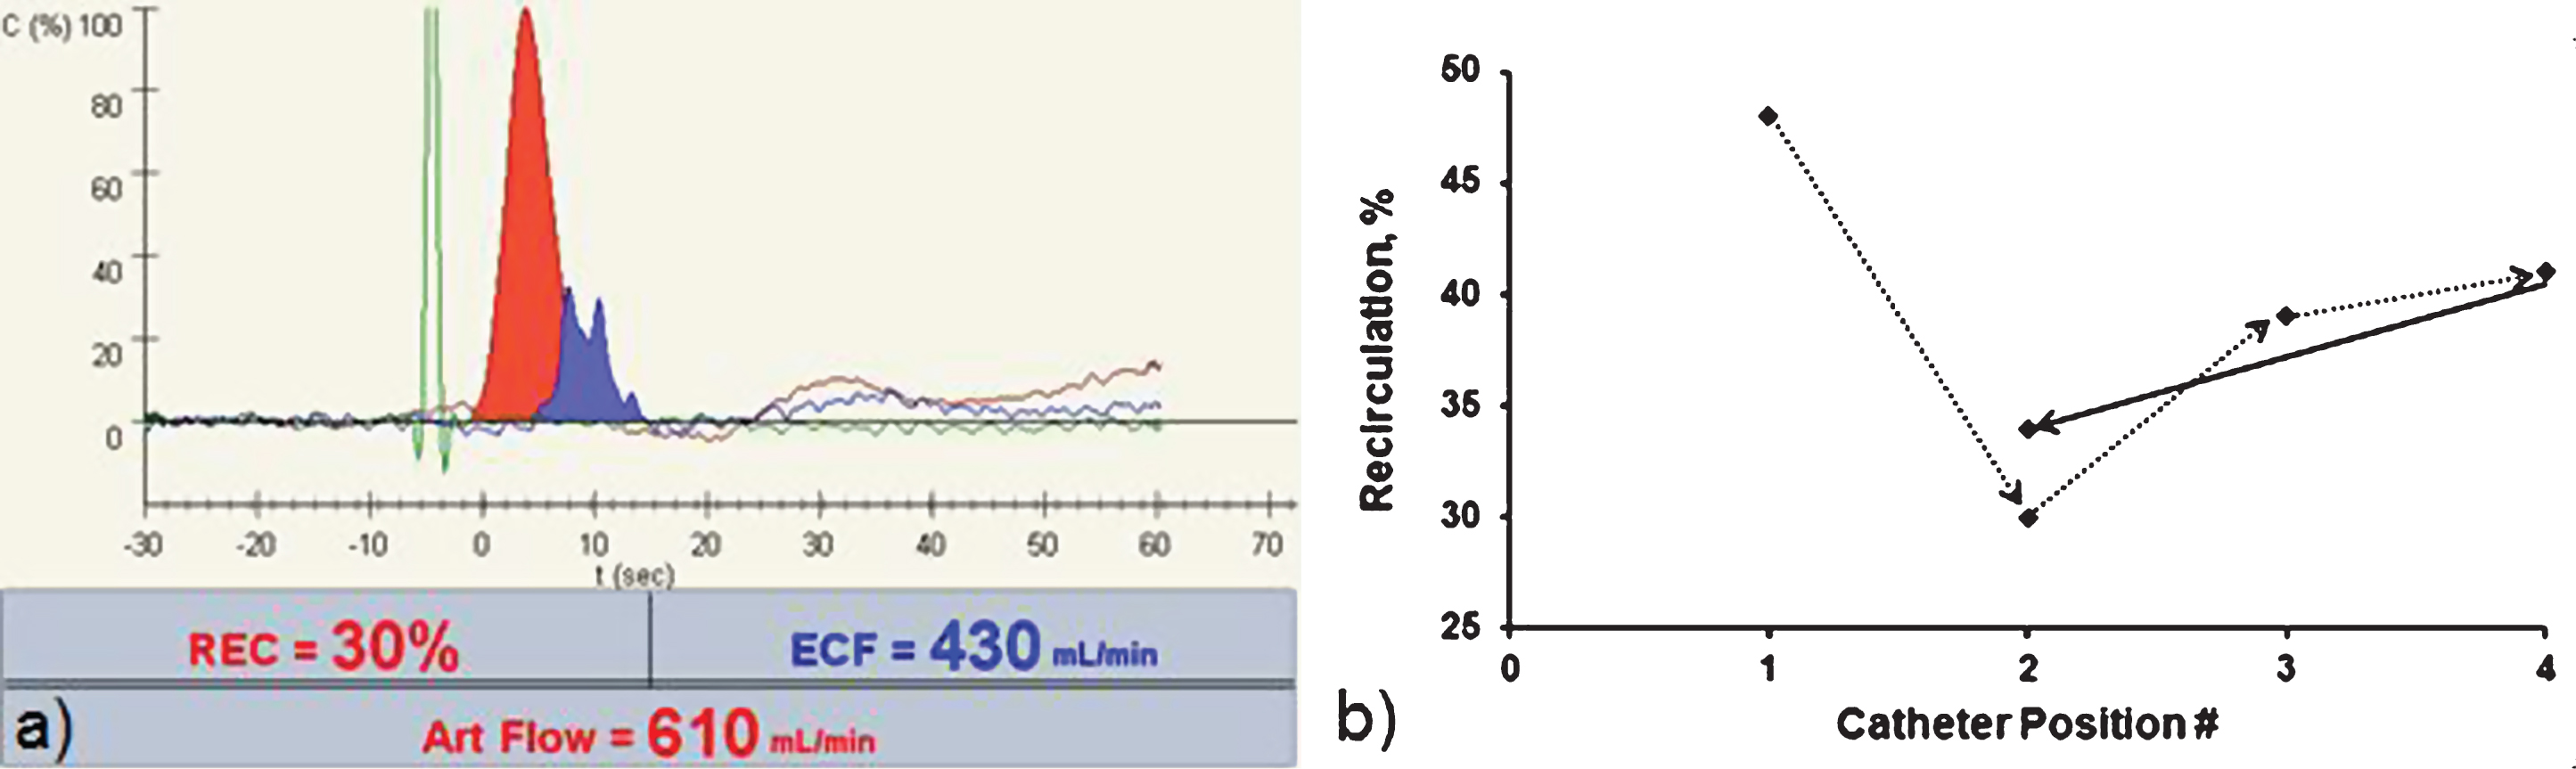
a) Recirculation curve for the optimized catheter position for this subject. b) The catheter position was changed 4 times with the recirculation % recorded at each. At the end, the catheter was returned to position 2 as it had the lowest recirculation percentage.
To our knowledge this is the first study where the influence of central hemodynamic during VV ECMO on percent oxygen delivery (at prescribed pump blood flow) was quantitatively investigated. A greater cardiac index on VV ECMO was correlated (R2 = 0.74) with the animal having a larger percent oxygen delivery (actual delivery/desired delivery). As seen in Eq. 3, percent oxygen delivery is calculated from the percent recirculation. In this way, cardiac index is correlated with percent recirculation.
Cardiac Index ∝ % Oxygen Delivery = 100% –REC%
CO measurements during VV ECMO by traditional technology, like thermodilution, require an intravenous injection of indicator which is subject to an unknown amount of indicator loss [16]. The amount of indicator sucked by the pump (not entering the heart) depends on the central venous catheter tip position, position of the arterial and venous cannulas, and the turbulence in the area. The indicator loss may be present in the case of no recirculation or recirculation. This limits the accuracy of CO measurements by thermodilution.
In the case of COstatus, the indicator (normal saline) is injected into the ECMO system in a safe place: after the pump and before the oxygenator. In the case of no recirculation, all of the indicator is delivered into the heart and is already heated (by the oxygenator) as require by ultrasound dilution technology helps to ensure more accurate CO measurements [17]. Thus for the measurement of CO during this study, pump flow was decreased to the level of no recirculation as measured by the ELSA Monitor to ensure the most accuratemeasurements.
A high percent recirculation or sudden increase in percent recirculation over time (Fig. 4) may be predictive of worsening heart function, or hypovolemic status leading to decreased cardiac output. Both lambs with the lowest measured CI prior to initiation of VV ECMO had problems during ECMO, with one lamb dying shortly after the start of the experiment. This supports the theory that central hemodynamics play a large role in the efficacy of VV ECMO. It may be beneficial to measure CO on a patient prior to initiating ECMO in order to make a more informed decision between VA and VV ECMO. This could potentially avoid ineffective VV ECMO and need for transition to VA ECMO. The data (Fig. 3) also suggests that CI has a tendency to decrease during transfer to VV ECMO. More studies are needed to determine the potential thresholds for minimum CI needed to achieve effective VV ECMO.
While lowering the pump flow in VV ECMO may be beneficial to reducing recirculation, it can also reduce arterial oxygenation and cause hypoxemia. Unlike VA ECMO, VV ECMO can require higher ECMO pump flow rates while also achieving lower arterial oxygenation [13]. This is why some patients are converted from VV ECMO to VA ECMO in order to better stabilize their paO2 levels [2]. In a case of hypoxemia caused by recirculation, it is best to keep the pump flow the same while reconfiguring the catheter position [18]. Through monitoring recirculation and adjusting accordingly, VV ECMO could be better optimized and thus reduce the occurrence of hypoxemia. Additionally, it may be helpful to have real-time measurements of recirculation at during cannulation to allow for optimal catheterpositioning.
Measurements of percent recirculation between the ELSA Monitor and the CVL Method were in agreement. The ELSA Monitor can be used to more easily determine the recirculation of oxygenated blood through the VV ECMO circuit without blood sampling.
The small sample size is a limitation of this study. Another limitation is the fact that cardiac output was not varied. If the animals were more stable and able to stay on VV ECMO longer, repeated measurements of recirculation at different cardiac outputs could lead to more robust conclusions.
In summary, this pediatric/neonatal animal experiment suggests that cardiac output could be a factor that influences the oxygen delivery at the prescribed VV ECMO circuit blood flow. High recirculation or an increase in recirculation over time may suggest decreased CO due to heart failure or hypovolemia. The new ELSA Monitor was useful to optimize catheter position through measurements of recirculation. Recirculation measurements with the ELSA Monitor correlated well with recirculation calculations by the CVL method.
Disclosure statements
Financial disclosure statement
The study was supported by Transonic Systems Inc., Ithaca, NY. Authors have no financial interest in the products discussed in this manuscript to disclose.
Animal research statement
This study was conducted in accordance with IACUC.
Footnotes
Acknowledgments
We gratefully acknowledge the Research Animal Facilities’ staff and the ECMO team at CNMC, as well as Nikolai Krivitski, PhD, DSC and Deborah Cooper from Transonic Systems Inc. whom all contributed enormously to the success of this study.