
Abstract
BACKGROUND:
We had reported on the left ventricular end-diastolic dimension (LVDd) in normal children from the premature/neonatal period to the adolescence period by using two-dimensional echocardiography, and formulated equations to evaluate normal LVDd values by using body height as an index. There was an inflection point at around birth that seemed relevant to the fetal and neonatal periods for the relation of LVDd and body height.
METHODS:
We aimed to reveal the true inflection point and its meaning by using change point regression analysis. The study group consisted of 421 neonates and infants. The ages at examination ranged from 24 weeks’ gestation to 1 year after birth. The subjects’ body heights at examination were between 31 and 75 cm.
RESULTS:
The analysis showed no definite inflection point in height, and a flat bottom was observed between body heights of 48 and 55 cm. The inflection range seemed to mean the duration of the neonatal period, which connects the fetal and infantile periods.
CONCLUSION:
The results revealed that neonates reach the infantile period slower than usually imagined, and the end of the neonatal period may be at the age when the body height is around 55 cm— in other words, at 2 months after birth. This manuscript might be the first one to consider the definition of the neonatal period using cardiovascular methods.
Keywords
Introduction
Echocardiography has played a large role in elucidating the development of cardiac dimensions in children. Many criteria of normal cardiac dimensions in childhood have been reported by using echocardiography. We have applied two-dimensional echocardiography to assess the information on the development of the left ventricular end-diastolic dimension (LVDd) in children <18 years of age by using body height as an index [1, 2]. We detected a linear relationship between the body height and the dimensions of the heart in individual subjects. Height is a simple and useful index for the assessment of the normalcy of cardiac dimensions in childhood. However, in infants <1 year of age, the normal dimensions of the heart cannot be applied to the above formula. The expected LVDd values acquired by the formula were rather larger than the actual data. We studied the relationship in terms of age [3, 4]. Other formulae were needed for infants <1 year of age and premature neonates separately. An inflection point appeared between the two regression lines at around the neonatal period.
The LVDd (Y) and body height (X) are best expressed linearly. The regression equations for the lines are as follows: Y (mm) = 0.495×X (cm) –5.43, for neonates including premature ones. Y (mm) = 0.352×X (cm) + 1.86, for infants excluding premature neonates [3]. These two regression equations were demonstrated to be statistically different [3]. The point of intersection between the lines denoting infants and premature neonates was calculated to be lying at 51 cm body height. However, it has not been investigated whether piecewise regression analysis is superior to other regression analyses, and it is unclear whether the body height at the inflection point of the two formulae has any meaning.
The following were the objectives of our study: (i) to verify the superiority of piecewise regression analysis using Akaike’s information criterion (AIC) [5]; (ii) to detect the inflection point of the two formulae by using two methods: the piecewise regression analysis proposed by Ryan et al., [6] and the change point regression analysis; and (iii) to interpret the meaning of the inflection point.
Materials and methods
Study design
To investigate the meaning of the inflection point that appeared around the neonatal period for the relation between LVDd and body height, LVDd was measured in premature neonates and infants with <75 cm body height. According to the results of a previous report, [3] the range of body height based on the sum of the square of the difference between the estimated and the measured data was calculated to be from 43 to 63 cm [1, 3].
Study subjects
The study subjects were examined at the Gifu Prefectural General Medical Center. We explained the aims of the study to the parents or guardians of the neonates, and received their signed permission. The ethics committee of Gifu Prefectural General Medical Center approved the examinations.
We considered neonates who met all of the following requirements to be “normal”: (i) appropriate weight for gestational age; (ii) no requirement for oxygen supplementation, respiratory, or circulatory support at examination; (iii) no problems in urination; and (iv) no congenital heart disease, with normal aortic and mitral valve function, and no evidence of coronary artery lesions.
The number of subjects was 421 (210 boys, 211 girls), with gestational ages of 24.0–41.9 (median 37.3) weeks. At examination, the body weight was 0.78–10.5 (median 4.0) kg, and the body height was 31.9–75.0 (median 52.1) cm.
Data acquisition
For two-dimensional echocardiography, a 12-5 MHz iE33 transducer (Philips Electronics, WA, USA) was employed during natural sleep or calm conditions. The examination was performed once in each subject.
One observer (H.N) took all the measurements. The echocardiography examinations were performed 421 times. The inner-observer error was <5%.
The subjects’ clinical data were collected from their outpatient or inpatient records. Body height (measured in the prone position) and body weight were measured at the time of echocardiography.
Statistical analyses
Akaike’s information criterion (AIC)
AIC is a statistical value to express the goodness-of-fit in a model, by imposing a penalty for increasing the number of parameters [5]. The value is competitive and follows the trend of the lower the value, the better of fit.
AIC is defined as follows:
AIC = (n, (2π, Sc . - /n) … +1 .) + 2, (p + 2 …), where n is the sample size, Sc is the sum of the square of the discrepancy between the estimated and true data, and p is the number of explanation variables.
Piecewise regression analysis
The piecewise regression analysis is a method to divide the data into two linear regression groups detecting a reflection point, as reported by Ryan et al., [6]. When a response, y, and an explanatory variable, x, have a different linear relationship, a single linear model cannot provide an adequate description. Piecewise regression linear analysis is a method that allows estimating an inflection point of the two formulae and produces regression equations. When there is one inflection point at x = c, the model can be shown as follows:
If the two regression functions are continuous at the inflection point, the value of y is equal at x = c.
Solve for a2 in terms of the others and replace a2 with the equation above:
Change point regression analysis
The change point regression analysis was used to determine the inflection point [7, 8]. This regression analysis is used to detect the accurate inflection point of two linear regression lines [7, 8]. The analysis procedures in this study were as follows: (i) sorting the LVDd data according to body height; (ii) dividing the data into two groups according to body height; (iii) generating a linear regression formula by using a calculation application in each group; (iv) calculating the square of the difference between the measured LVDd and the estimated normal LVDd calculated by using the above linear regression formula according to each subject’s body height; (v) summing all results of (iv); (vi) plotting a dot at the intersection of the divided point on body height (x-axis) and the sum (y-axis); (vii) adding points, moving the divided point of body height; and (viii) detecting the minimum point of the sum. The body height that indicates the lowest value of the sum is the inflection point of the two linear regression lines and is suspected to be the point of height change from the fetal period to the infantile period.
Results
The distribution of the relationship of the body height and LVDd is shown in Fig. 1. The value from the changing point regression analysis was lower (1299.96) than that from other regressions (1360.58 in Linear regression and 1309.49 in Quadratic regression), which means that the regression had a superior fit compared with the other regressions. The results of the two linear regression formulas by using the regression equations proposed by Ryan et al. are shown in Table 1. The change point was estimated as 51.7 cm body height, and the approximate 95% confidence interval of the change point was located between body heights of 49.3 and 54.1 cm.
Relationship between left ventricular end-diastolic diameter (LVDd) and body height. There is an inflection point. Application of two linear regression formulas to the data by using the regression equations proposed by Ryan et al. SE, standard error; CL, confidence limit; a1, intercept of linear fit to data below the estimated breakpoint; b1, slope of the linear fit to data below the estimated breakpoint; c, estimated breakpoint; b2, slope of the linear fit to data above the estimated breakpoint.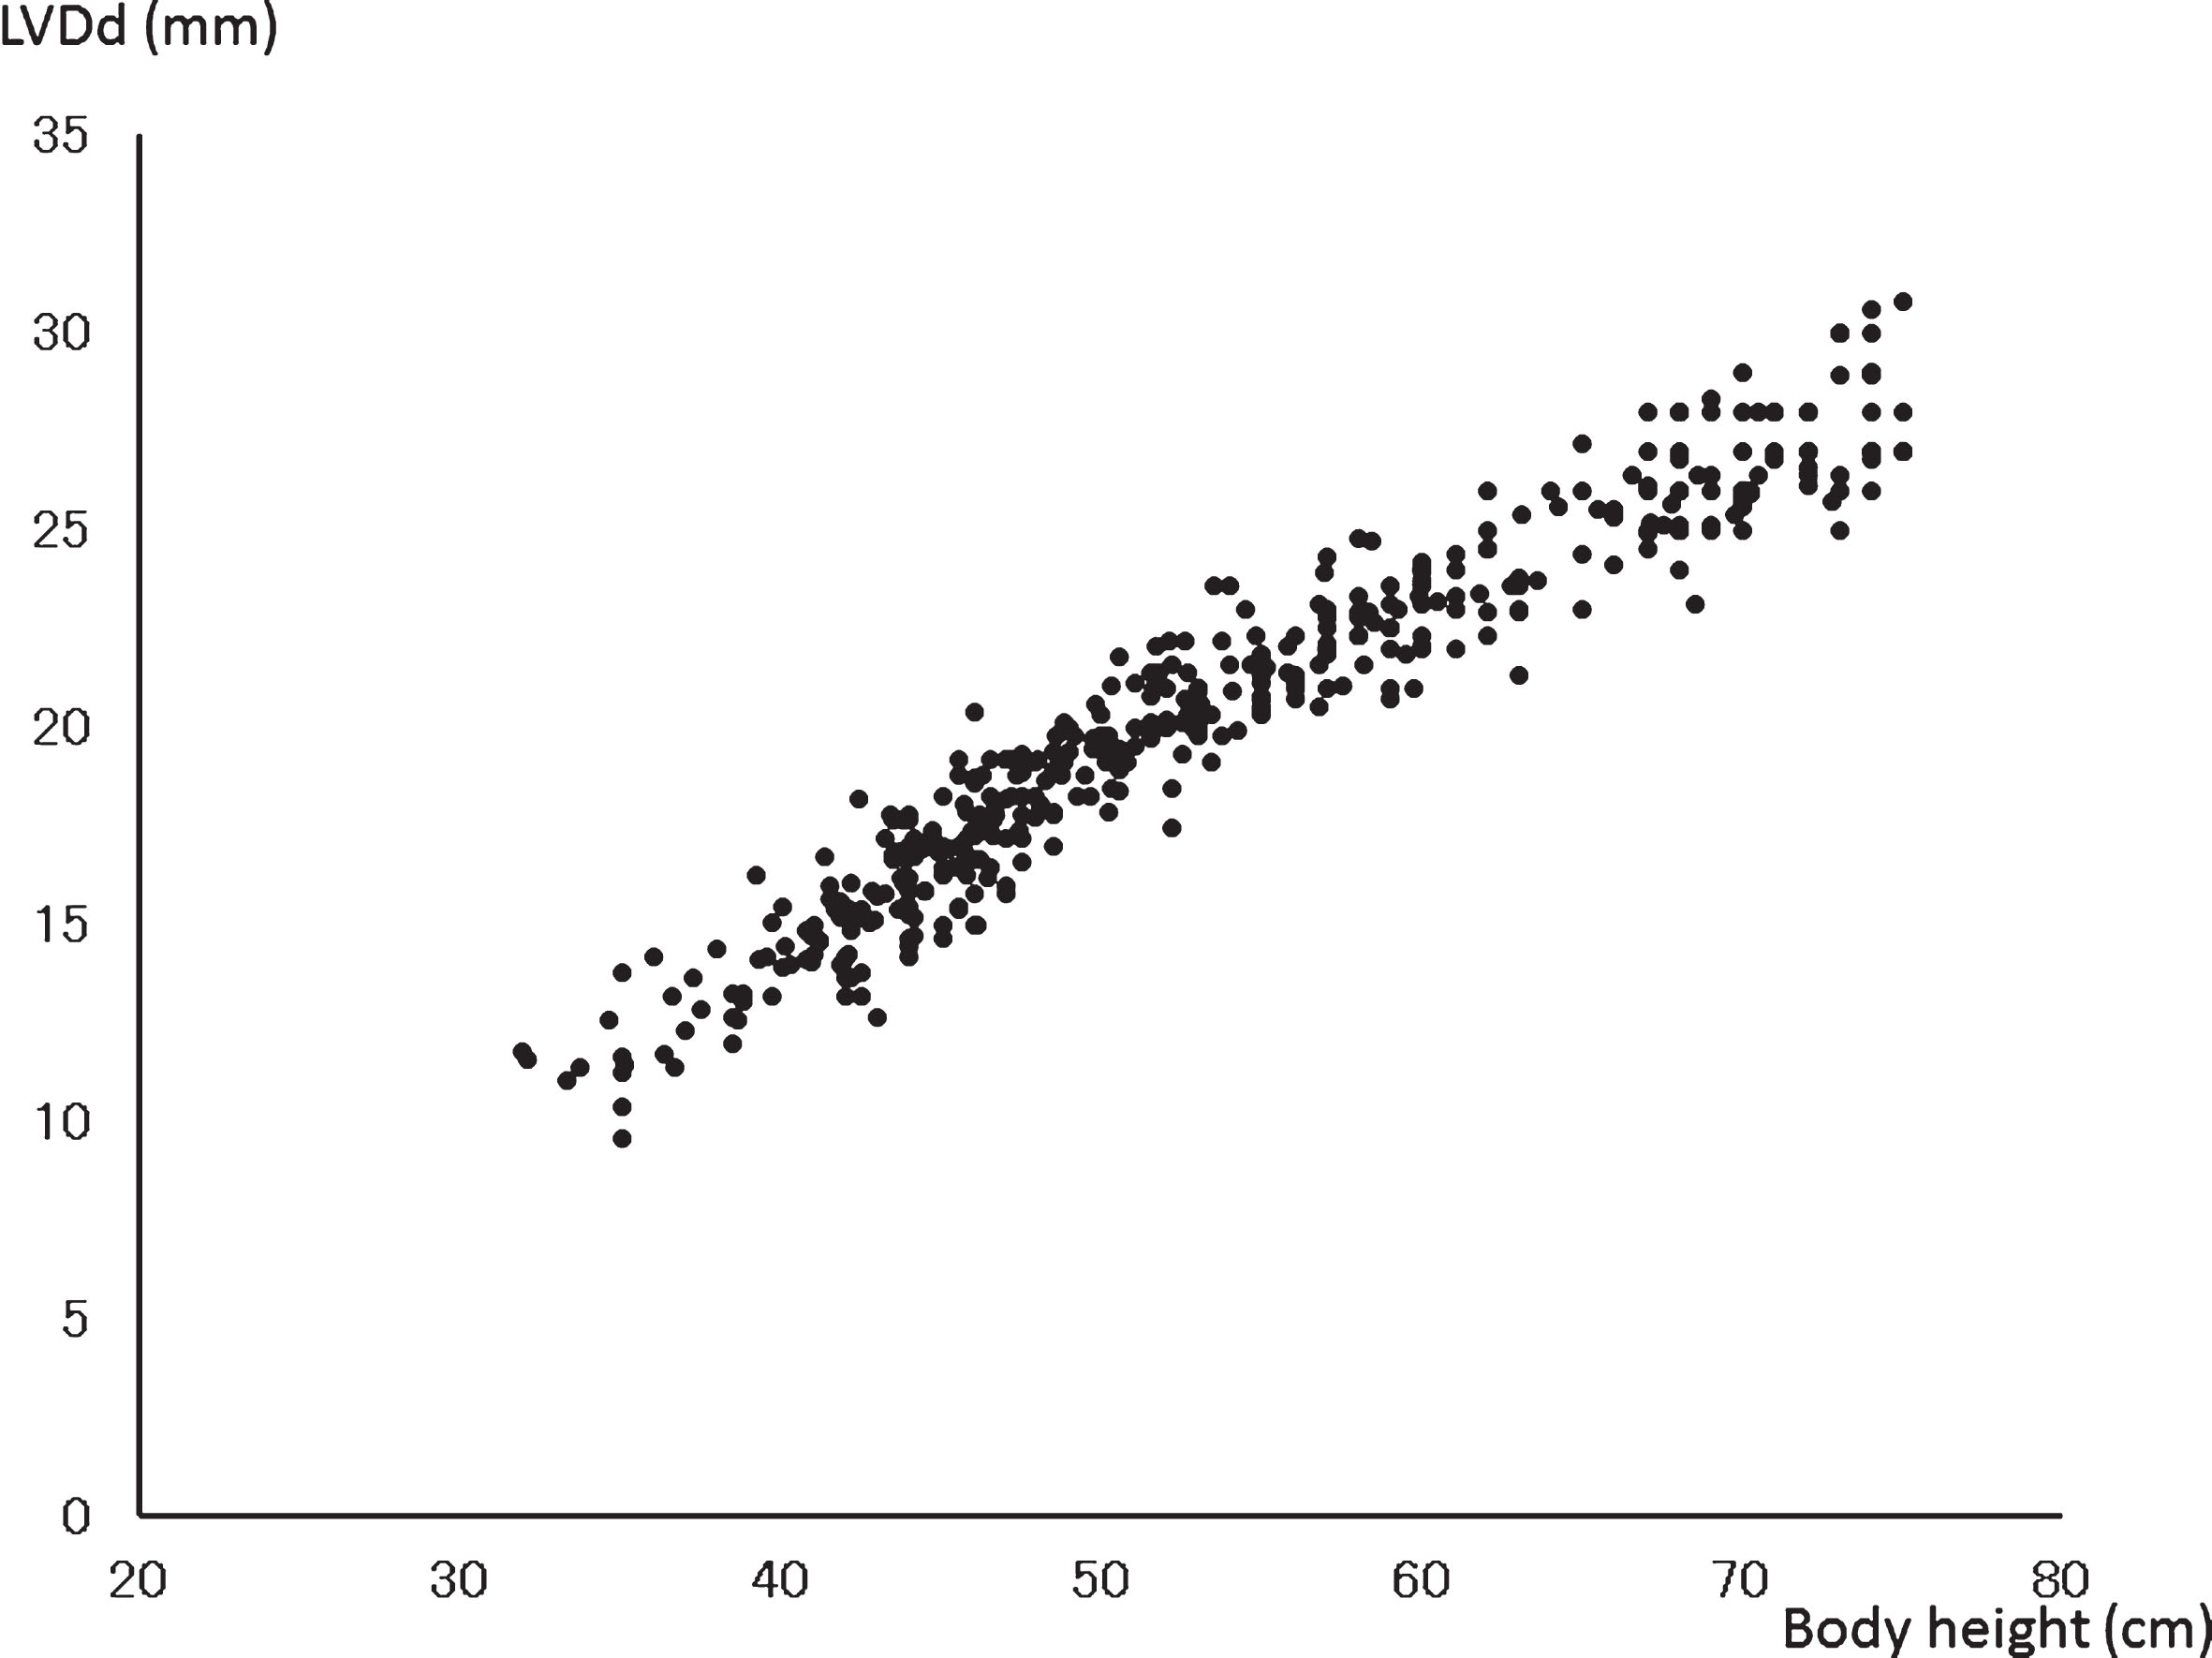
The result of the changing point regression analysis is shown in Fig. 2A. The figure shows a U-shaped graph; however, it had a rugged form that involved a small number of measured data at each body height. To reduce the influence of this feature, the moving average type method was applied to the result of the above analysis (Fig. 2B). A flat level was seen between body heights of 48 and 55 cm.
Results of the change point regression analysis. A, raw data; B, the moving-average-type method was used. There was no inflection point and a flat bottom appeared between 48 and 55 cm body heights.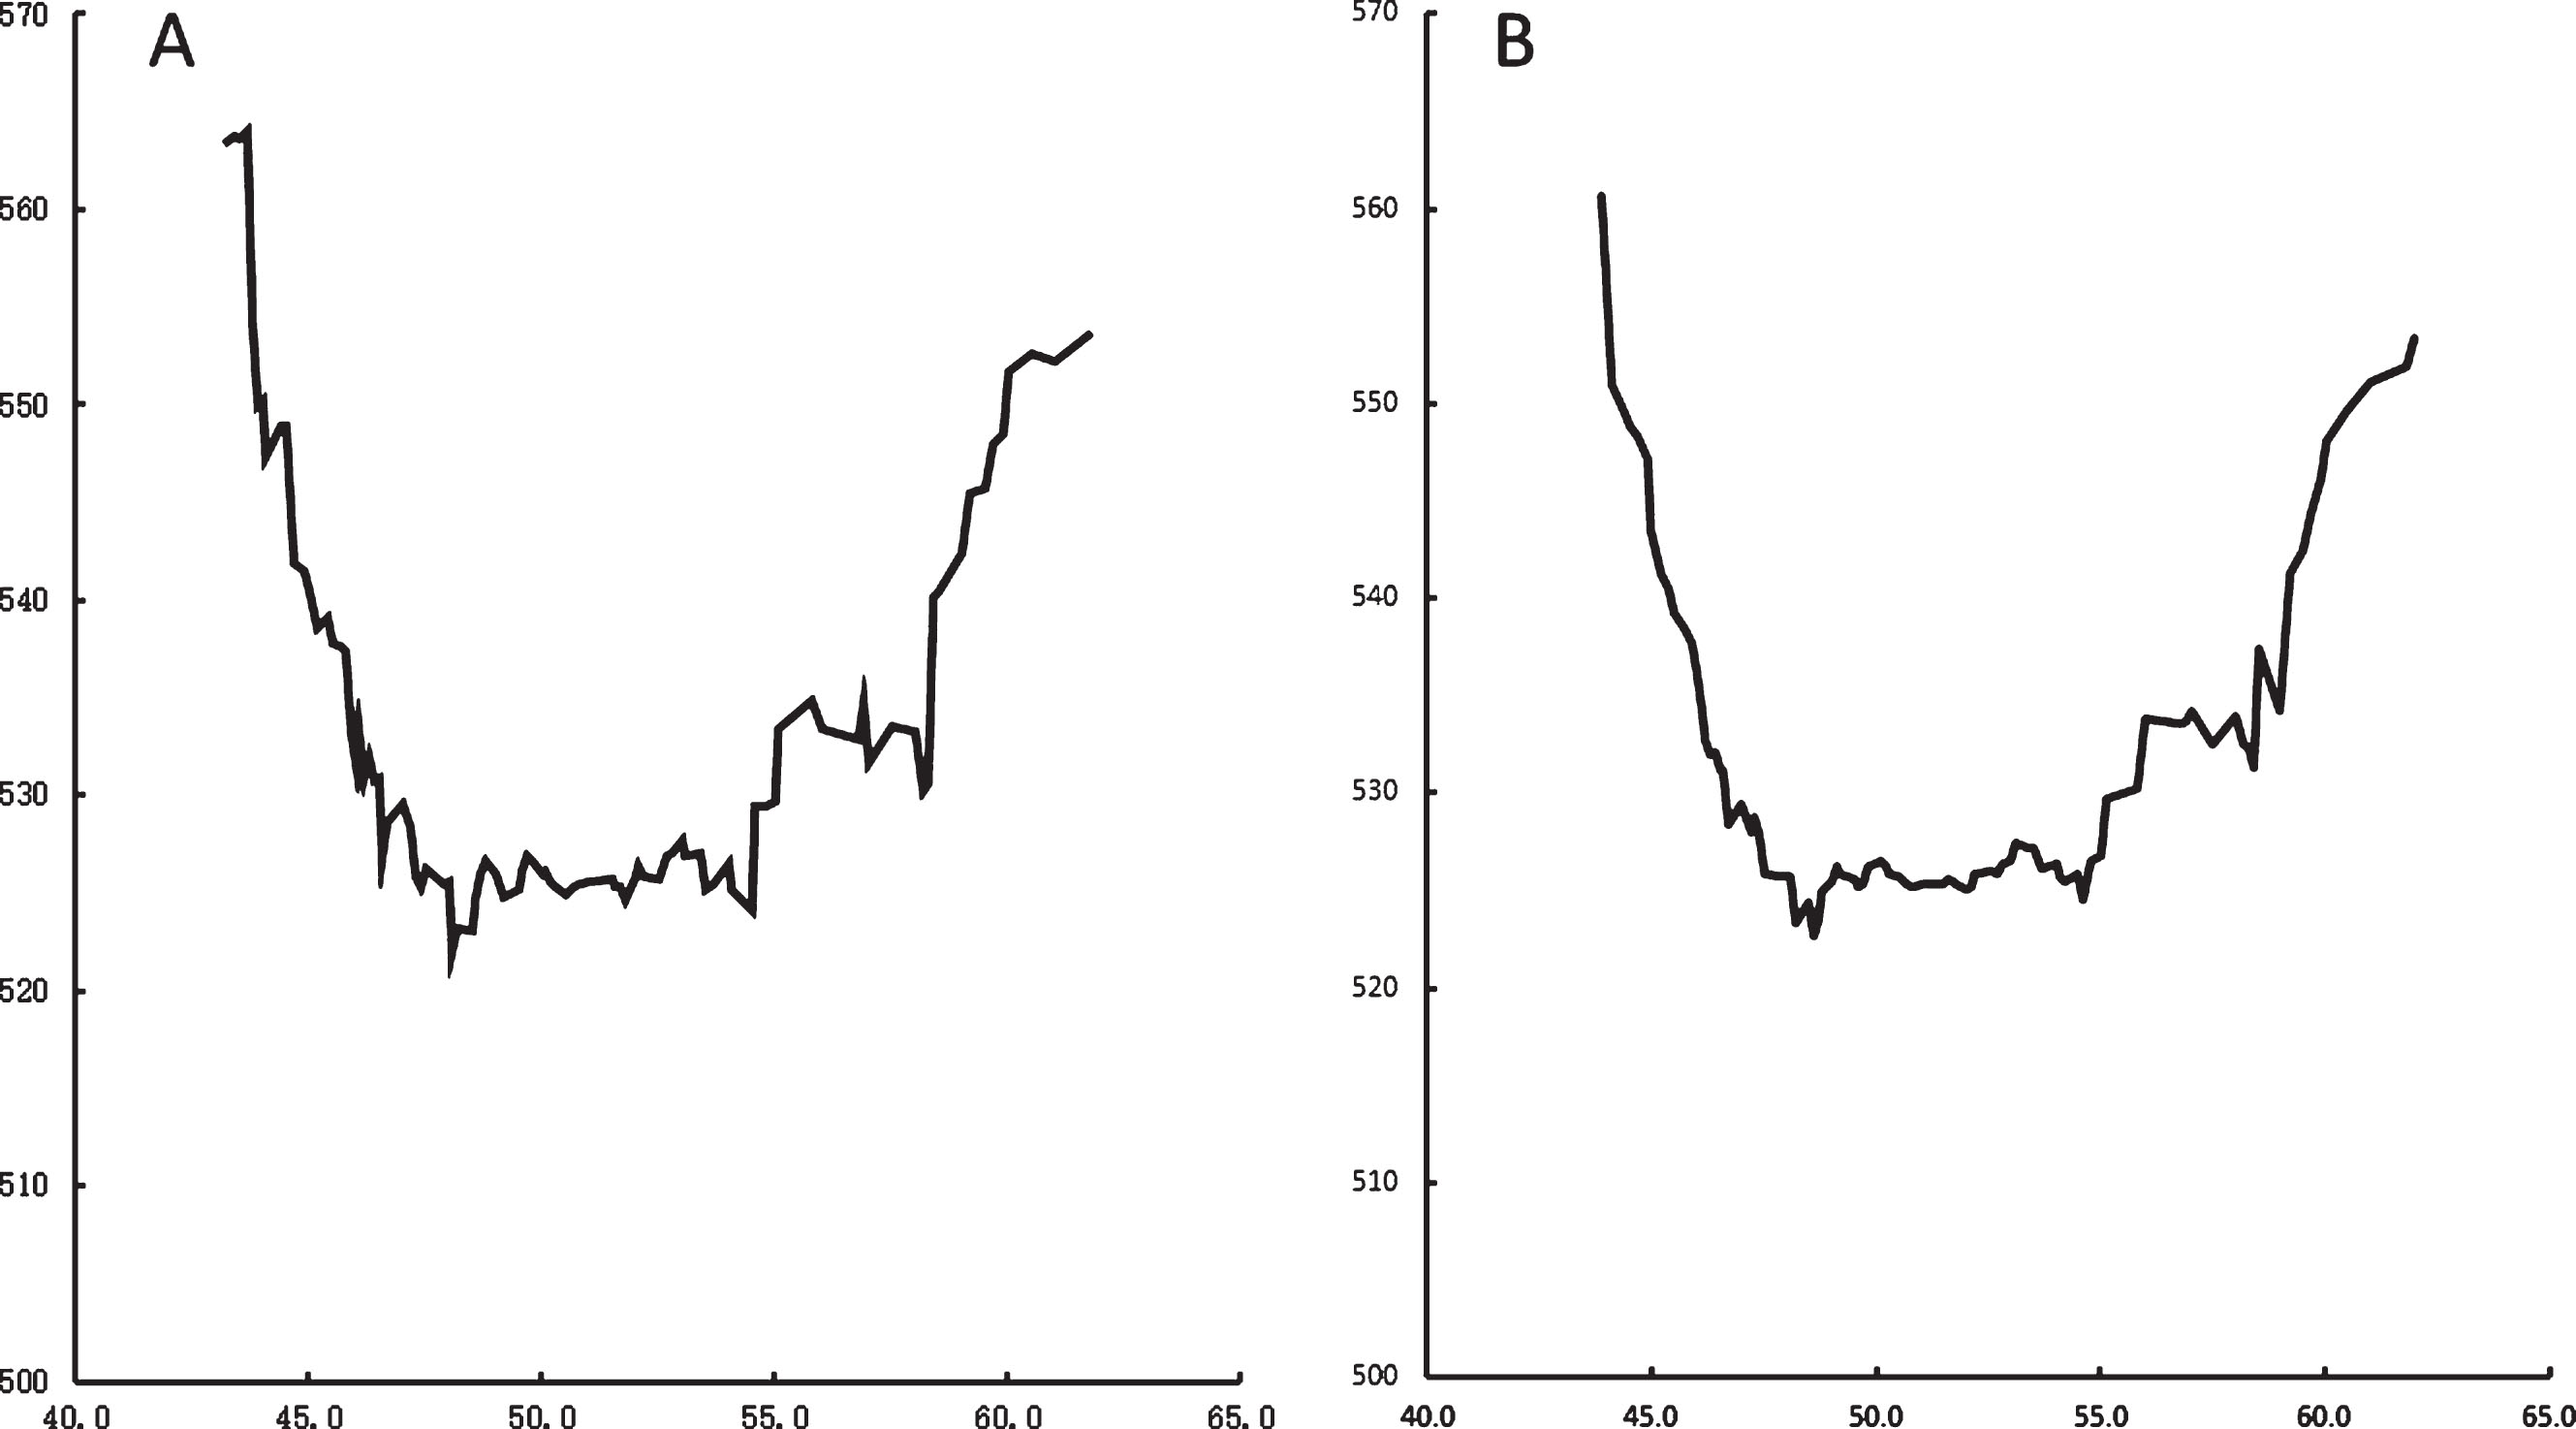
It is obvious that the neonatal period begins at birth. Then, when does the neonatal period end? It is defined as 28 days after birth. However, no studies have been done regarding this point on the scientific basis since nobody have thought the ground of the definition is indistinct. How can we define the neonatal period from a scientific point of view? This study may be the first to attempt to answer those questions from the viewpoint of the cardiovascular system.
We had reported regression equations that help identify normal development of the LVDd in premature neonates and infants by using body height as an index, by using two-dimensional echocardiography [3]. There was an inflection point in height at around the neonatal period (Fig. 1), however, the meaning of the inflection point has not been clear. It is presumed that the meaning of the point is related to the circulatory change from fetus to infant, as it is located around the body height at birth. If the inflection point (= body height) is confirmed, the equivalent age of the height comes to be both the end of the neonatal period and the beginning of the infantile one.
Meaning of the results
The way to find out the inflection point was as follows. To find out the best fit regression analysis for explaining the relationship between LVDd and body height. The AIC showed that piecewise regression analysis is the best one for explaining the relationship between them. The piecewise regression analysis revealed that the inflection point was estimated at 51.7 cm body height and the 95% confidence limit was between 49.3 and 54.1 cm. The age to reach 51.7 cm in average height was about 3 weeks. If the inflection point is defined as 95% of neonates reaching the body height of 51.7 cm, then this height corresponds to approximately 1.5 months (boys) to 2.0 months (girls) of age. Finding the inflection point of the two formulae with change point regression analysis. A V-shaped figure was presumed to appear in the relationship between body height and the sum of the square of the difference between the measured and estimated normal LVDds when using the change point regression analysis. However, the result revealed that there was no apparent inflection point. Instead, a flat bottom appeared between 48 and 55 cm body height. The meaning of this result was that there was no clear turning point. It is speculated that the circulatory change from the fetal period to the infantile period begins at birth; occurs constantly at a certain speed throughout in the mass; and finishes in all neonates when they reach 55 cm body height. The age when 95% neonates reach the body height of 55 cm is about 2 months.
Meaning of the absence of an inflection point
The neonatal period is defined as beginning at birth and ending at 28 days after birth [9–11]. It may be presumed that it takes around 1 month for neonates to reach a stable physical condition. However, we could not identify the medical or physiological reasons for the definition. It is obvious that 28 days are equivalent to 4 weeks [9]. A week is an artificial period distinct from a year, a month, or a day. The definition of the neonatal period may not be precise. Therefore, there may be no strict relation between the period of 28 days and the neonatal period. It is not true that neonates suddenly become infants when reach 28 days of age. In other words, the age of 27, 29, or 30 days after birth is acceptable for defining the neonatal period. On the other hand, the infantile period is known to exist, and it is true that there is a need for another regression equation for the relation between LVDd and body height for <1-year-old infants, distinct from that for premature neonates [3, 4]. Namely, the neonatal period is the period that connects the fetal and the infantile periods.
If we define the neonatal period as the time of the recovery from the radical change of the world of water (the sea) to that of air (the land), the time ends when the recovery from the transitional change finishes. This study revealed that the neonatal period might end when the body height of 55 cm is reached. If the end of the neonatal period is identified as the time at which 95% of neonates reach the infantile range (≥55 cm body height), then this period equates to about 2 months of age in boys and 2
Study limitations
The influences of gestational age at birth, equipment differences, racial difference, and inter-observer error in the measurement could not be excluded. The sex difference of the change point regression analysis was not exactly clear. The change point regression analysis curve was based on all subjects’ data and not on individual subject data. It is impossible to expect an exact change point time for each neonate.
Further study will be needed to confirm the results of this study, especially in relation to race and other physiological issues.
Conclusion
The results of this study showed that there was no inflection point but a flat bottom appeared between the two regression equations by using the change point regression analysis. This seemed to mean that neonates reach the infantile period slower than usually imagined, and that the end of the neonatal period may be at the age when the body height is around 55 cm - in other words, at 2 months after birth. This manuscript might be the first one to try to consider the definition of the neonatal period using cardiovascular methods.
Conflict of interest
The authors have no conflicts of interest to declare.
Funding statement
This research received no specific grant from any funding agency in the public, commercial, or not-for-profit sectors.
Disclosures
None.
Footnotes
Acknowledgments
We give special thanks to our colleagues, Yutaka Yamamoto, Masashi Kondo, Masami Sugawara, Toshinari Koyama, Daisuke Terazawa, and Ryosuke Miura, for their direct and indirect support for the echocardiographic examinations and analysis of the data.