
Abstract
BACKGROUND:
To date, there has been limited work evaluating the total cumulative effective radiation dose received by infants in the neonatal intensive care unit. Most previous publications report that the total radiation dose received falls within the safe limits but does not include all types of ionizing radiation studies typically performed on this vulnerable patient population. We aimed to provide an estimate of the cumulative effective ionizing radiation dose (cED) in microSieverts (μSv) received by premature infants ≤32 weeks from diagnostic studies performed throughout their NICU stay, and predictors of exposures.
METHODS:
Retrospective chart review from 2004–2011. Data included demographics, gestational age (GA), birth weight (BW), length of stay (LOS), clinical diagnosis, and radiological studies.
RESULTS:
1045 charts were reviewed. Median GA = 30.0 weeks (SD 2.7, range 22.0–32.6). Median BW = 1340.0 grams (SD 445.4, range 420–2470). Median number of radiographic studies = 9 (SD 28.5, range 0–210). Median cED = 162μSv (range 0–9248). The cED was positively associated with LOS (p < 0.001) and inversely correlated with GA (p < 0.001) and BW (p < 0.001). Infants with intestinal perforation had the highest median cED 1661μSv compared to 162μSv for others (p < 0.001).
CONCLUSION:
Our results provide an estimate of the cumulative effective radiation dose received by premature infants in a level 4 neonatal intensive care unit from all radiological studies involving ionizing radiation and identifies risk factors and predictors of such exposure. Radiation exposure in NICU is highest among the most premature and among infants who suffer from intestinal perforation.
Keywords
Abbreviations
Birth weight Bronchopulmonary dysplasia Computed radiographs Computed Tomography Cumulative effective radiation dose Extremely low birth weight Gestational age International Commission on Radiological Protection Intraventricular hemorrhage Length of stay MicroSieverts Necrotizing enterocolitis Neonatal Intensive Care Unit Periventricular leukomalacia Premature Retinopathy of prematurity
Introduction
There have been remarkable advances in the care of extremely premature (PT) and extremely low birth weight (ELBW) infants over the past few decades. These advances have led to a significant improvement in the survival rate of premature infants and a lowering of the age of viability to as early as 22 weeks gestation in most of the very specialized neonatal intensive care units worldwide. Unfortunately, premature infants typically have extended hospital stays and often suffer multiple medical and surgical complications of prematurity that are directly proportional to the degree of prematurity and birth weight [1]. A premature infant’s hospital course almost always includes exposure to ionizing radiation in the form of diagnostic imaging in order to help establish a diagnosis and to monitor for complications of prematurity. The growing use of ionizing radiation imaging procedures in the United States has raised concerns about radiation dose in the Neonatal Intensive Care Unit (NICU) given the stochastic no-threshold nature of radiation-induced carcinogenesis and genetic damage to premature infant’s cells [1–4]. In addition, there is a unique developmental effect from radiation exposure during early life that can hinder complete maturation or development of tissues or organs [4, 5].
There are, to date, no available long-term follow up clinical studies on this topic. In addition, the frequency of ionizing imaging procedures performed on NICU patients varies by medical practice patterns, hospital setting and by the acuity of the patient population. As such, an understanding of the total cumulative effective ionizing radiation dose (cED) may help justify policies and practice procedures moving forward. Our main objective was to provide an estimate of the total cED received by PT infants ≤32 weeks gestation from diagnostic imaging radiation studies performed throughout their hospital stay in a level IV NICU in the United States, and to explore potential risk factors and predictors of such exposure.
Methods
Human Investigation Committee approval was obtained for this study. The NICU at Yale-New Haven Children’s Hospital is a 54-bed level IV NICU, with approximately 800 to 900 NICU admissions per year. Data were collected retrospectively on all inborn infants who were ≤32 weeks gestation admitted to the NICU from 2004 to 2011. Subjects were identified through our NICU admission database. Data collection included demographics, gestational age (GA), birth weight (BW), sex, method of delivery, hospital course, problem list, length of stay (LOS) and all imaging studies involving ionizing radiation that were performed during their entire hospital stay. We excluded infants transferred to another hospital prior to readiness for hospital discharge due to the lack of details concerning diagnostic imaging radiation studies performed after transfer. We also excluded infants who did not survive to hospital discharge to avoid underestimating the radiation dose received by the infant cohort. Infants who required transfer to different services within the hospital, such as the surgical unit, Pediatric Intensive Care Unit, and the Respiratory Care Unit were included in the study until their first hospital discharge.
Diagnostic studies involving ionizing radiation performed during our study period included computed radiographs (CR) of chest, abdomen, skull, spine, pelvis, extremity, soft tissue, shunt series, and skeletal surveys. Computed Tomography (CT) scans of the brain, chest and abdomen were included. Fluoroscopy studies included: upper and lower gastrointestinal contrast studies, airway fluoroscopy, esophagogram, cystogram, fistulagram, and fluoroscopy for central line placement. Radioisotope scans of the lungs, thyroid, hepatobiliary, renal, and gastric emptying scans were included.
The effective dose is a measure designed to represent the overall stochastic effects of a radiation exposure and is calculated by applying a weighting factor to each exposed organ during the exposure, with radiosensitive organs (e.g. lungs, bone marrow, stomach, breast) receiving the highest weighting [6].
The estimated effective dose from each radiological study performed was obtained from the published literature [6–19] and used to calculate the cED for each infant (Table 1). The sum of radiation doses across all organs and tissue represents the total radiation dose to the exposed person. The literature, however, has limited or no references to the specific neonatal diagnostic procedures listed in Table I. For instance, pediatric nuclear medicine procedure guidelines [20] for injected doses are given for age groups from newborn to 5 years but not for neonates, so we used the recommended injection activities in the guidelines for newborns to calculate the effective doses for neonates and assumed an average of 1 kg neonatal weight. Comments in Table I explain how effective doses were calculated when a reference does not address the specific procedure in the list.
Estimated radiation dose for each type of image
Estimated radiation dose for each type of image
*Based on a 1 kg patient weight, 1.8 MBq/kG of Tc-99m pertechnitate and effective dose of 40μSv/ MBq. **Based on effective dose of 0.063μSv/MBq (UNSCEAR 2008), and the use of 20 MBq of Tc-99m MAA for small patient (range 20–40 MBq). ***Based on effective dose of 50μSv/MBq (UNSCEAR 2008), and the use of 3.7 MBq of Tc-99m sulfur colloid for small patient (range 3.7–7.4 MBq). ****Based on effective dose of 24μSv/MBq and the use of 15 MBq of Tc-99m disofenin for small patient (range 15–20 MBq). *****Based on effective dose of 22μSv/MBq (UNSCEAR 2008), and the use of 1.9 MBq/kg of Tc-99m MAG3 for small patient of 1 kg weight (Society of Nuclear Medicine 2008). ******Based on calculated effective doses using the technique chart for pediatric X-ray by Knight 2014 for different organs and Brindhaban et al 2015 estimated effective doses for newborn. Sample below:
Spearman’s correlation coefficient was used to examine the association of quantitative variables with cED while the Wilcoxon Rank-Sum test was used to compare the cED of patients with vs. without certain co-morbidities. These nonparametric methods were used because cED was not normally distributed. SAS version 9.4 (SAS Institute Inc.; Cary, North Carolina) was used for all data analysis. All variables exhibiting a statistically significant bivariate association with cED were initially included as candidate independent variables in the multiple linear regression model with cED as the response variable. Stepwise variable selection was performed with variables having a p-value less than 0.1 retained in the model at each step. A 5% significance level was used for all hypothesis tests. A Box-Cox [21] transformation was used to remedy regression assumption violations. A power analysis indicated that the 1045 study patients would provide 80% statistical power to detect a true correlation of r = 0.087 at the 5% significance level, which represents a “small” effect size according to Cohen’s conventional criteria [22]. Thus, this study was adequately powered to detect clinically meaningful associations with cED.
Results
A retrospective chart review was conducted on all infants ≤32 weeks gestation born at Yale University Hospital and admitted to the NICU from 2004 to 2011. A total of 1045 patients met our inclusion criteria.
The median GA for the study subjects was 30.0 weeks (SD = 2.7, range 22.0–32.6 weeks) and the median BW was 1340.0 grams (SD = 445.4, range 420–2470 grams). The ethnic representation of study subjects was 50% White, 31% African American, 16% Hispanic and 3% Asian. Fifty-three percent of our study patients were male, and 47% were female (Table 2). Clinical diagnoses included the common neonatal problems found in the NICU. Forty-eight percent of the patients had surfactant deficiency requiring surfactant administration, 33% had retinopathy of prematurity (ROP), 27% had an oxygen requirement at 36 weeks, 18% had neonatal sepsis, 15% had intraventricular hemorrhage (IVH), 8% had necrotizing enterocolitis (NEC), 2% had periventricular leukomalacia (PVL), and 2% had spontaneous intestinal perforation.
Patient characteristics
Patient characteristics
*Percentages do not add to 100% because some patients had multiple comorbidities.
There was a total of 22,117 images done on the 1,045 study patients, with an estimated sum total cED of 544,224μSv across all study patients. The vast majority (98%) of images were either chest or abdominal X-rays. Although chest X-rays accounted for 70% of the images done, they only constituted 41% of the total cED (Table 3). On the other hand, lower gastrointestinal contrast studies (Barium enemas) and upper gastrointestinal fluoroscopy images combined accounted for less than 1% of the images done, yet they represented 18% and 11% of the total cED, respectively.
Frequency and dosage of each type of image for the 22,117 images of the 1045 study patients
The number of radiographic studies per infant ranged from 0 –210 with a median of 9 images and a standard deviation of 28.5. The median total cED was 162μSv (range 0 –9248μSv). The distribution of the total cED was highly right-skewed due to the presence of high outliers (Fig. 1). The total cED exceeded 500μSv in 283 (27%) of patients and exceeded 1000μSv in 167 (16%) of patients. The cED was positively associated with length of stay (rs = 0.759, p < 0.001) as would be expected, but the cED was inversely correlated with GA (rs = –0.620, p < 0.001) and BW (rs = –0.599, p < 0.001). The median cED by GA was 1132μSv for GA 22–24 weeks, 462μSv for GA 25–28 weeks and 82μSv for GA 29–32 weeks.
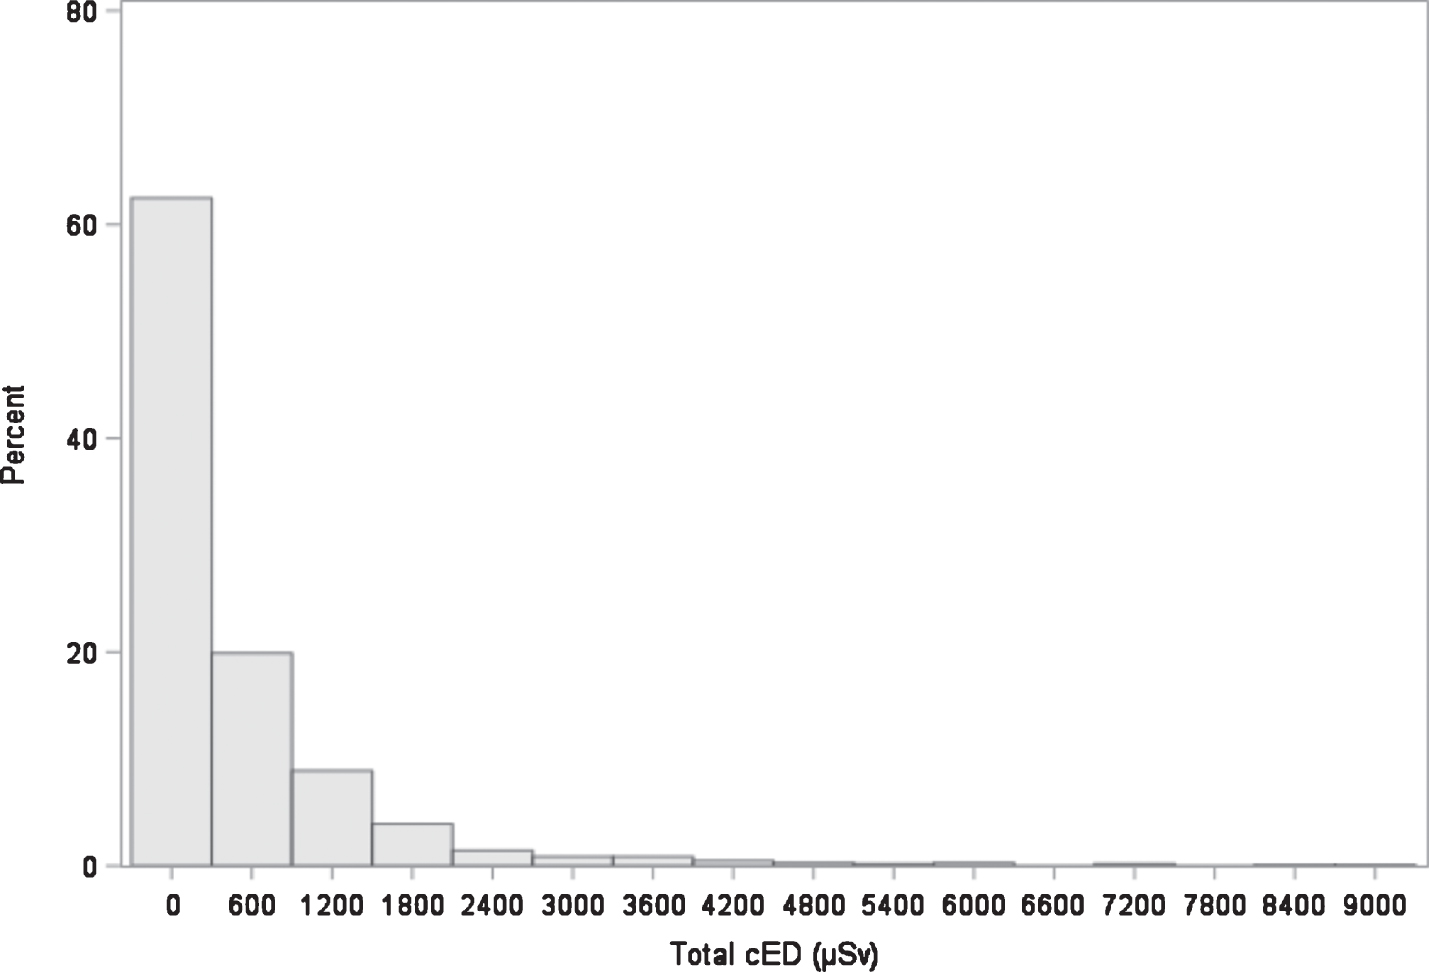
Distribution of the 1045 study patients’ total Cumulative effective radiation dose (cED) in microSieverts (μSv).
The median cED by co-morbidity was 434μSv for infants who received surfactant at any time vs. 71μSv for infants who did not (Z = 17.0, p < 0.001), and 714μSv for infants who received surfactant at the delivery room vs. 115μSv for infants who did not (Z = 12.8, p < 0.001). The median cED was 1,065μSv for infants with oxygen requirement at 36 weeks gestation vs. 119μSv for others (Z = 15.0, p < 0.001) and 1,233μSv for infants who received steroids for bronchopulmonary dysplasia (BPD) vs. 132μSv for others (Z = 12.4, p < 0.001). Infants who had NEC received a median cED of 1228μSv vs. 136μSv for those without NEC (Z = 10.0, p < 0.001), and 990μSv for infants who were diagnosed with PVL compared to 162μSv for others (Z = 3.7, p < 0.001). The median cED in infants diagnosed with sepsis was 607μSv vs. 72μSv for others (Z = 2.9, p = 0.002), 796μSv for infants diagnosed with ROP vs. 165μSv for others (Z = 13.8, p < 0.001), and 622μSv for infants with IVH compared to 164μSv for others (Z = 7.8, p < 0.001). The highest median cED was noted in infants diagnosed with intestinal perforation with a median cED of 1661μSv compared to 162μSv for others (Z = 10.0, p < 0.001).
Forty (3.8%) of our subjects had at least one CT scan during their hospital stay, of whom 32 (80%) had a CT scan of the brain, 8 (20%) had a CT scan of the chest, 3 (8%) had a CT scan of the abdomen and 3 (8%) had a CT scan of the neck.
For multiple linear regression analysis, the 13 initial candidate variables considered for inclusion in the regression model to predict cED were length of stay, GA, BW, surfactant at any time, surfactant at the delivery room, oxygen requirement at 36 weeks gestation, steroids for BPD, NEC, PVL, sepsis, ROP, IVH and intestinal perforation. After stepwise variable selection, the 7 variables remaining in the model were LOS, GA, oxygen requirement at 36 weeks, steroids for BPD, NEC, PVL and intestinal perforation. These 7 variables as a group exhibited statistically significant predictive accuracy (F7,931 = 128.1, p < 0.001) and explained 49.1% of the variation in cED. After controlling for the other variables in the regression model, each additional day of LOS increased the predicted cED by 10.7μSv (p < 0.001), and higher GA was associated with a higher predicted cED by 29.8μSv (p = 0.018). However, a highly significant inverse correlation between GA and LOS was noted (rs = –0.822, p < 0.001), so before interpreting the counter-intuitive positive association between GA and cED in this model, we should point out that a strong correlations between independent variables causes problems when fitting a multiple linear regression model.31 When LOS was removed from the regression model to address collinearity, the intuitive inverse relationship between GA and cED was manifested, with each additional week of gestational age resulting in a predicted decrease in cED of 70.0μSv, which was a highly significant negative association (p < 0.001). After controlling for the other variables in this regression model, infants requiring oxygen at 36 weeks GA had a predicted cED that was 605.1μSv higher than infants who did not require oxygen at 36 weeks GA (p < 0.001). Infants receiving steroids for BPD had a predicted cED that was 474.1.6μSv higher than infants not receiving steroids for BPD (p < 0.001). Infants with PVL had a predicted cED that was 471.4μSv higher than infants without PVL (p = 0.009). Infants with NEC had a predicted cED that was 1119.4μSv higher than infants without NEC (p < 0.001). Lastly, infants with intestinal perforation had a predicted cED that was 1273.9μSv higher infants without intestinal perforation (p < 0.001). However, examination of the residual quantile-quantile plot from the fitted regression model for regression diagnostics revealed that the residuals were not normally distributed, and the scatter plot of the residuals vs. predicted cED indicated marked heteroscedasticity, with larger errors as the predicted cED increased. In an effort to satisfy the linear regression assumptions of homoscedasticity and normally distributed errors, a Box-Cox analysis was performed to iteratively search for the optimal power transformation, which resulted in a transformation of cED1/4. When the regression model was refit using cED1/4 as the response variable, the model fit improved with the coefficient of determination increasing from R2 = 0.491 when using the untransformed cED as the response variable to R2 = 0.560 using cED1/4 as the response. In checking the linear regression assumptions, it was found that the quantile-quantile plot of the residuals was greatly improved after the transformation and the skewness coefficient went from a value of 2.835 for the untransformed cED to a value of 0.006 for the transformed cED1/4. (A normal distribution has a skewness coefficient of zero.) Likewise, the heterogeneity of the residuals did not increase with increasing values of the predicted cED after the transformation, as was the case before the transformation, thereby, indicating the assumption of homoscedasticity was satisfied. Multicollinearity was not an issue after the transformation, with the highest Variance Inflation Factor (VIF) value being 3.4, well below the threshold of 10 considered indicative of a problem [23], and none of the tolerance values were below 0.10 [24]. Steroids for BPD was no longer significantly associated with the cED received after the transformation, but the other predictors in the regression model were significant both before and after the transformation (Table 4).
Regression analysis results for models predicting untransformed and transformed cumulative effective radiation dose (cED) in microSieverts (μSv)
*Indicates a statistically significant association. †Removed from the untransformed regression model due to collinearity with gestational age.
There is growing concern for potentially significant public health problems accompanying the ever-increasing use of diagnostic imaging studies involving ionizing radiation in the expanding population of vulnerable preterm infants. As NICUs across the country increasingly care for a growing population of extremely premature patients, the use of diagnostic imaging procedures becomes inevitable to save infants’ lives. Unfortunately, the youngest most vulnerable preterm neonates are found to have the highest radiological exposure dose during the most sensitive time of their development. Although not entirely unexpected, this issue remains a grave concern for those of us caring for these patients.
Ionizing radiation exposure from medical procedures now represents the major source from which individuals in the USA are exposed [25, 26]. This is particularly so for premature infants who typically have extended stays in the neonatal intensive care unit. During this relatively short time they typically require multiple diagnostic imaging studies that involve ionizing radiation exposure such as CR, contrast studies and CT scans. The inherent vulnerability of premature infants to environmental insults, the higher radiosensitivity of their developing organ tissues, up to 15 times as radiosensitive to radiation as adults [27], their extended stay in the NICU and their longer lifespan following exposure all increase their risk from the cumulative effects of ionizing radiation exposure. In addition, their smaller size results in a higher exposure to the effective dose conversion factor per radiograph than older children or adults [28].
Ionizing radiation can cause DNA damage or cell death directly and indirectly via the formation of free radicals and damage to essential cell enzymes [29]. In addition, radiation exposure is a well-known inducer of cellular stress responses [30], and the capacity of these cell pathways to resolve damage in neonates is largely unknown.
The probability of occurrence of radiation side effects depends on the total radiation dose received over time, genetic predisposition and other environmental risk factors [27, 31]. The studies of atomic bomb survivors concluded that the risk of all solid cancers had a linear relationship with the radiation dose received and showed that children were much more radiosensitive than adults [31, 32].
Our results showed that the BW and GA are inversely correlated with cED, and the length of hospital stay is positively associated with the cED. In our regression model, each additional week of GA is negatively associated with the predicted cED, and each additional day of LOS increased the predicted cED. The co-morbidities with the highest estimated cED were intestinal perforation and NEC. Infants with intestinal perforation and NEC typically get subjected to serial X rays to monitor the progression of the disease, need for surgical intervention, or the resolution of radiological findings.
Our data simply highlights that radiation exposure in the NICU is highest among the most premature and the extremely low birth weight neonates, who are at the highest risk to suffer from the severe complications of prematurity and have the longest hospital stay. Only forty neonates (3.8% of our subjects) had one or more CT scans during their hospital stay, however, the cED of repeated exposures to relatively low dose CR studies equaled or exceeded that of a CT scan in 19 neonates (1.8% of patients), with a median GA of 30 weeks. The results raise a question of whether or not an acute exposure to relatively higher radiation doses from CT scans would have similar biological effects as frequent exposure to relatively low dose ionizing radiation from CR.
In the past, there has been only limited work undertaken on diagnostic radiation exposure to premature infants and of the few observational studies performed to date, most have concluded that the radiation dose received was in compliance with recommendations made by the Commission of European Communities and International Commission on Radiological Protection (ICRP) [1, 33].
Radiation exposure in the NICU is, of course, only the beginning of the radiation exposure those infants will receive during their lifetime. NICU graduates, especially those who suffer multiple complications during their NICU stay, often present to emergency rooms with ongoing problems such as acute life threatening events (ALTE), pneumonia, ventriculoperitoneal shunt complications, intestinal problems etc., requiring multiple additional ionizing radiation studies including frequent CT scans. It should also be borne in mind that doses associated with a given radiograph or CT scan may vary considerably between different protocols, machines, and institutions.
Adopting new imaging technologies and radiation dose managing methods will help reduce radiation doses. For instance, the use of specific pediatric and neonatal CT protocols at lower beam energy (kVp), tube current (mAs), higher pitch values and advanced reconstruction algorithms demonstrated tangible patient dose reduction [34]. The use of image gently recommendations specific to pediatric safety (www.imagegently.org) [35] with regard to gentle use of imaging have helped reduce pediatric doses. In general radiography, the use of tight collimation, and proper adjustment of kVp and mAs through auto-exposure methods should help lower doses as well.
Conclusion
Imaging procedures are the major source of ionizing radiation exposure to the premature neonatal population and have the potential, in certain patient groups, to result in high cED. Our data shows that this would appear to be increasingly the case in the NICU, and that this finding is most marked in extremely premature infants
The stochastic (neoplastic) effects of ionizing radiation exposure are believed not to have a dose threshold, i.e. the severity of the effect is independent of the dose, but the likelihood of their occurrence simply increases with increasing dose. It is important, therefore, to consider this when exposing infants to even a single low dose imaging study.
Without a doubt, diagnostic imaging studies can help save infants’ lives; nevertheless, radiation exposure should always operate under the “As Low As Reasonably Achievable” (ALARA) principle and the evaluation of the risk: benefit ratio should be continually applied in order to justify such exposures. As such, our data show that efforts to minimize ionizing radiation exposure in the NICU and further education as to the need to use non-ionizing radiation imaging studies (MRI or ultrasound) are warranted. Further investigation into the lifetime oncology risks in this relatively new group of PT and ELBW patients would be a fascinating realm for future research.
Funding Source
Dr. Khattab was supported by the National Institute of Child Health and Human Development (NICHD) grant number T32 HD 07094.
Disclosure Statement
All authors Dr. Khattab, Dr. Hagan, Dr. Staib, Dr. Mustafa, and Dr. Goodman have no financial disclosures or conflict of interest to disclose relevant to this study.
Footnotes
Acknowledgments
We would like to acknowledge and thank the staff of the NICU at Yale-New Haven Children’s Hospital for their efforts and dedication to this initiative.