



Abstract
BACKGROUND:
Mirror therapy (MT) has proven to be beneficial for treating patients suffering from motor aphasia after stroke. However, the impacts of MT on neuroplasticity remain unexplored.
OBJECTIVE:
In this paper we conducted a randomized controlled trial to evaluate the treatment using the MT on motor aphasia following acute cerebral infarction.
METHODS:
We randomly assigned 30 patients into test and control groups, with test group patients treated with MT, whereas control group patients were treated with sham MT. At 24 hours prior to and after the intervention, we obtained functional magnetic resonance imaging (fMRI) data from study subjects. At baseline, after treatment and 12-week follow-up, we additionally evaluated patients with the Modified Rankin Scale (mRS), the National Institutes of Health Stroke Scale (NIHSS), and the aphasia quotient (AQ) in the western aphasia test.
RESULTS:
After 2 weeks of treatment, the test group demonstrated significant improvements in AQ values, naming, repetition, spontaneous speech, and mRS scores compared to the control group (P < 0.05). Furthermore, in the follow-up time point (12 weeks), we found that the test group exhibited significantly better NIHSS scores and AQ evaluation indicators than the control group (P < 0.05). Specifically, the fMRI study shows that functional connectivity significantly improved in test group patients mainly among frontal, temporal, and parietal lobes of the left hemisphere with each other than controls group. Meanwhile, we found significantly enhanced functional connectivity with the hippocampus (P < 0.01).
CONCLUSIONS:
Our results indicate that the MT can expedite the recovery of language function during the early phases of stroke recovery. These findings may elucidate the underlying mechanism of MT and the application of this therapy as an adjunct rehabilitation technique in language recovery.
Keywords
Introduction
Motor aphasia is a common form of aphasia wherein patients experience difficulties in naming, spontaneously producing fluent language, and retelling information, even though their auditory comprehension skills remain largely intact (Brookshire & McNeil, 2014). Such motor aphasia generally results from damage to the anterior language areas in the left hemisphere of the brain (Peters, Liu, & Komiyama, 2017). Between one-third and one-half of these patients still suffer from language dysfunction at 6 months post-stroke (Zhang et al., 2018). Motor aphasia adversely affects the quality of life, work, communication skills, and lead to a higher incidence of depression in affected individuals (Kauhanen et al., 2000). However, treatment options for patients suffering from this condition remain relatively limited, such as language therapy and pharmaceutical interventions. Therefore, it is crucial to develop novel and effective approaches that can treat such language dysfunction.
The development of the mirror neuron (MN) theory is important in cognitive and brain science (Geiger et al., 2019; Hioka et al., 2019). There are many new rehabilitative therapy approaches, including action observation therapy (AOT), motor imagery therapy, mirror therapy (MT), virtual reality therapy, and brain-computer interface technologies, which have been developed to treat stroke patients based upon this theory (In, Lee, & Song, 2016; Pérez-Cruzado, Merchán-Baeza, González-Sánchez, & Cuesta-Vargas, 2017).
It has been shown that MT effectively improves upper limb motor functionality in patients suffering from stroke-induced hemiplegia and relieve pain in those affected by complex regional pain syndrome (CRPS) (Thieme et al., 2018). However, whether MT can improve functional deficits in patients being treated for aphasia remains unclear. AOT has been found to improve language function in individuals suffering from chronic language disorders (L. You et al., 2019); however, previous studies mainly focused on patients in the chronic phase of the disease. Meanwhile, few studies have reported MT approaches for treating patients suffering from motor aphasia following acute cerebral infarction. Besides, the neuroplasticity effects of this treatment have also not been thoroughly investigated.
However, while the effects of stroke-induced focal damage on language functions have been studied extensively, less is known about changes in network connectivity in aphasia patients (Pillay, Binder, Humphries, Gross, & Book, 2017; Ralph, Jefferies, Patterson, & Rogers, 2017). Previous studies have shown that post-stroke loss and recovery of brain functions dynamically evolve in time and space, arising from the natural history of local and remote pathophysiological changes and the structural and functional reorganization processes in the distributed network (Stockert, Kümmerer, & Saur, 2016). Several mechanisms govern language recovery, including reperfusion, recovery from diaschisis, recovery from structural disconnection, and reorganization such that other components can assume the functions of the damaged network components (Jarso et al., 2013). This reorganization depends on the language task in question, performance level, stroke size, site, and timing relative to assessment (Yehuda, Bierer, Pratchett, & Pelcovitz, 2010). Neuroplasticity is detectable in both perilesional and distal sites in the brain during both acute and chronic phases following the stroke, and accompany changes in functional connectivity (Sandvig, Augestad, Håberg, & Sandvig, 2018). Measuring the temporal coherence of slow intrinsic BOLD-signal fluctuations during rest allows the evaluation of regional interactions, termed resting-state functional connectivity (rsFC), between grey matter areas within the brain (Fox & Raichle, 2007). Besides, resting-state paradigms are easy to complete even for patients with severe aphasia or deficits in other domains especially in the acute stage, when tools to map the deficit and estimate the prognosis are needed. Therefore, this method has numerous clinical and scientific advantages and especially apply to aphasia patients (Klingbeil, Wawrzyniak, Stockert, & Saur, 2019). In this study, this imaging method was used to assess brain plasticity pre- and post-intervention. Therefore, we aim to evaluate the impact of such MT on language and neurological functional recovery in patients with motor aphasia following acute cerebral infarction, utilizing clinical, brain functional connection, and brain network topology attribute.
Participants and methods
Ethics
The Internal Review Board of The First Affiliated Hospital of Soochow University approved the current study (IRB No.2017–150), consistent with the Declaration of Helsinki. All patients have signed informed consent to participate. The relevant data and materials are stored and saved with the corresponding author and the Hospital medical affairs department and will be available upon reasonable request. All questionnaires used in this study are referenced both in the manuscript as well as in the supplementary files. The trial of this study was also registered in the Chinese Clinical Trial Registry (ChiCTR1900028518), which was reported following the guidelines of the Consolidated Standards of Reporting Trials (CONSORT) group. A flowchart describing participant selection and treatment is shown in Fig. 1

Consolidated Standards of Reporting Trials flow diagram.
Sample size calculation was based on one of the previous studies (W. Chen et al., 2019), a power analysis revealed the necessary sample size to be n = 13 per group to achieve a statistical power of at least 90% (α= 0.05). Considering the estimated loss rate 10–15%, the required sample size was not less than 29 patients.
Materials
•Participants
From 27 February to 9 November 2019, we recruited 40 consecutive stroke patients from our department suffering from motor aphasia. Ten patients had to be excluded and 30 patients were enrolled in the final statistical analysis. For the remaining 30 patients, 15 were in the test group and 15 were in the control group. The demographic information of these 30 patients is listed in Table 1.
Demographic and clinical characteristics of patients in two groups
Demographic and clinical characteristics of patients in two groups
The study inclusion criteria were: (1) patients have not suffered from a prior ischemic stroke; (2) patients presented within 2 weeks of symptom onset; (3) aphasia was diagnosed as per the Western Aphasia Battery (WAB) (aphasia quotient < 93.8) (Kertesz, 2006); (4) left hemisphere damage was detected via high-resolution imaging (lesion demarcation via DWI MRI); (5) patients were between the ages of 18 and 80 years old; (6) patients were right-handed as per the Edinburgh Handiness Inventory; (7) patients had not suffered from language dysfunction before aphasia onset; (8) patients did not exhibit and clear disturbances in memory, attention, or visuospatial function (non-language cognitive function assessment scale > 70); (9) patients exhibited sufficient auditory ability and endurance to complete a daily > 30-minute training task.
The exclusion guidelines were: (1) patients suffered a hemorrhagic stroke; (2) patients suffered from additional underlying neurological diseases; (3) patients exhibited moderate-to-severe dysarthria based upon Frenchay dysarthria scores; (4) patients exhibited severe language or oral/maxillofacial apraxia (W. Chen et al., 2019); (5) patients suffering from anxiety or depression as determined by the Hamilton Anxiety (Zimmerman et al., 2017) or Depression Scales (Kieslich da Silva et al., 2019), respectively; (6) patient suffered from evident dyssomnia or emotional disturbances; (7) patients exhibited a visual analog scale score of > 8 points (Koyuncu et al., 2016); (8) patients suffering from other diseases likely to affect their functional status, including severe lung or heart diseases; (9) patients who were taking antidepressants or benzodiazepines; (10) patients who were unable to undergo MRI due to contraindications.
Both groups consisted of 15 subjects each. The test group consisted of 9 males and 6 females (average age = 54.60 (47.75, 60.75) years) and the control group consisted of 8 males and 7 females (average age = 58.13(49.50,64. 50) years). We did not find any significant difference in age, gender, education, and prior history of stroke, heart disease, atrial fibrillation, hypertension, diabetes, or coronary heart disease between the two groups (P > 0.05).
•Clinical interventions
A computer-generated numerical table was used to randomly assign these 35 patients to test and control groups. Patients in the control group underwent sham MT and conventional language therapy, whereas those in the test group underwent both conventional language therapy and real MT. All treatments were performed on the 7th day post-stroke onset in all patients.
For MT training, we applied the wearable two-way audio and video data feedback training system [V1.0 mirror neuron rehabilitation training system (MNST—V1.0, Suzhou)] to allow the participants to freely observe the movement of the vocal organs such as chin, tongue and lips. This can help the participant master the correct vocal movements by imitating and gradually standardizing the vocal movements of the patients with motor aphasia. Moreover, this training system also contains 320 action videos on daily hand activities, and each relevant video was presented to patients in three forms. Initially, the mouth shape articulating the indicated action is shown to match the indicated gesture. Next, the gesture is performed with speech and then combine the mouth shape, speech, and gesture. Each action had a duration of 3 seconds such that each action video had a total 9-second duration. Actions included common activities such as making a phone call, blowing out candles, using a key to open a door, cutting a watermelon, or writing with a pen. Patients watched videos of the different difficulty level of movements according to their stage of rehabilitation. The patient had 30-minute treatment per day, and 5 days a week. The overall treatment period was two weeks. An example of MT can be seen in Fig. 2.
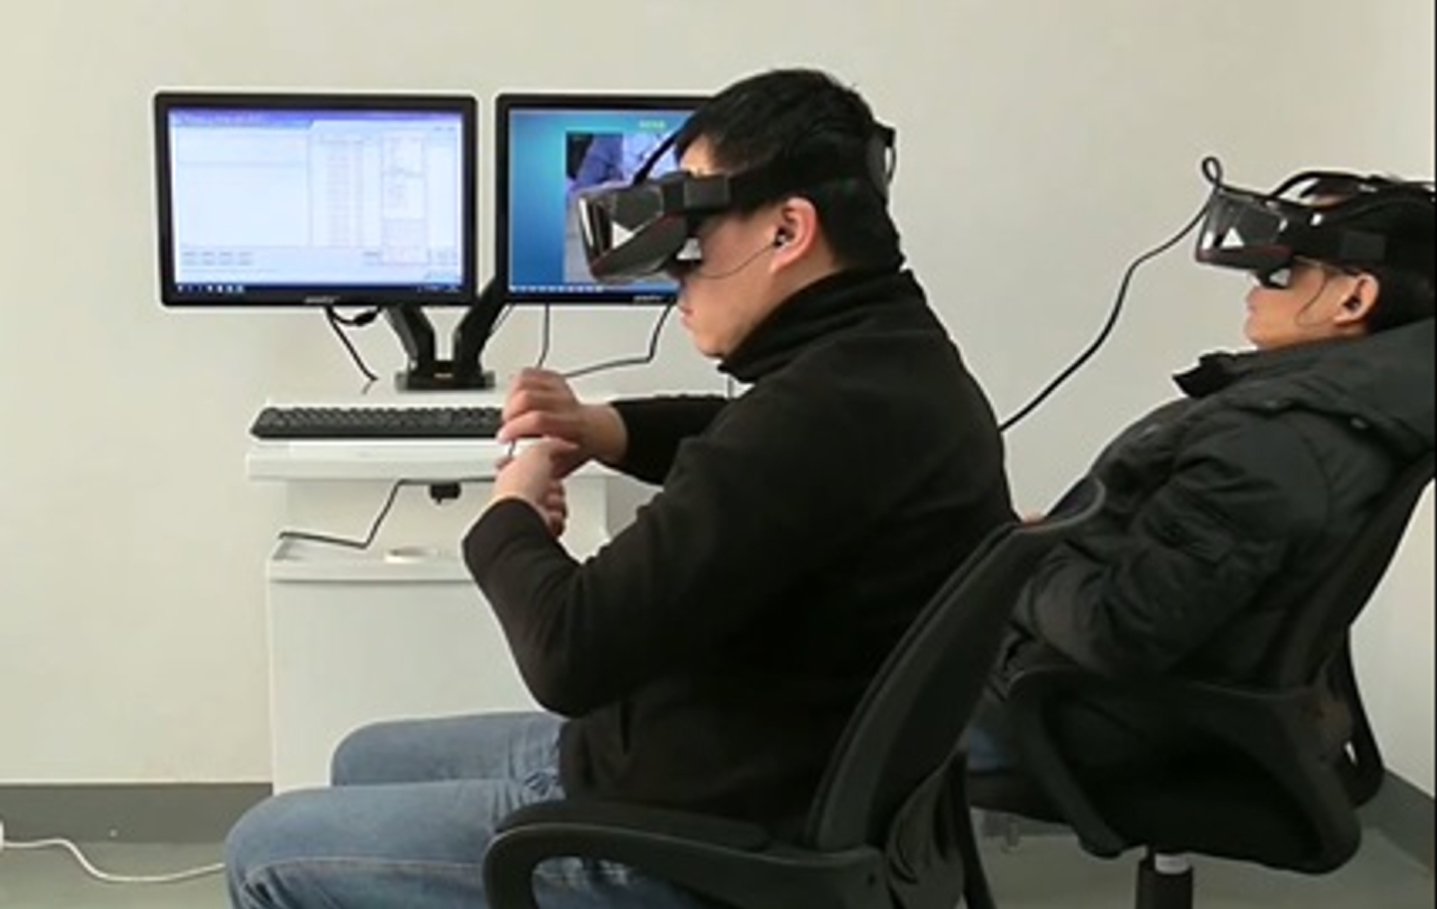
An example of mirror therapy.
For sham MT training, patients also performed the same training with the same duration; however, the nonreflecting side of the mirror was used; the therapist also reminded the patient to move their upper limb as in the mirror group.
For conventional language therapy, a treatment plan was developed based on the assessment of patient language function. One-on-one training was employed to teach speaking skills to all patients via various approaches, including Schuell’s stimulation approach, promoting aphasics’ communication effectiveness (PACE) therapy, and blockage removing technology. Patients practiced this training once daily for 30 minutes, 5 days per week.
•Follow-up
Following the Guidelines for the Clinical Management of Acute Stroke and Guidelines for Secondary Prevention, all patients were treated during the acute phase and were subject to secondary prevention. After completing experimentations, routine rehabilitative treatments were arranged for all patients based upon an endpoint functional evaluation. Besides, the follow-up details were collected during in-person visits after treatment and 12 weeks of disease.
•Clinical assessments
All patients were evaluated at baseline, after treatment and 12-week follow-up to evaluate the efficacy of therapeutic interventions. WAB scores can be used to evaluate language abilities based on the aphasia quotient (AQ) (Berthier et al., 2006; Ren et al., 2019), and assess (1) spontaneous speech, including both fluency and informational content; (2) auditory comprehension, including the ability to execute instructions, to respond to yes/no questions, and to perform listening identification tasks; (3) repetition; (4) naming, including both reaction and complete sentence naming. The final AQ score was determined as follows: AQ = (spontaneous speech + auditory comprehension/20 + repetition/10 + naming/10)×2 (Kertesz, 2006).
The neurological functions of patients were also evaluated using the National Institutes of Health Stroke Scale (NIHSS) and the modified Rankin Scale (mRS). Specifically, an increase of more than 30 points in AQ can be considered to have significantly improved language function (Y. Chen et al., 2010). Meanwhile, an mRS score of 0–2 means a good functional prognosis, and an mRS score of > 2 indicates poor functional prognosis. The primary outcome was the score on the AQ, and secondary outcomes included the other speech scores.
•Randomization and blinding methods
Enrolled patients were randomly allocated for testing (treated with a combination of MT and conventional language therapy) and control (treated with sham MT and conventional language therapy) groups. Treatment allocations were kept in sequentially numbered sealed opaque envelopes and opened only at the time of enrollment. All patients were blinded to treatment allocation. Clinical measures were evaluated by an experienced neurologist blinded to subjects’ group allocation. MT was performed by the investigator who was not involved in clinical assessment, follow-up of patients or data analysis.
•fMRI acquisition and preprocessing
A 3.0 Tesla Scanner (Philips Medical Systems Nederland B.V., The Netherlands) was used to conduct MRI scans in all patients at The First Affiliated Hospital of Soochow University Hospital. For fMRI, a gradient echo-planar imaging (EPI) sequence was employed, with the following parameters: TR 2000 ms, TE 30 ms, Slice thickness = 4 mm, Slice gap = 0.4 mm, flip angle = 90°, matrix = 64×64, FOV = 240 mm×240 mm, num of plies = 30, num of time points = 250. During scanning, patients were instructed to remain in a resting state and closed eyes.
Resting-state fMRI data were pre-processed with DPARSFA (Wei et al., 2016) based on the MATLAB 9.7 platform. We eliminated the first 10 time points for each patient to ensure stability, with the remaining 240-time points for analyses. Pre-processing steps included slice-trimming and realignment, with rotation and translation parameters set to be within 2° and 2 mm, respectively. The preprocessing works of spatial normalization and smoothing (FWHM = 8mm) were also conducted.
•Brain functional connectivity analysis
The AAL (Automated Anatomical Labeling) atlas was used for parceling brain regions. Initially, fMRI data were registered to an AAL template based upon FSL (Jenkinson, Beckmann, Behrens, Woolrich, & Smith, 2012)to extract regions of interest (ROIs). Means of voxels for certain 30 ROIs (Table 2) (Burns & Fahy, 2010; Cahana-Amitay & Albert, 2015; W.-L. Chen et al., 2019; Crinion & Leff, 2015; Sreedharan, Arun, Sylaja, Kesavadas, & Sitaram, 2019; Sreedharan, Chandran, et al., 2019; Tippett, 2015) that are associated with language processing were then calculated to establish an average time series for each ROI. Next, the relationship between the fMRI activation values for selected MRIs was also assessed using Pearson’s correlation analyses; after that, a 30x30 connection matrix was generated.
Motor aphasia-related network ROIs
Motor aphasia-related network ROIs
•Brain network functional connection global parameter analysis
Seven common global brain network parameters were calculated in the present study using Gretna toolkit (http://www.nitrc.org/projects/gretna): weighted clustering coefficient (C net ), weighted characteristic shortest path length (L net ), normalized weighted characteristic shortest path length (λ), normalized weighted clustering coefficient (γ), small-worldness properties (σ), global efficiency (E glob ), and local efficiency (E loc ). C net corresponds to the intensity of connections between nodes, whereas L net represents network information transfer capabilities. Besides, γ= C net /C rand , λ= L net /L rand , and σ=γ/λ, with C rand and L rand corresponding to weighted clustering coefficient and weighted characteristic shortest path length values for a random network, respectively. Generally, in networks that exhibit small-world properties, γ>1, λ ≈ 1 and σ >1. E glob corresponds to the speed at which information passes through this network, whereas E loc corresponds to sub-network information exchange abilities.
For each of these parameters, we calculated the area under the curve (AUC) that varies with sparsity to evaluate brain network topology without relying upon S. When S is between 0.05 and 0.5, the λ of a given brain functional connection network is approximately 1, whereas γ and σ are much higher than 1. Brain networks meeting these criteria exhibit typical small-world properties.
•Statistical analyses of clinical evaluation data
SPSS 22.0 (IBM Corp., Armonk, NY, USA) was used to analyze all clinical evaluation data for study patients. Data that were non-normally distributed were expressed as medians with inter-quartile ranges and were compared via the Mann-Whitney U test. Categorical data were tested using the chi-square test. P < 0.05 was the significance threshold for these analyses.
•Statistical analyses of brain network functional connectivity and global parameters
All functional connectivity analyses were conducted based on the Python v3.6 platform. Intra-group comparisons were made via paired t-tests, while differences between groups at follow-up time points were compared via covariance analyses to correct baseline differences. Pearson correlation coefficients were used for correlation analyses. We used the BrainNet Viewer (http://www.nitrc.org/projects/bnv) to present these results. The Pearson correlation was also calculated to analyze the relationship between FC changes (FC post- FC pre) -and AQ score changes (AQ post- AQ pre). All statistical analyses are two-sided with a P-value of less than 0.05 as the significant level.
Clinical assessments
After intervention and 12-week follow-up, all evaluation indicators, including AQ, spontaneous speech, auditory comprehension, repetition and naming, NIHSS scores, and mRS scores were improved in test group patients. On the other hand, only a subset of these parameters was improved in control group patients, including NIHSS and mRS scores after the intervention, and AQ, spontaneous speech, auditory comprehension, and NIHSS and mRS scores at 12-week follow-up, the difference was statistically significant (P < 0.05) (Table 3).
Comparison of baseline and post-treatment indicators in the two groups of patients
Comparison of baseline and post-treatment indicators in the two groups of patients
Following two weeks of treatment, AQ, spontaneous speech, repetition, naming, and mRS scores in the test group were significantly improved than those in the control group(P < 0.05) (Table 3). Moreover, while at 12-week follow-up all AQ evaluation indicators, including AQ, spontaneous speech, oral comprehension, repetition, and naming were significantly enhanced in the test group relative to the control group, as were NIHSS scores (P < 0.05) (Table 3). Speech improvements were also significantly better in the test group (90.0%) than the control group (12.5%) at the 12-week follow-up (P = 0.005) (Table 4).
Comparison of clinical improvement at the 12-week follow-up between two groups of patients
Relative to baseline, brain functional connectivity (FC) improved in the test group, with significant enhancement of the Left-hemisphere Precentral gyrus (PreCG.L) to Left-hemisphere Hippocampus (HIP.L), Left-hemisphere Superior frontal gyrus (SFGdor.L) to Right-hemisphere Hippocampus(HIP.R), Left-hemisphere Middle frontal gyrus(MFG.L) to HIP.L, HIP.L to Left-hemisphere Postcentral gyrus (PoCG.L), and HIP.L to Right-hemisphere Superior parietal gyrus (SPG.R) connections (P < 0.01) (Table 5 and Fig. 3). Besides, the FC network between Right-hemisphere Precentral gyrus (PreCG.R) to Right-hemisphere Postcentral gyrus (PoCG.R) was strengthened in the control group(P < 0.01) (Table 5 and Fig. 3) No significant differences in FC were observed between groups at baseline(P > 0.01), whereas after treatment Left-hemisphere Inferior frontal gyrus(ORBinf.L) to Right-hemisphere Middle frontal gyrus (MFG.R), ORBinf.L to HIP.L, HIP.L to Left-hemisphere Temporal pole: superior temporal gyrus(TPOsup.L), and Right-hemisphere Temporal pole: middle temporal gyrus(TPOmid.R) to Left-hemisphere Superior parietal gyrus (SPG.L) connectivity were more significantly strengthened in the test group than the control group(P < 0.01) (Table 5 and Fig. 3).
Comparison of FC values in two groups from baseline to post-intervention
Comparison of FC values in two groups from baseline to post-intervention
*p indicates a statistically significant difference at P < 0.01.

FC comparisons in both groups from baseline and following intervention. (A) Comparison of test group FC from baseline to after intervention; (B) Comparison of FC in the control group from baseline to after intervention; (C) Comparison of FC between groups after the intervention; FC, functional connectivity. Blue lines indicate significant differences in functional connections. Abbreviations: L, Left R, Right. See Table 2 for the brain region abbreviations.
The FC changes between Left Precentral gyrus and Left Hippocampus in test group was positively correlated with AQ scores changes(r = 0.621, p = 0.004; Fig. 4 (a)); The FC changes between Left Superior frontal gyrus, dorsolateral and Right Hippocampus in test group was positively correlated with AQ scores changes (r = 0.570, p = 0.008; Fig. 4 (b)). The FC changes between Left Hippocampus and Left Postcentral gyrus in test group was positively correlated with AQ scores changes (r = 0.526, p = 0.015; Fig. 4 (c)). The FC changes between Left Hippocampus and Right Superior frontal gyrus in test group was positively correlated with AQ scores changes (r = 0.632, p = 0.003; Fig. 4 (d)).
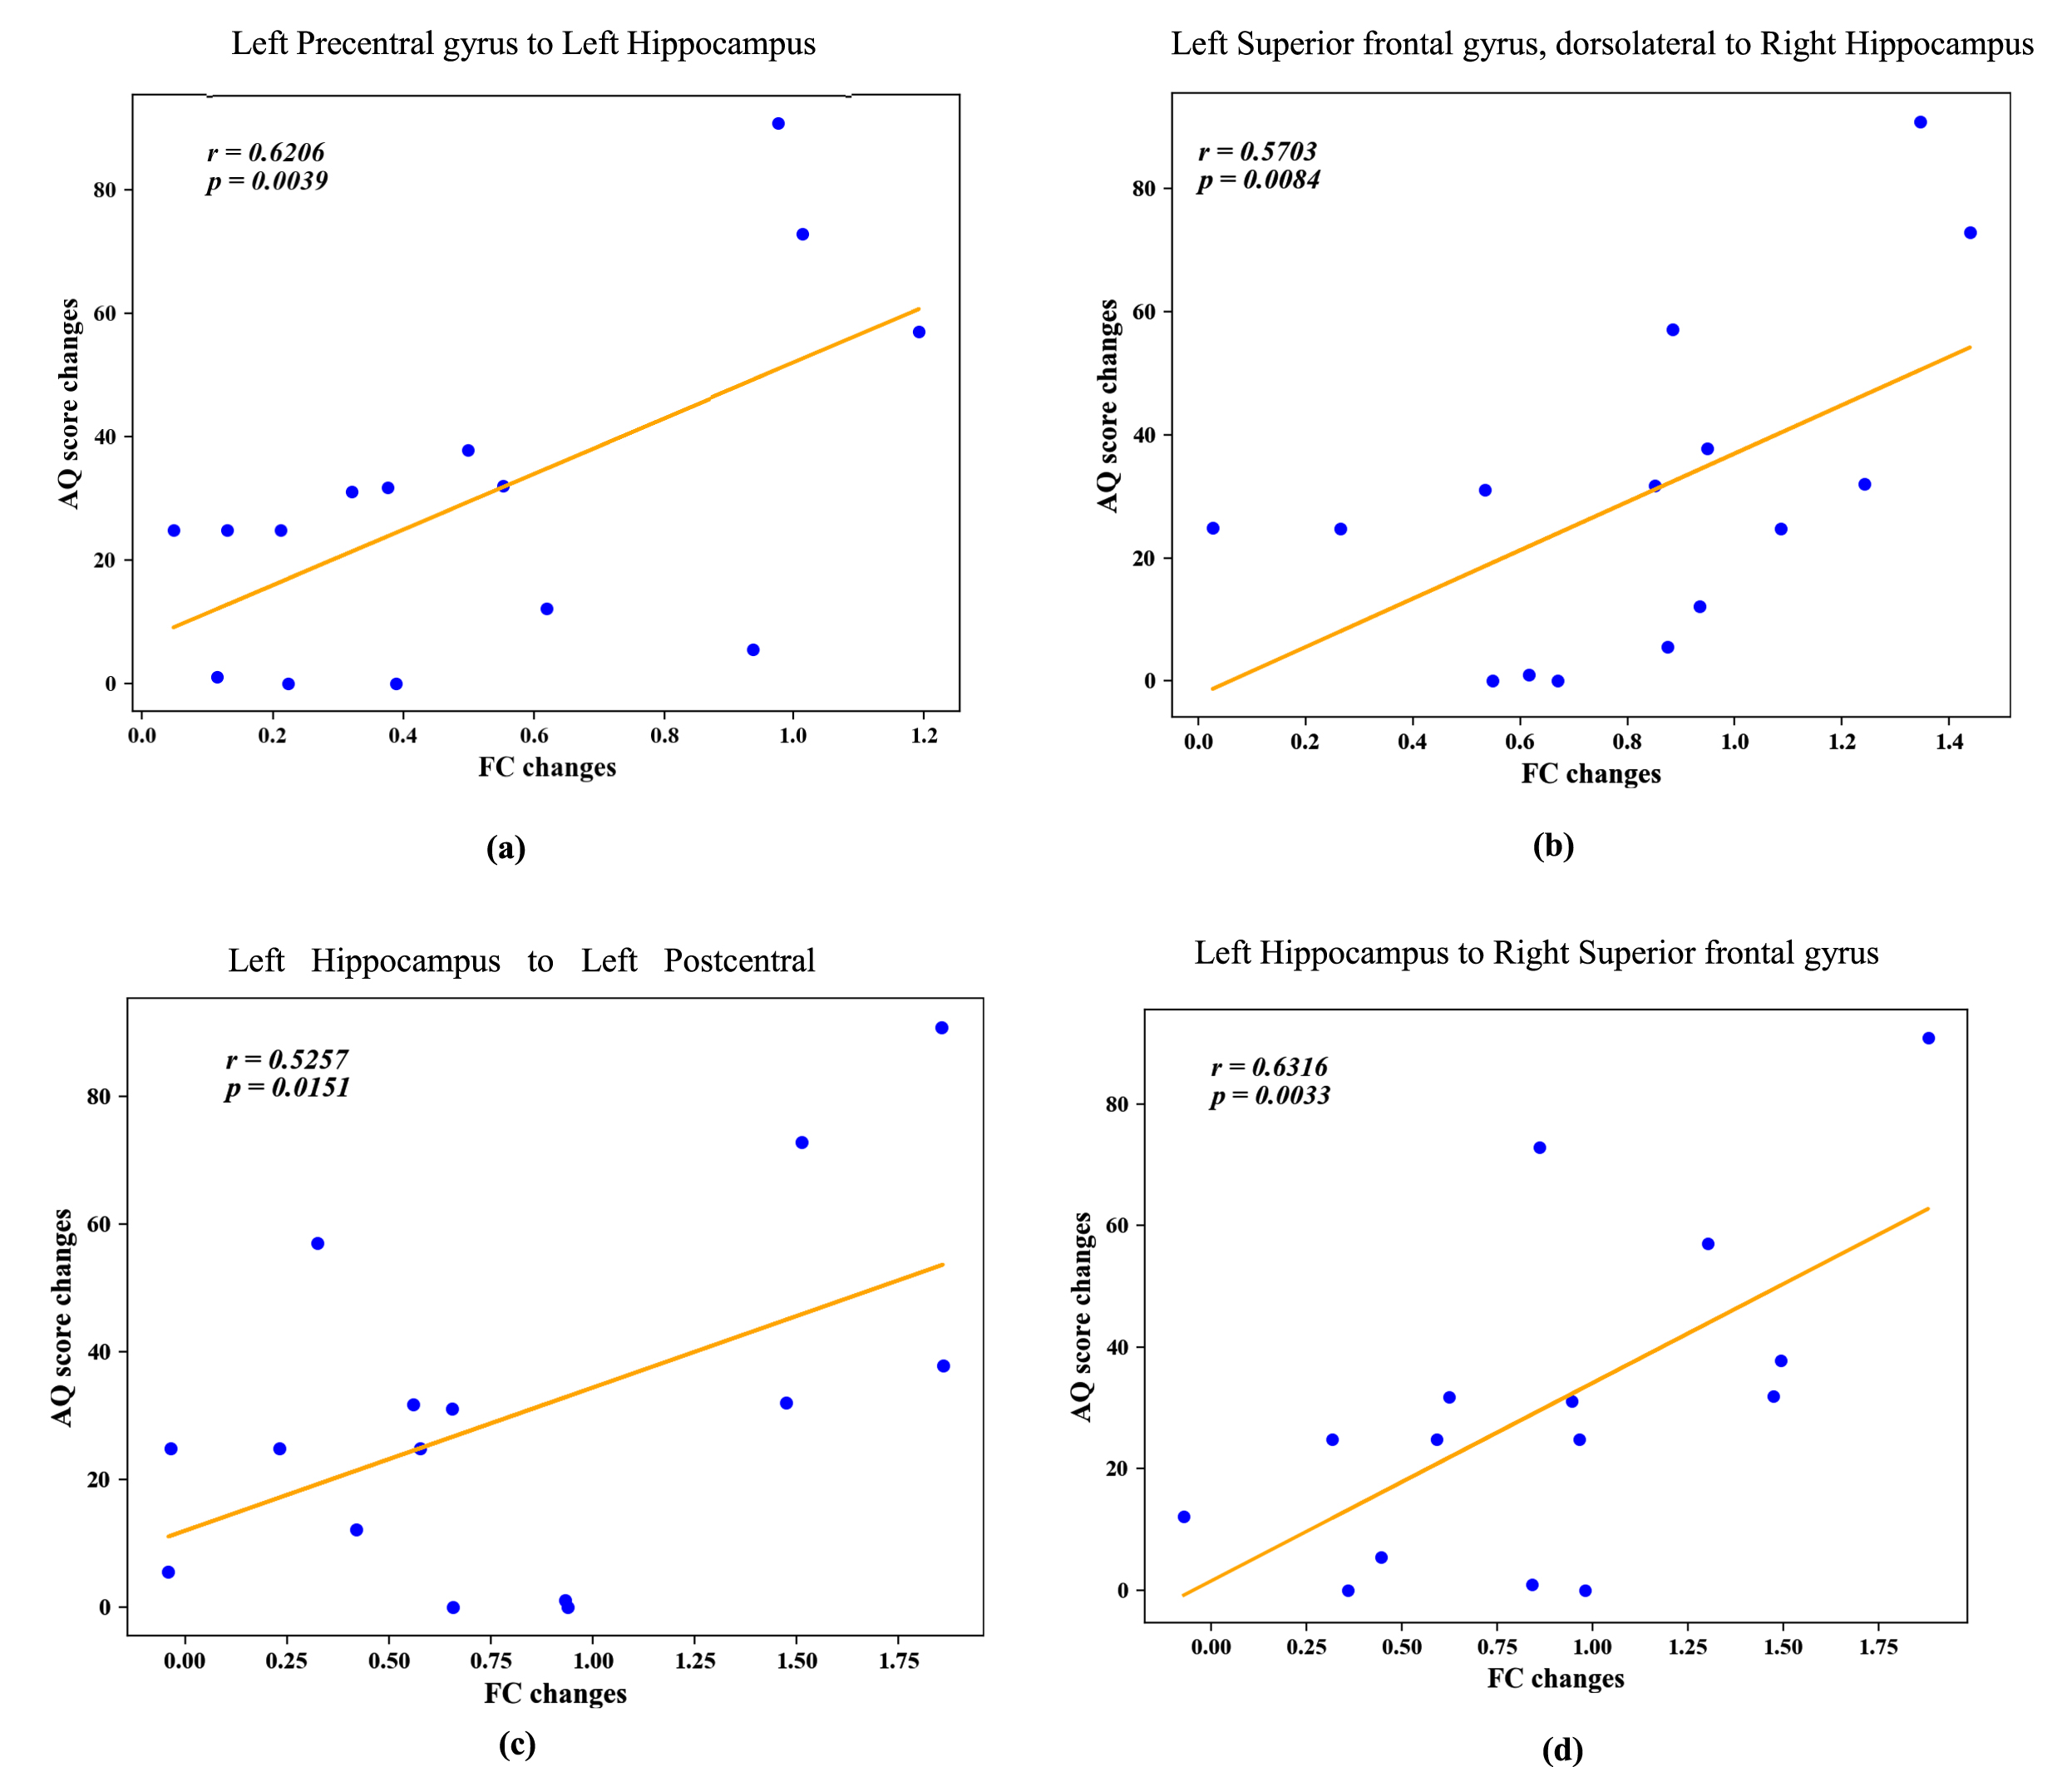
Correlation between FC changes and AQ scores changes in test group. FC changes = (FC post- FC pre); AQ scores changes = (AQ post- AQ pre) scores. (a)The FC changes between Left Precentral gyrus and Left Hippocampus in test group was positively correlated with AQ scores changes (r = 0.621, p = 0.004);(b)The FC changes between Left Superior frontal gyrus, dorsolateral and Right Hippocampus in test group was positively correlated with AQ scores changes (r = 0.570, p = 0.008);(c)The FC changes between Left Hippocampus and Left Postcentral gyrus in test group was positively correlated with AQ scores changes(r = 0.526, p = 0.015);(d)The FC changes between Left Hippocampus and Right Superior frontal gyrus in test group was positively correlated with AQ scores changes(r = 0.632, p = 0.003). Abbreviations: FC, functional connectivity; AQ, aphasia quotient.
Small-world properties were detected in the brain networks of patients in both groups pre- and post-treatment. Our result showed that S was in the 0.05–0.5 range, with λ being close to 1, and with γ and σ being significantly greater than 1. No significant differences in any of these parameters (C net , L net , γ, λ, σ, E glob , E loc ) were observed between groups before or after treatment (P > 0.05) (Table 6 and Fig. 5).
Comparison of global parameters of brain network functional connectivity between groups from baseline to post-intervention
Comparison of global parameters of brain network functional connectivity between groups from baseline to post-intervention

Changes in g, l, and s as a function of sparsity in the brain functional connectivity network. (a) When sparsity (S) was between 0.05 and 0.5, g and l both fell with increasing sparsity, and g is significantly greater than 1 while l is close to 1; (b) when sparsity was between 0.05 and 0.5, s decreases as sparsity rises but is always > 1. Abbreviations: T1, test group pre-treatment; T1f, test group post-treatment; C1, control group pre-treatment, C1f, control group post-treatment.
In this study, we investigated the effectiveness of MT on motor aphasia following acute cerebral infarction. We found that this combination of strategic training can significantly improve the patients’ language function. The mechanistic maybe not just linked to the improved frontal, temporal, and parietal lobes of the left hemisphere brain functional connectivity with each other, but also related to the enhanced functional connectivity with the hippocampus.
MT can improve the patients’ language function
Mirror neurons are those that lead people to mirror the behaviors of others, in which they are equally activated when a given action is performed or observed (Hioka et al., 2019; Shibata & Ogawa, 2018), through what has been termed an “action observation–action execution matching mechanism” (Farina, Borgnis, & Pozzo, 2020; Rizzolatti & Sinigaglia, 2010). Human mirror neurons are primarily found within the posterior portion of inferior frontal gyrus (Broca’s area), the ventral premotor cortex, the inferior portion of the precentral gyrus, the frontal portion of the inferior parietal lobule, the middle temporal gyrus, the anterior cingulated and prefrontal cortices, the insular cortex, and the amygdala (Fogassi & Ferrari, 2011). Mirror neurons play key cognitive functions, including empathy, imitation, comprehension, social cognition, intentional attunement, and theory of mind (Farina et al., 2020). Many recent studies have sought to employ mirror neuron theory to treat different forms of aphasia (W. Chen et al., 2015; W.L. Chen et al., 2019). In this study, we found that real MT significantly improve language function in stroke patients than sham MT, in line with the results of prior studies conducted in chronic stroke patients (Li You et al., 2019).
Moreover, standard physical and medical therapies were also conducted in all patients, and our results suggest that even in the absence of real MT, there are benefits to conventional language training in motor aphasia patients, as they exhibited treatment-related improvements in language function. Effective acute-stage rehabilitation can thus improve language functionality in motor aphasia patients following stroke, and these beneficial effects can persist for a minimum of 12 weeks.
The mechanistic of language function improvements by MT
The neuroplasticity mechanistic of language function improvements by MT is still unclear; therefore, we explored brain network alterations following MT training intervention. A recent study by Sandberg reports patterns of hypoconnectivity in 7 PWA in the chronic phase compared to 11 healthy controls. Their research revealed widespread decreases in interhemispheric and ipsilesional intrahemispheric connectivity in patients with aphasia (Sandberg, 2017). Previous studies have shown that brain impairments are expected to exist permanently, and patients are encouraged to make limited gains in function by training unspecified brain circuits, such as those increase communication efficacy (Aten, Caligiuri, & Holland, 1982). Therefore, the “brain repair” strategy emphasizes neurophysiological rehabilitation and aims to reactivate or repair damaged neural circuits (Small, Buccino, & Solodkin, 2013). In this study, we found that FC in interhemispheric and ipsilesional intrahemispheric connectivity increased following training, consistent with prior results (Sandberg, 2017; Sreedharan, Arun, et al., 2019; Sreedharan, Chandran, et al., 2019). Our study further confirmed a significant language–neural function connectivity correlation between FC changes and AQ improvement from baseline to post-intervention. It follows that enhanced FC in the stroke hemisphere is an important precondition for neural plasticity, which may allow the surviving neurons to reorganize in response to therapy. These results suggest that the MT is just one approach used in new models for neurological brain repair, suggesting that brain plasticity is a synaptic phenomenon that is largely stimulus-dependent and that brain repair requires both physical and behavioral interventions to rewire specific brain circuits (Johnston, 2009; Spitzer, 2012).
Prior studies reported that MT elicited more activation in mirror neuron system-related areas, including important language centers such as frontal, temporal, and parietal lobes, and motor cortex (W. Chen et al., 2015; W.L. Chen et al., 2019), and language-related brain region with left-lateralized (Sandberg, 2017). Consistent with these results, we found that the FC, mainly among the frontal, temporal, and parietal lobes of the left hemisphere, was superior in the MT group relative to the control group, suggesting that these connectivities were important for language network recovery. Interestingly, in the test group, we found that the FC changes between the motor cortex and language-related brain region positively correlated with changes in AQ scores changes, indicating that MT with the action-related video would be more useful to provide better plastic changes with the involvement of language-motor networks for the recovery of motor aphasia. Similar findings were found in the Gili study (Gili et al., 2017).
Meanwhile, we noticed that the increased FC between the hippocampus with language-related brain regions might be related to language function recovery following 2 weeks of MT combined with conventional language training in patients. Previous studies have provided ample evidence that the hippocampus is a structure that is most closely associated with learning and episodic memory (Menke et al., 2009). It is also the main node of the default network, and hippocampal integrity and that of the surrounding white matter may be vital to verbal learning (Goldenberg & Spatt, 1994; Meinzer et al., 2010). A recent study by Sandberg found numerous correlations between connectivity of the default mode network and aphasia severity(Sandberg, 2017). Our findings showed that enhanced FC between the hippocampus with language-related brain region following the MT intervention. Therefore, we speculated that the changes with hippocampal interactions could be one of the network mechanisms related to the after-effects of MT in language function recovery.
Brain network topology attributes
In this study, we analyzed the properties of brain topographic networks both before and after treatment in both patient groups. Our results suggest that there are small-world networks involved in regulating functional connectivity before and after treatment. Treatment was not associated with any damage to these networks in either group. No significant differences in these networks were observed between groups, although this may be due to the limited number of patients enrolled in this study, and these results must be interpreted with caution. Our results indicate that such networks are not damaged before or after treatment; however, further comparisons of local pre- and post-treatment parameters between these groups are required in future studies.
Technical considerations and study limitations
There are certain limitations to the present study. The small sample size and selected data analysis techniques limited the effectiveness of the current study. It is likely that expansion of patient samples in the future will help to clarify further whether subtle baseline differences (e.g. age, hypertension, diabetes, etc.) will exert an influence on our final research findings. Besides, patients’ expectations about undergoing a new treatment have the potential to influence differences in recovery rates in patient groups. It is also noteworthy that we did not utilize fMRI to assess the immediate effects of MT on the language cortex in treated patients, thus our data do not offer insights into the short-term effects of MT intervention on neuroplasticity in motor aphasia patients. Future studies should utilize functional imaging approaches and larger sample size to explore the immediate impacts of MT on language cortex plasticity in these patients to provide a theoretical basis for efficacious patient treatment.
Conclusions
In summary, the results of the present study demonstrate that MT training during the acute phase after stroke can facilitate the recovery of language function in motor aphasia patients. Interestingly, our results illustrated that this interventional approach significantly strengthened mainly among frontal, temporal, and parietal lobes of the left hemisphere brain functional connectivity. Most notably, these training sessions strengthened connections with the hippocampus. Together, our results offer strong robust multi-modal evidence that MT training can bolster language rehabilitation while shedding light on the underlying neuroplasticity mechanisms governing language recovery following stroke.
Footnotes
Acknowledgments
We wish to thank the Department of Radiology at The First Affiliated Hospital of Soochow University for the technical support provided in procuring of scans.
Author contributions
QF, LCZ and JK designed the study, interpreted the data and drafted the manuscript. QMC and HWS performed data acquisition. WJS performed data analysis. All authors approved the final version of the manuscript for publication, and agreed to be accountable.
Conflict of interest
None of the authors have any competing interests to report.
Funding
This work was supported by the National Key Research and Development Program of China (No. 2018YFC0116400), Social Development of Jiangsu Province (No. BE2016670), the National Nature Science Foundation of China (No. 81701669), the Nature Science Foundation of Jiangsu Province (No. BK20170368), the National Natural Science Foundation of China (No. 62001292), the Shanghai Pujiang Program (No. 19PJ1406800), and the Interdisciplinary Program of Shanghai JiaoTong University.