
Abstract
BACKGROUND:
Stroke is a major worldwide cause of serious long-term disability. Most previous studies addressing functional independence included only inpatients with limited follow-up.
OBJECTIVE:
To identify novel classes of patients having similar temporal patterns in motor functional independence and relate them to baseline clinical features.
METHODS:
Retrospective observational cohort study, data were obtained for n = 428 adult patients with ischemic stroke admitted to rehabilitation (March 2005–March 2020), including baseline clinical features and follow-ups of motor Functional Independence Measure (mFIM) categorized as poor, fair or good. Growth mixture models (GMMs) were fitted to identify classes of patients with similar mFIM trajectories.
RESULTS:
GMM identified three classes of trajectories (1,664 mFIM assessments):
C1 (11.2 %), 97.9% having poor admission mFIM, at 4.93 years 61.1% still poor, with the largest percentage of hypertension, neglect, dysphagia, diabetes and dyslipidemia of all three classes.
C2 (23.1%), 99% had poor admission mFIM, 25% poor discharge mFIM, the largest percentage of aphasia and greatest mFIM gain, at 4.93 years only 6.2% still poor.
C3 (65.7%) the youngest, lowest NIHSS, 37.7% poor admission mFIM, 73% good discharge mFIM, only 4.6% poor discharge mFIM, 90% good at 4.93 years.
CONCLUSIONS:
GMM identified novel motor functional classes characterized by baseline features.
Keywords
Introduction
Stroke is a major worldwide cause of serious long-term disability (Lanas et al., 2021). Maintaining functional independence in activities of daily living has been previously reported as a relevant factor for preserving the Health Related Quality of Life and physical Quality of Life of stroke survivors (Vincent-Onabajo et al., 2015; White et al., 2016; De Wit et al., 2017). As recently reported, data on the long-term evolution of poststroke functional outcome is limited (Rejno et al., 2019). Previous studies have identified demographic and stroke-specific characteristics that are associated with functional independence after stroke (Pan et al., 2008; Glymour et al., 2007). How-ever, most of these studies have included only hospitalized patients with limited follow-up, only few of them examining predictors of functional status with long-term follow-up (Dhamoon et al., 2009).
Rejno and colleages (Rejno et al., 2019) recently remarked that despite stable proportions of ADL dependency among stroke survivors at different time points after stroke, transitions between ADL independence and dependency occur up to 5 years after injury, indicating that the chronic phase after stroke is not static. The gap of knowledge with respect to the long-term course of functional outcomes after stroke is an obstacle for delivering adequate care and support to stroke survivors. If disability during the chronic state after stroke is not stable, it may also be modifiable (Rejno et al., 2019).
Furthermore, longitudinal datasets are prone to high amounts of missing data, mainly due to attrition (for example, subjects drop-ping out) (Ribeiro et al., 2021).The use of latent variables to model a quantity that is not directly observed comes from the field of psychology and social sciences (developmental trajectories) (Nagin et al., 1999). Latent class modelling are statistical models which include random variables that cannot be directly observed. They are highly flexible, capable to deal with a variety of complexities, such as missing data. At least three measurement time points are recommended in related methodological reviews for proper models’ estimation (Nguena et al., 2020). Individuals are assigned to latent trajectory subgroups on the basis of their observed behaviours. Each subgroup is composed of individuals with relatively similar observations/scores on observed behaviours.
Three latent class approaches are identified in the literature to be suitable for longitudinal data: growth mixture modeling (GMM), group-based trajectory models (GBTM), and latent transition analysis (LTA) (Nguena et al., 2020).
GMM have been recently applied to latent trajectories subgroups analysis in several chronic conditions such as heart failure (Masterson et al., 2014), pain (Pagé et al., 2015), depression (McDevitt-Petrovic et al., 2020) or dermatomyositis (Deakin et al., 2021).
To the best of our knowledge neither latent class modelling in general nor GMM in particular have been previously applied to the analysis of functionality trajectories after stroke. Besides, associations between factors for ischemic stroke and clinical outcomes have been analyzed predominantly in older rather than younger patients (Lutski et al., 2017). Incidence rates of ischemic stroke have increased in adults aged 55 years and under in the United States (Ramirez et al., 2016) and in Europe (Tibaek et al., 2016).
Preliminary data screening performed in our sample showed a mean age at the moment of injury younger than the usually reported mean age in long-term functional independence studies (Rejno et al., 2019), the inclusion of scarcely reported factors to describe long-term motor functional independence led us to hypothesize that functioning trajectories characterized by baseline clinical factors for our population of young adults could be identified, adding to the literature.
The aims of this study were to use GMM analysis to identify classes of patients with ischemic stroke with different trajectories of motor functional independence up to 5 years after injury and to characterize the identified classes with baseline clinical factors, using data from a rehabilitation center.
Clinical factors used to characterize classes were identified in previous research reporting on motor functional independence after stroke, such as severity (NIHSS) (Hiraga et al., 2018), gender or age (Scrutinio et al., 2020), infarct localization (Sommer et al., 2018), neglect (Scruitinio et al., 2017), atrial fibrillation (Khedr et al., 2020) aphasia (Gialanella et al., 2016), dysphagia (Pekacka-Egli et al., 2021), body mass index (MacDonald et al., 2020), dominant hand affected (Harris et al., 2006), diabetes and dyslipidemia (Lau et al., 2018).
Methods
Study design
The data that support the findings of this study are available from the corresponding author upon reasonable request. We conducted a retrospective observational cohort study enrolling subacute is-chemic patients admitted to the Rehabilitation Unit of the Acquired Brain Injury Department of Institut Guttmann Hospital de Neurorehabilitació. Recruitment period was from March 2005 to March 2020. This study conforms to the STROBE Guidelines (“Strengthening the Reporting of Observational Studies in Epidemiology”) (STROBE, 2021).
Participants and setting
Eligible participants were adult patients (≥18 years at the moment of admission, no other age restriction was imposed to participants) with the diagnosis of first-time ischemic stroke, receiving inpatient rehabilitation between March 2005 and March 2020.
Patients were excluded for the following reasons: less than 3 functional assessments (admission, discharge and first follow up), more than 90 days since stroke onset to inpatient rehabilitation admission, cases of transient ischemic attack or subarachnoid hemorrhage, diagnosis of stroke in the context of another concomitant comorbidity (e.g. traumatic brain injury) and a previous history of another disabling condition.
Functional assessments
The Functional Independence Measure (FIM) (Granger et al., 1993) was used as functional assessment tool in this study. It is routinely administered within 24 hours after inpatient admission by trained and certified evaluators of the physical medicine and rehabilitation unit.
FIM gain was defined as the difference between FIM at admission and FIM at discharge. FIM efficiency was defined as FIM gain divided by length of stay (LOS) and FIM effectiveness as: (final score-initial score)/ (maximum score-initial score) x100 (Tokunaga et al., 2017).
To facilitate analysis of outcomes FIM motor scores were categorized into 3 levels as in related research (Brock et al., 2007; Scruitinio et al., 2020): good, fair, and poor outcomes. A “good” outcome was defined as a patient achieving a FIM motor score of 65 or above (maximum, 91). With a score of 65, patients usually require either supervision or minimal assistance with mobility and self-care, indicating that the patient’ physical care requirements for daily activities are minimal. Scores above 46 indicate some improvement (fair outcome) and scores under 46 indicate a large physical burden of care at discharge (poor outcome).
Clinical variables
The following data was abstracted from the hospital’s electronical health records (EHRs): demographics (such as age, sex, education and marital status); stroke severity, using the National Institutes of Health Stroke Scale (NIHSS) and the location of stroke, classified using the Oxfordshire Community Stroke Project (Bamford et al., 1991) as total anterior circulation infarcts (TACI), partial anterior circulation infarcts (PACI), lacunar circulation infarcts (LACI) and posterior circulation infarcts (POCI). Stroke related risk factors, comorbidities and medical complications, such as diabetes, dysphagia, hypertension, body mass index, atrial fibrillation, reported in EHRs using ICD9 codes were also collected.
Rehabilitation program
All patients admitted at the rehabilitation unit are referred from different acute care setting hospitals and fulfill the hospital criteria for admission which include SMART (Specific, Measurable, Achievable, Relevant and Time-bound) objectives and social support for discharge in case of severe disability. The rehabilitation program includes five hours of intensive treatment oriented towards cognitive, swallowing, behavioural and physical problems as well as training in activities of daily life living. Variables related to the rehabilitation program such as the time in between onset of stroke and initiation of the rehabilitation program (Time since onset to Admission (days)) and length of stay (LOS) were also reported.
Statistical analyses
Growth Mixture Modeling (GMM) was applied using the lcmm (Proust-Lima et al., 2017) R package. GMMs are models for repeated observations of an outcome that allow individual trajectories to cluster within classes. These classes are unobserved (latent) but are inferred from the data. GMMs can be fitted to continuous outcomes like the motor FIM, assuming Gaussian or non-Gaussian distributions. We fitted GMMs to motor FIM as outcomes with time since diagnosis (years) having both fixed and random effects, while also allowing for class-specific effects of time. Single class models were fitted initially to define the optimal transformations of outcome variables and best function of time, with models selected according to the lowest Bayesian information criterion value (Supplementary Table S4).
A cubic term for time and square-root. transformations of motor FIM gave the lowest Bayesian information criterion values. Models with two to six classes were subsequently fitted. The optimal number of classes was determined by selecting the model with the lowest Bayesian information criterion and highest entropy as in previous related research (Deakin et al., 2021).
Entropy is an indication of how well individuals have been allocated to each class on a scale of 0–1, with 1 meaning perfect classification, and is calculated using the mean posterior probability for each class. Posterior classification is also reported for each class for each GMM with two to six classes (Supplementary Table S4).
To describe the sample and the patients of the previously defined classes, absolute and relative frequencies were reported for categorical variables. χ2 test was performed to test for significant differences between the classes. For data analysis of continuous variables, medians and interquartile ranges were calculated and Kruskal–Wallis test was used to compare the previously defined classes. The significance level was set at α= 0.05.
Subjects with missing outcome data were included in the analysis, no imputation was done and only available data for each subject were used. Lasagne plot was generated using the longCatEDA R package (Tueller et al., 2016).
Ethics statement
The authors confirm that this study is compliant with the Helsinki Declaration of 1975, as revised in 2008 and it was approved by the Ethics Committee of Clinical Research of Institut Guttmann Hospital de Neurorehabilitació.
Data availability statement
The datasets generated for this study will be made available upon reasonable request to the corresponding author of the article.
Results
The source population was the total number of adult patients with primary diagnosis of ischemic stroke admitted to the rehabilitation unit of Institut Guttmann Hospital de Neurorehabilitació, during the whole period under study (March 2005 to March 2020).
A total of 1223 patients with ischemic stroke composed such population. After excluding 436 of them with more than 90 days since stroke onset to inpatient rehabilitation admission, 347 with less than 3 complete FIM assessments (admission, discharge and first follow up) and excluding 12 with a previous story of disability or another concomitant comorbidity (e.g. traumatic brain injury), 428 patients were included in the study (Details are presented in Supplementary Figure SM1).
Table 1 presents their characteristics at admission. The median age at injury was 51.5 years. As detailed in supplementary material the mean age of the excluded patients was 53.9, the age range of the included patients was 18.3–64.6, meanwhile it was 18.8–87.5 for the excluded patients. Remarkably 67.1% of all included patients were men meanwhile in the excluded patients the proportion of men was even higher (68.6%) as shown in the supplementary material. As shown in Table 1, according to OCSP classification, 69.3% of patients were TACI. According to the BMI stratification presented in section 2.4 only 17.8% of all the included patients were obese.
Baseline characteristics for all included patients
Baseline characteristics for all included patients
All characteristics are presented as percentages, (% ), unless otherwise indicated. SD: standard deviation; Oxfordshire Community Stroke Project (OCSP): total anterior circulation infarcts (TACI), partial anterior circulation infarcts (PACI), lacunar infarcts (LACI), and posterior circulation infarcts (POCI), NIHSS: National Institutes of Health Stroke Scale; FIM: Functional Independence Measure; BMI: body mass index, LOS: Length of Stay.
Table 1 also presents the admission and discharge motor FIM assessments. At admission 58.6% of the patients’ motor FIM was poor and 18.2% good (as defined in section 2.3). Meanwhile at discharge the situation was almost the opposite: 56.3% good and 18.2% poor. This is visually presented as a lasagne plot in Fig. 1.
In Supplementary Figure SM2 we visually show Spearman’s correlations for total, motor and cognitive FIM at admission with age at injury and time in days since injury to admission. Total FIM and motor FIM were very strongly correlated (r = 0.96, p < 0.001), cognitive FIM and motor FIM were strongly correlated (r = 0.59, p < 0.001). Age at injury showed a low negative correlation with motor FIM (r = –0.18, p < 0.001) and time since injury to admission was not correlated to any FIM assessment.
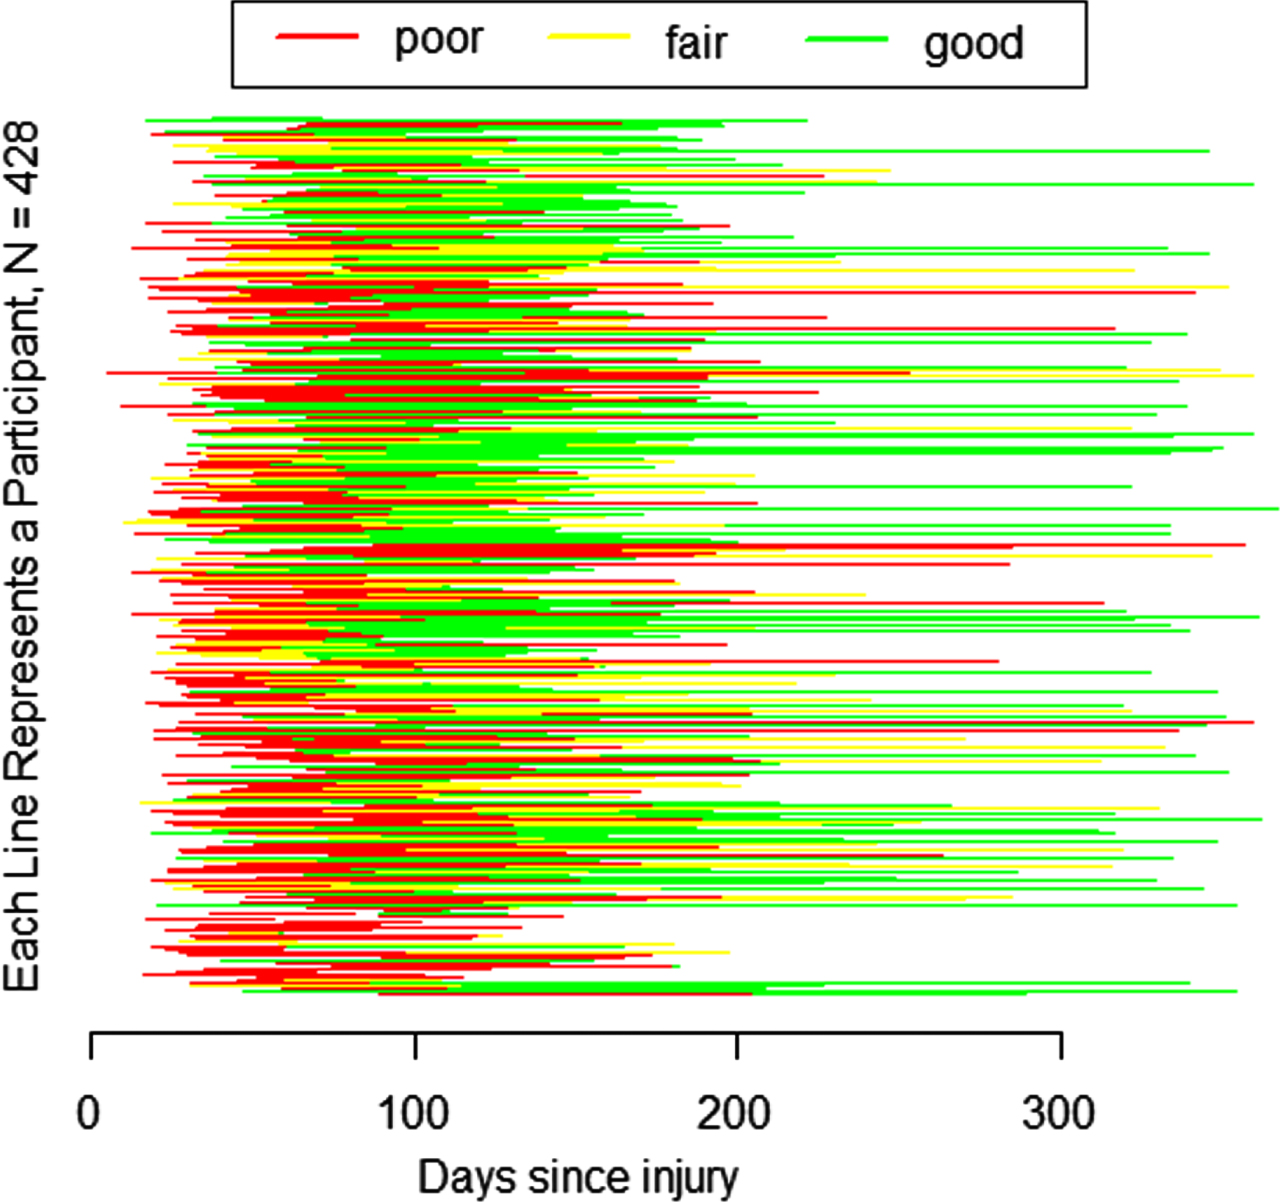
Lasagne plot of admission and discharge motor FIM assessments categorized as poor, fair or good.
As shown in Table 2, the median time since injury to FIM assessment at admission was 40 days, the range in days since injury to FIM assessment at admission was 5–90. The median time since injury to FIM assessment at discharge was 95 days, the range in days since injury to FIM assessment at discharge was 33–205. The median length of stay at inpatient rehabilitation was 53 days.
Time since injury to each assessment point, time since previous assessment and median motor FIM at each assessment point
FIM: Functional Independence Measure.
The median time since injury to FIM 1st follow-up assessment was 163 days, the range in days since injury to FIM 1st follow-up assessment was 47–366.
The median time since injury to FIM 2nd follow-up assessment was 1.83 years, the range in years since injury to FIM 2nd follow-up assessment was 0.18–3.82.
The median time since injury to FIM 3rd follow-up assessment was 3.31 years, the range in years since injury to FIM 3rd follow-up assessment was 0.30–4.93.
Finally, the median time since injury to FIM 4th follow-up assessment was 3.90 years, the range in years since injury to FIM 4th follow-up assessment was 0.45–5.93.
Figure 2 shows the trajectories with time represented as number of days since injury of total FIM (top) and motor FIM (bottom) as spaguetti plots for all included patiens during the whole period under study.
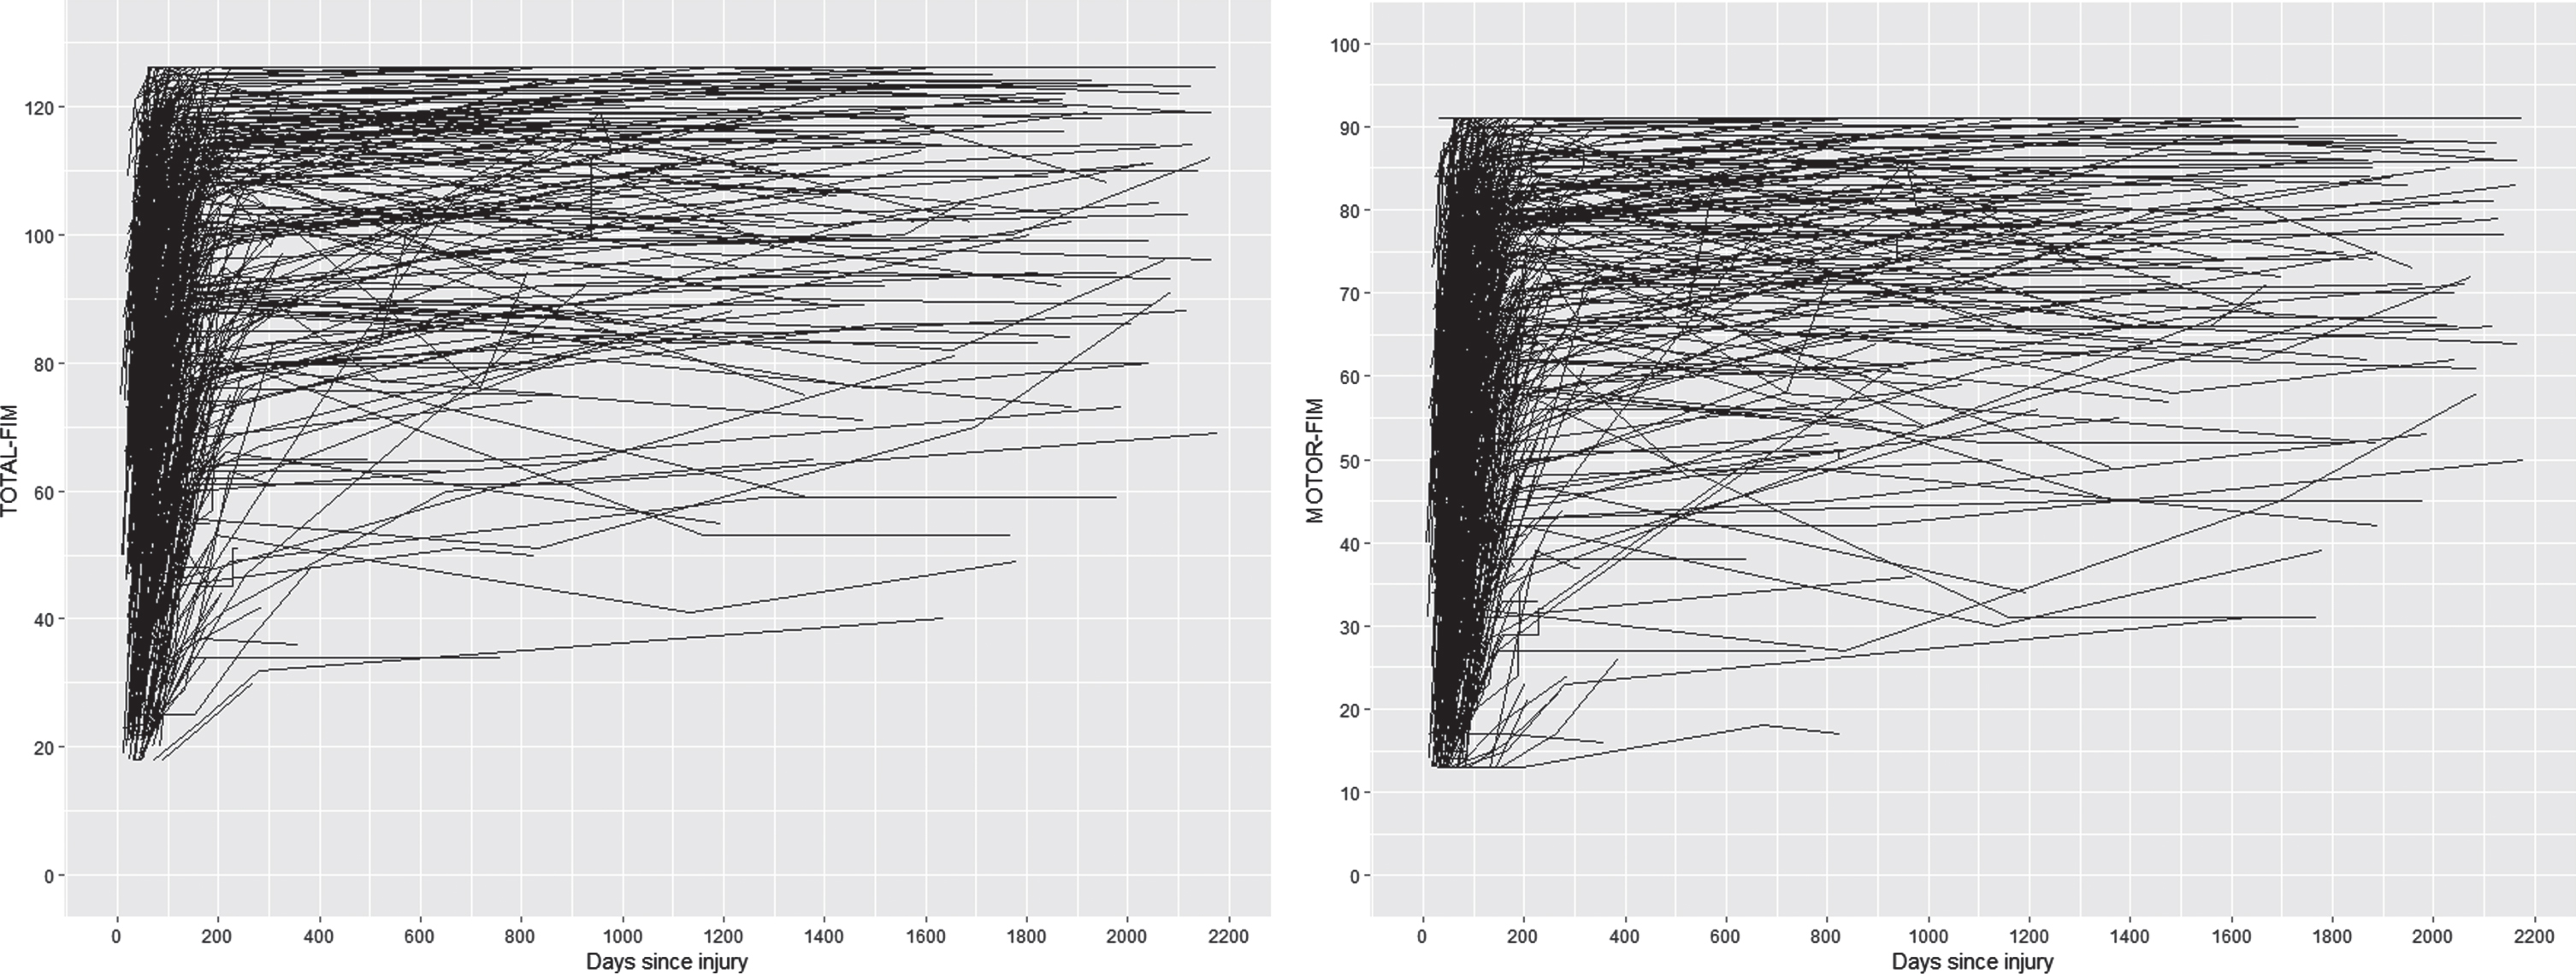
Spaguetti plots of total FIM (top) and motor FIM (bottom) for all included patients during the whole period under study.
The number of patients at each time point assessment are also presented in Table 2 : 428 at admission, discharge and 1st follow up with 67.1% men, 217 at 2nd follow-up (65.9% men), 113 at 3rd follow-up (63.7% men) and 50 at 4th follow-up (74.0% men). Therefore a total of 1,664 motor FIM assessments were performed during the whole period under study.
To separate the heterogeneity of trajectories presented in Fig. 2 into groups with more homogeneous patterns in motor FIM trajectory, GMM analysis was applied.
As shown in Supplementary Table SM2, models with two to six classes were subsequently fitted. The optimal number of classes (three classes) was determined by selecting the model with the lowest Bayesian information criterion and highest entropy as in previous related research. As presented in SM2 most patients were predicted to belong in Class 3 (n = 281, 65.7%), Class 2 included 99 patients (23.1%) and Class 1 48 patients (11.2%). Figure 3 visually presents the predicted trajectories for each class.

Class-specific motor FIM predicted trajectories.
In Table 3 we present the baseline characteristics for the 3 identified classes. Class 3 were the youngest, with the lowest proportion of NIHSS-severe stroke (32.6%), the largest proportion of PACI lesions (22.2%), lowest proportion of dysphagia (20.6%), hypertension (42.5%) and atrial fibrillation (2.5%). Class 3 scored highest motor FIM at admission and at discharge. Meanwhile class 1 were the oldest, with 62.5% of them in the 50–59 age range, with the largest proportion of patients with hypertension (62.5%), neglect (54.2%), dysphagia (56.2%), diabetes (29.2%), dyslipidemia (39.6%), with the largest time since injury to hospital admission and the largest length of stay in hospital.
Baseline characteristics for the 3 identified classes
All characteristics are presented as percentages, (%), unless otherwise indicated. SD: standard deviation; Oxfordshire Community Stroke Project (OCSP). total anterior circulation infarcts (TACI), partial anterior circulation infarcts (PACI), lacunar infarcts (LACI), and posterior circulation infarcts (POCI). NIHSS: National Institutes of Health Stroke Scale; FIM: Functional Independence Measure; LOS = Length of Stay.
In relation to motor FIM categories at admission, 97.9% of patients in class 1 were categorized as poor, very similar to class 2 (99%), meanwhile 37.7 of class 3 were poor. The median NIHSS at admission were also similar for patients in class 1 and class 2 (16.0 and 15.0 respectively, with 38.1% of class 1 and 37.8% of class 2 categorized as mild to moderately severe stroke).
Nevertheless, at discharge 83.3% of patients in class 1 were categorized as poor, meanwhile only 25.3% of patients in class 2 were categorized as poor. Only 2.1% of patients in class 1 were categorized as good and 35.4% of patients in class 2.
Motor FIM gain, efficiency and effectiveness was remarkably larger in class 2 than in class 1. The proportion of patients with aphasia was similar in class 1 and in class 3, meanwhile it was larger in class 2 (51.5% of patients in class 2 had aphasia).
Figure 4 presents the motor FIM spaghetti plot (the same as in Fig. 2 bottom) now with each patient assigned to one of the identified classes.
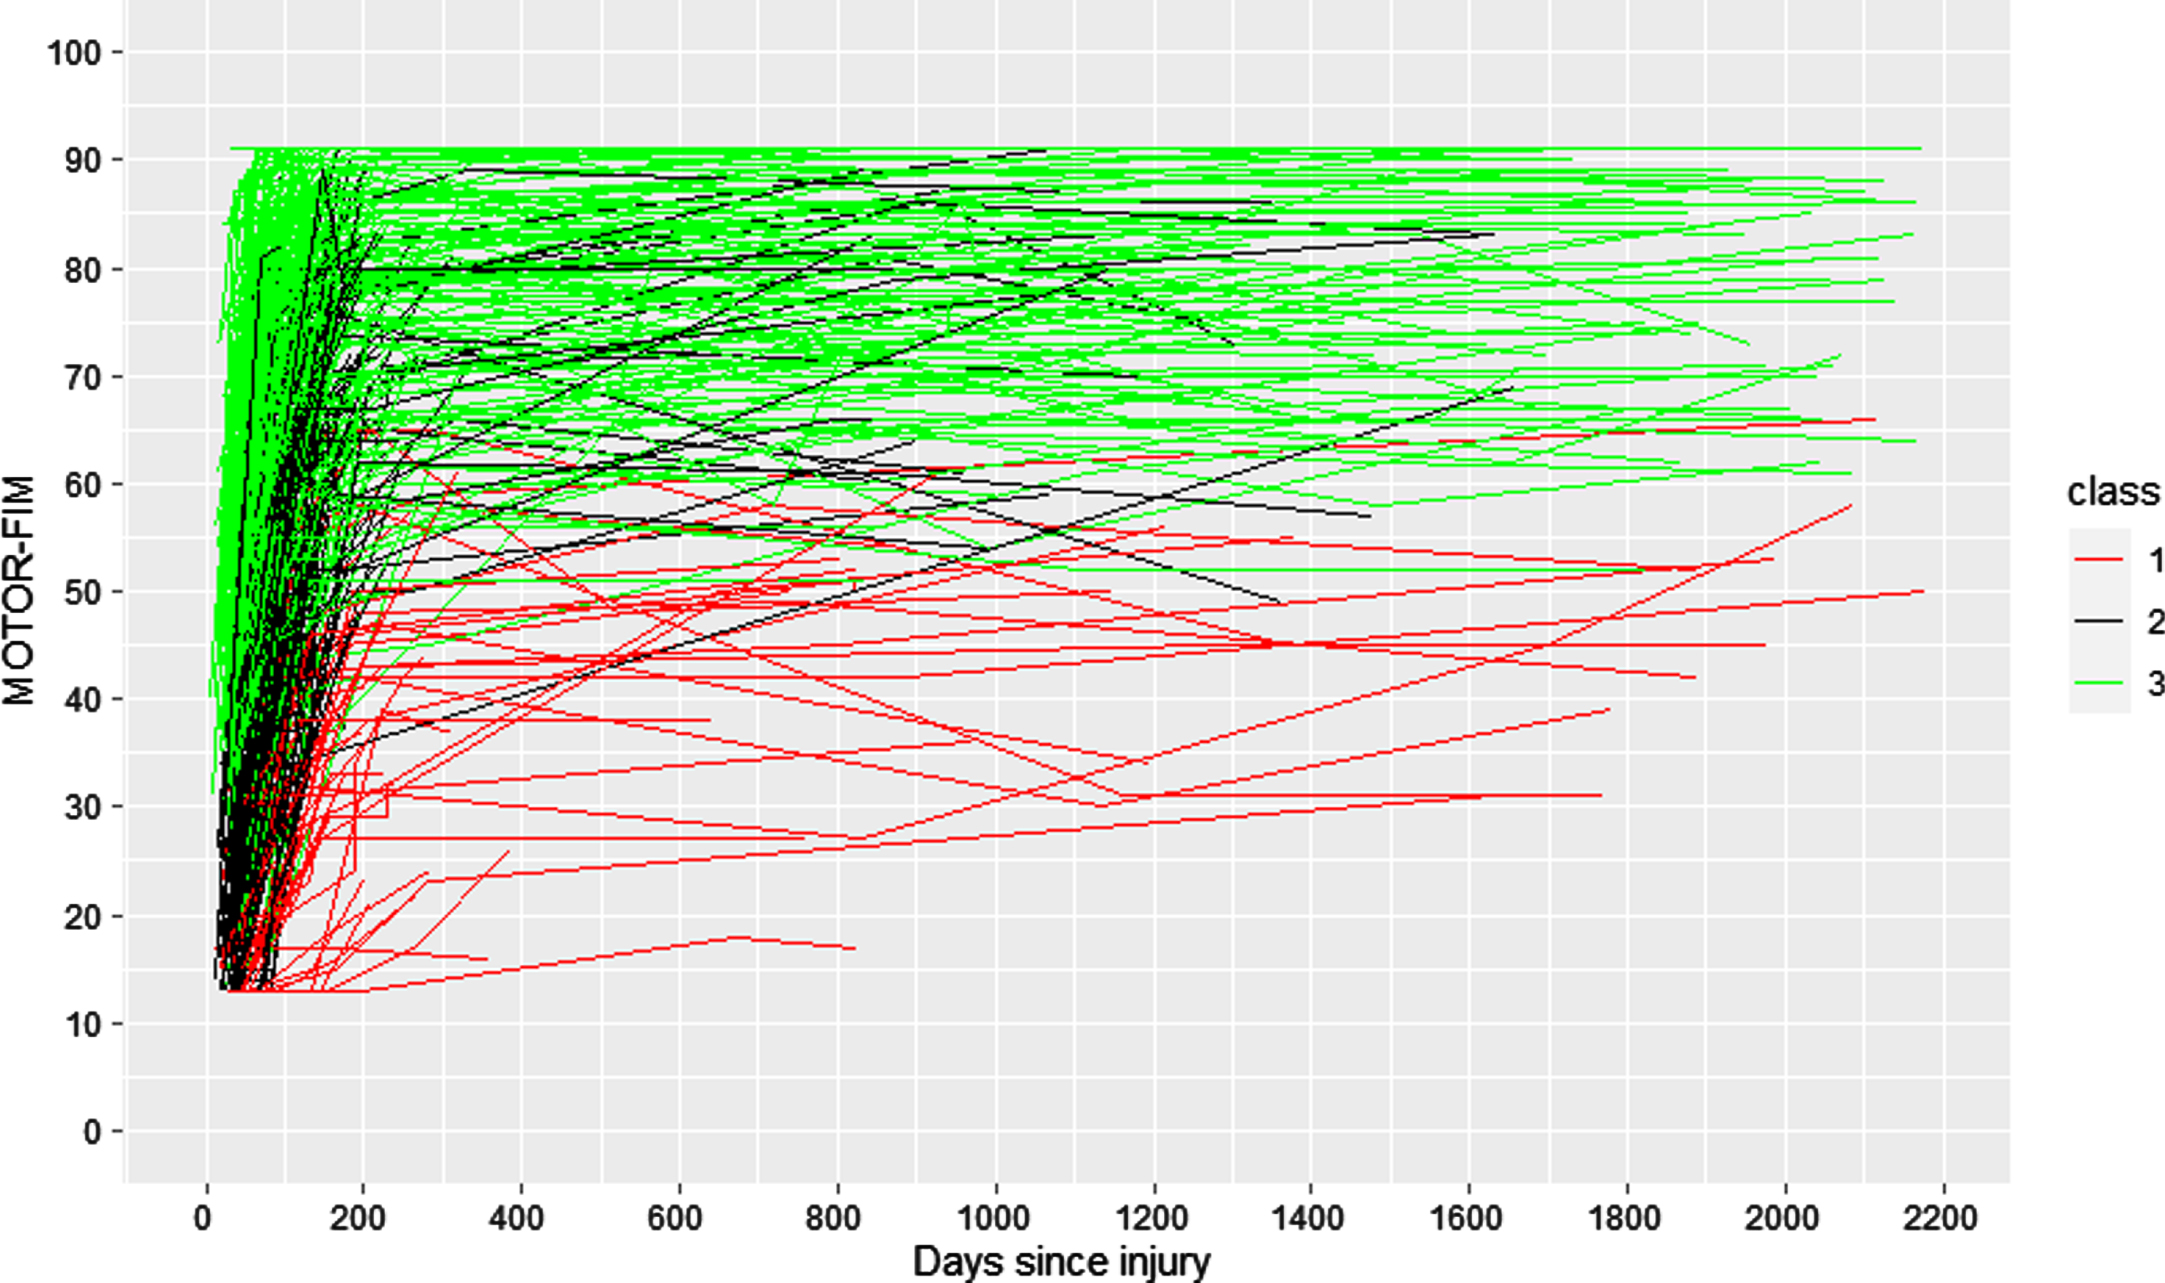
Spaguetti plot of motor FIM with each patient assigned to one of the identified classes.
Table 4 presents the number of patients in each class at each assessment point, for example in the 2nd follow-up, the total number of included patients were 217, with 15.2% of them in class 1, 19.8% of them in class 2 and 65.0% of them in class 3. It can be observed that the proportion of patients in each class at each assessment point is maintained for classes 2 and 3 meanwhile it grows for class 1:11.2% at admission, discharge and 1st follow up, 15.2% at 2nd follow up, 15.9% at 3rd follow up and 18.0% at 4th follow up.
Total number of patients in each class at each assessment point and their distribution within the classes
Table 5 presents the number and percentage of patients for each motor FIM category (poor, fair or good) at each assessment point for each class and Fig. 5 visually presents such percentages.
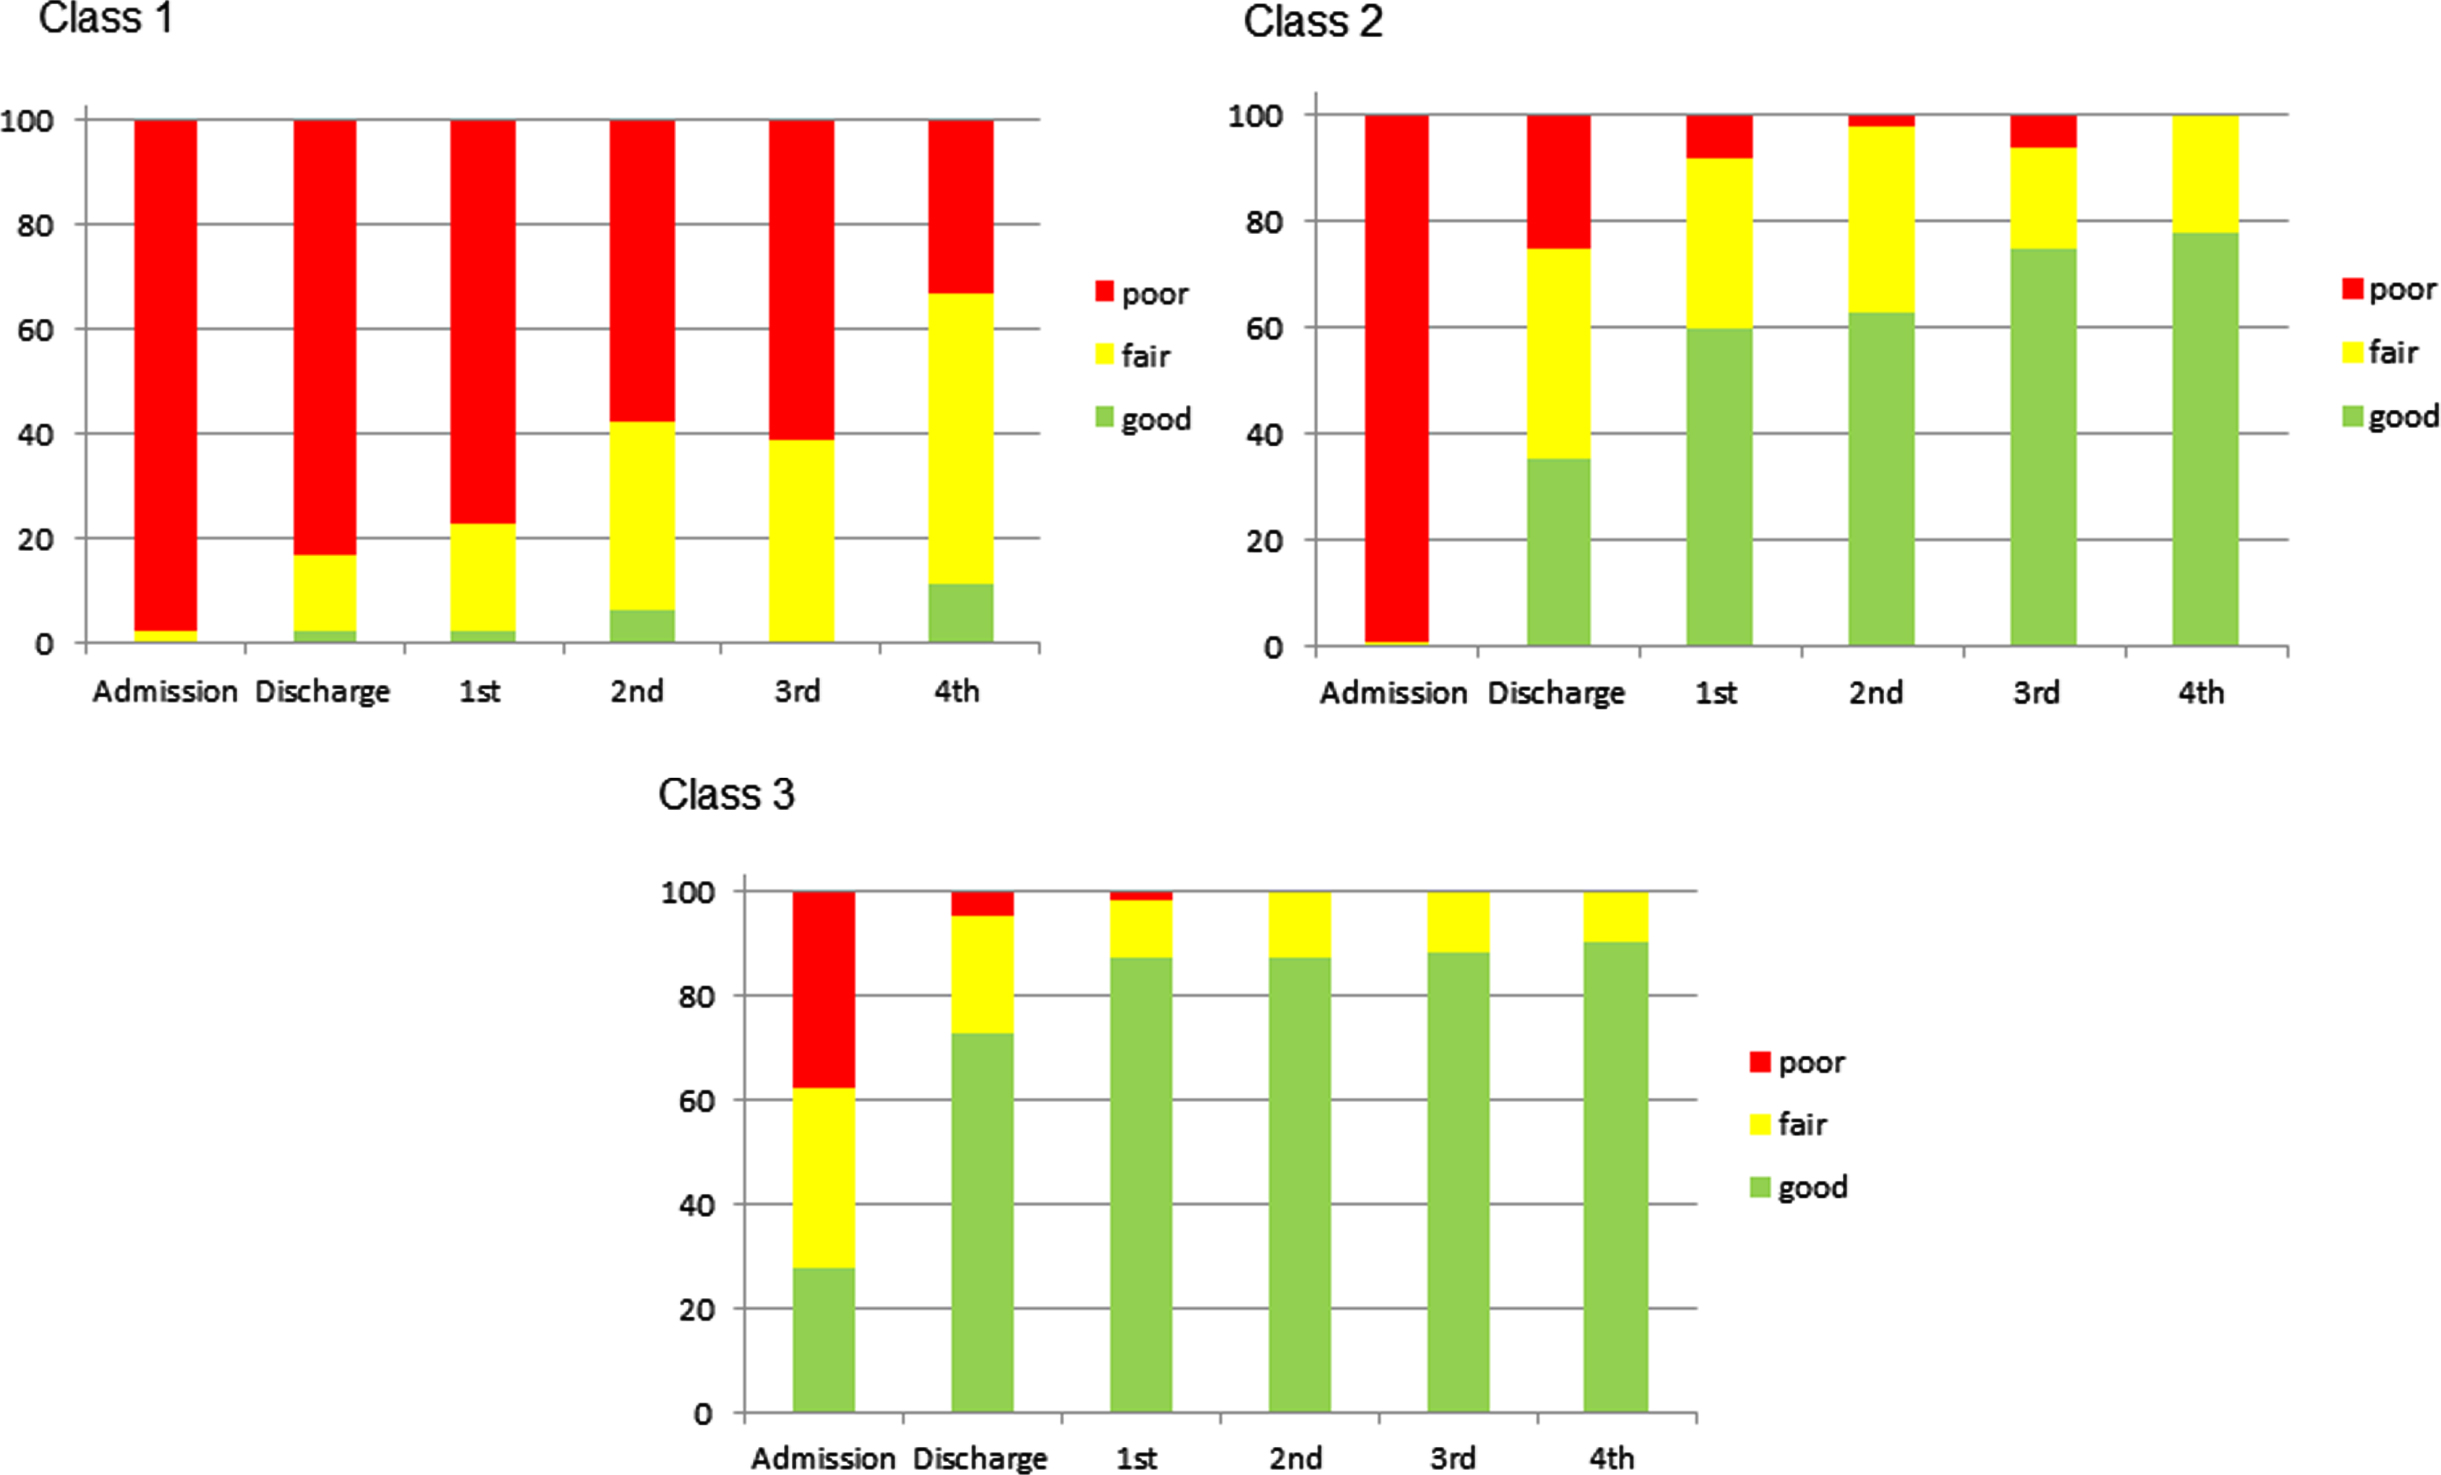
Bar plot showing the percentage of patients for each motor FIM category (poor, fair or good) at each assessment point for each class.
Number and percentage of patients for each motor FIM category (poor, fair, good) at each assessment point for each class
NOTE: The percentage of patients is calculated over the total number of patients in each class. For example in Class 1 at the 2nd Follow up assessment for the poor FIM category the number of patients is 19 (57.6% of all patients in Class 1 at the 2nd Follow up assessment), the total number of patients in Class 1 at 2nd Follow up is 33 as shown in Table 4. Figure 5 visually shows these percentages.
In this study we applied GMM analysis to identify 3 classes of patients with ischemic stroke (younger than 65 years old at the moment of injury) showing different trajectories of motor functional independence up to 5 years after injury and we characterized the identified classes with baseline clinical factors, using data from a rehabilitation center.
As recently reported (Rejno et al., 2019) the chronic phase beyond rehabilitation discharge after stroke has so far received little attention, mainly because it has been perceived as relatively static, an assumption that is supported by previous studies (e.g. Magalhaes et al., 2014). Other studies report increasing (Dhamoon et al., 2009; Ullberg et al., 2015) or decreasing (de Campos et al., 2017) ADL dependence beyond the first three months after stroke, thus challenging the concept that the chronic phase of stroke is stable (Kwakkel & Kollen, 2013).
While such previous results described the long-term recovery process for patients with stroke, further identification of subgroups of patients with continuing needs of assistance would be an important step to continue providing more effective rehabilitation intervention programs. As recently remarked by Lu et al. (Lu et al., 2018) (their study reported on patients after traumatic brain injury) from a clinical point of view, similarly for patients after stroke, this could be translated in 1) allocation of more rehabilitation (and research) resources to patients targeted with less optimistic recovery trajectories to enhance rehabilitation to further improve recovery programs, 2) development of tailored rehabilitation intervention programs targeting the unmet needs and relevant clinical trajectories beyond the postacute phase, and 3) further research, to evaluate the effectiveness of patient-centered rehabilitation programs and cost effectiveness in different recovery trajectory groups.
We hypothesized that the mean age of our sample at the moment of injury would be younger than the usually reported mean age in functional independence studies after stroke. Our results confirmed such hypothesis; the median age at injury in our included patients was 51.5 years. As detailed in the supplementary material the mean age of the excluded patients was 53.9, the age range of the included patients was 18.3–64.6, remarkably, this was not an inclusion criteria, this was an incidental finding which contrasts with related publications, as well as the highest proportion of men (67.1%) when compared to women in our sample. For example, in Magalhaes et al. (n = 380) the median age was 73.0±7.5 the percentage of men was 44.7% (Magalhaes et al., 2014). Dhamoon et al. (n = 525) mean age was 68.6±12.4 the percentage of men was 45.5 % (Dhamoon et al., 2009). Ullberg et al. (n = 35,064 patients who completed the 3- and 12-month follow-up), 54% men, mean age of men was 71.6 (11.17) and women 75.2 (11.72). (Ullberg et al., 2015). De Campos et al. (n = 367), mean age was 63.4 (16.2), 56.4% were men (de Campos et al., 2017). Rejno et al. (n = 1,421) mean age was 75.9 years, 55% were men (Rejno et al., 2019). As presented in the supplementary material the proportion of men in our excluded patients is even larger (68.6%). Literature on the subject has previously reported that women after stroke tend to receive fewer specialized rehabilitation than men and are more likely to be referred to nursing homes in a higher proportion than men (Reeves et al., 2008). Tariq et al. recently reported results on 11 stroke centers in the United States (n = 1172), concluding that women with large vessel occlusion acute ischemic stroke are less likely to be routed to comprehensive stroke centers than men (Tariq et al., 2021). Further analysis on this direction leaves room for future work.
This study has some limitations. The analyzed data was collected in one single tertiary center, suggesting that the generalization of these results should be considered carefully and our findings need to be validated independently before they can be generalized to the general population of patients with stroke. Further limitations involve missing data. The GRoLTS-Checklist (Guidelines for Reporting on Latent Trajectory Studies), remarks that latent class approaches assume the situation of missing at random (MAR). This means that the missing data might depend on observed variables but do not depend on unobserved variables. Item 3a of the GRoLTS-Checklist concludes that as long as attrition is not systematic in a specific way, MAR is quite realistic and missingness is assumed to be random given a person’s score on these observed measurements. It could be the case, however, that missingness depends on other variables, most commonly social factors. In such circumstances, one could include the predictors of missingness in the model. For example as in (Deakin et al., 2021) where patients were recruited at 16 different centres in the UK, one of the centers was identified as potential predictor of missingness and included in the model. A possible source of missingness in our study could be the patients’ living location at the moment of admission (presented in Table 1) nevertheless, the great majority of them (77.6%) are from one single location, the identification of further sources of missingness are left to be addressed as future work.
Conclusions
GMM analysis identified novel long-term trajectories of motor functional independence in (young adults) patients after ischemic stroke characterized using several variables assessed during inpatient rehabilitation.
Footnotes
Conflict of interest
Dr. Madai reported receiving personal fees from ai4medicine outside the submitted work. There is no connection, commercial exploitation, transfer or association between the projects of ai4medicine and the results presented in this work.
Funding
This research was partially funded by PRECISE4Q Personalised Medicine by Predictive Modelling in Stroke for better Quality of Life–European Union’s Horizon 2020 research and innovation programme under grant agreement no. 777107.