
Abstract
BACKGROUND:
Ischemic stroke is a common type of stroke associated with reorganization of functional network of the brain.
OBJECTIVE:
This pilot study aimed to investigate the characteristics of functional brain networks based on EEG in patients with acute ischemic stroke.
METHODS:
Seven patients with ischemic stroke within 72 hours of onset and seven healthy controls were enrolled in the study. Dynamic EEG monitoring and clinical information were repeatedly collected within 72 hours (T1), on the 5th day (T2), and on the 7th day (T3) of stroke onset. A directed transfer function was employed to construct functional brain connection patterns. Graph theoretical analysis was performed to evaluate the characteristics of functional brain networks.
RESULTS:
First, we found that the brain networks of ischemic stroke patients were quite different from the healthy controls. The clustering coefficient (0.001 < Threshold < 0.2) in Delta, Theta, and Alpha bands for the patients were significantly lower (P < 0.01) and the shortest path length in all bands (0.001 < Threshold < 0.2) for the patients were significantly longer (P < 0.01). Moreover, the peaks of the shortest path length for the patients seemed to be higher in all bands with larger thresholds. Secondly, the brain networks for the patients showed a characterized time-variation pattern. The clustering coefficient (0.001 < Threshold < 0.2) of T1 was higher than that of T2 in alpha band (P < 0.01). The shortest path length (0.001 < Threshold < 0.2) of T3 was shorter than that of T2 (P < 0.01) in all bands, and the peak of T3 was numerically higher than that of T2 in all bands with narrower thresholds.
CONCLUSION:
Functional brain networks in patients with acute ischemic stroke showed impaired global functional integration and decreased efficiency of information transmission compared with healthy subjects. The shortening of the shortest path length during the recovery indicates neural plasticity and reorganization.
Keywords
Introduction
Stroke is a major contributor to death and disability worldwide (Lozano et al., 2012). The degree of neurological deficit in acute ischemic stroke is closely related to the patient’s prognosis (Hasan et al., 2021). In addition to National Institute of Health Stroke Scale (NIHSS), functional magnetic resonance imaging (fMRI) or Electroencephalogram (EEG) can also be used to deepen our understanding of the brain’s reorganization and recovery after injury (Wang et al., 2021; Xin et al., 2017). Local lesions after stroke often affect brain functional connectivity, indicating large-scale reorganization of functional and structural networks (Vecchio et al., 2019). Understanding the functional connectivity and reorganization over the first week after symptom onset, will lead to improved chances for successful rehabilitation.
The assessment of functional connectivity based on EEG is a promising complementary approach to fMRI-based connectivity for investigating brain network-phenotype relationships. EEG-based functional connectivity has been shown to be subject-specific and associated with age, gender and IQ (Nentwich et al., 2020). When studying functional brain connectivity, the method typically employed involves calculating the correlations between various neural substrates in the brain. In order to infer causality, several methods for computing effective connectivity were proposed, including: Partial Directed Coherence (PDC) (Phang et al., 2020), Structural Equation Modeling (SEM), and Dynamic Causal Modeling (DCM) (Friston et al., 2012). The directed transfer function (DTF), as used in our study, is a multivariate spectral method proposed by Kaminski (Kaminski et al., 1991) to calculate directed connections between any pair of signals in a multidimensional data set. Multivariate autoregression (MVAR) can simultaneously calculate the direction and strength of connections. The core of DTF is based on Granger causality theory and can be extended to variables of any dimension. Studies have shown that DTF can effectively estimate the functional connectivity patterns of the cerebral cortex (De Vico et al., 2007; Stam et al., 2007; Li et al., 2003). Granger proposed a causal relationship based on the complete information set and the time sequence of occurrence. Here, we aimed to utilize resting-state EEG as dynamic detection method to determine changes in brain networks in patients with acute ischemic stroke in a longitudinal design. We employed the functional connection mode based on DTF, and calculated two graph theoretical network metrics that are central for the description of brain networks (He et al., 2010): (1) the clustering coefficient, which indicates the degree to which the network forms independent nodes or partial clusters; and (2) the shortest path length, which indicates the ability of the network to connect and exchange information as a whole (Bullmore et al., 2009; Rubinov and Sporns, 2010; Papo et al., 2014).
Methods
Study design
The study was designed as a longitudinal, case-control pilot study. Patients experiencing a stroke within 72 hours prior inclusion, who were admitted to the Department of Neurology, Dongzhimen Hospital, Beijing University of Chinese Medicine from January 2016 to June 2017, were invited to participate in this study. Dynamic EEG monitoring and clinical information collection were performed within 72 hours (T1), on the 5th day (T2), and on the 7th day (T3) after stroke onset. Hence, data acquisition time points for patients admitted on their 1st, 2nd or third day after stroke onset are collectively referred to as T1 (within 72 hours of onset). Healthy control participants were recruited via advertisements from the local community.
All participants provided written informed consent prior inclusion. The study was conducted according to the Declaration of Helsinki and was approved by the Ethics Committee of the Dongzhimen Hospital (approval number: ECPJ-BDY-2016-85). Procedures involving this study in accord with the ethical standards of the Committee on Human Experimentation of the Ethics Committee of the Dongzhimen Hospital.
Participants
In total, 14 participants were enrolled in this experiment, comprising seven patients with stroke and seven healthy control participants. Stroke patients included five males and two females and had a mean age of 63.86±10.13 years. Diagnostic criteria for stroke were based on the 2010 Guidelines for the Diagnosis and Treatment of Acute Ischemic Stroke in China, promulgated by the Chinese Medical Association Neurology Branch in 2010.
Inclusion criteria were: 1) a diagnosis of an ischemic stroke; 2) an anterior circulation infarction; 3) first stroke with no previous history of organic encephalopathy; 4) incidence within 72 hours; 5) aged 35–75 years old. Exclusion criteria were: 1) a transient ischemic attack (TIA); 2) thrombolytic therapy; 3) confirmed stroke caused by brain tumors, brain trauma, or blood diseases; 4) rheumatic heart disease, coronary heart disease, or other heart diseases combined with atrial fibrillation, causing cerebral embolism; 5) diseases of the liver, kidney, hematopoietic system, endocrine system, osteoarthritis, or other serious diseases; 6) current or previous mental disorders or severe dementia; 7) concurrent infection or fever; 8) patients with primary or secondary epilepsy; 9) patients who took sedative drugs or sleeping pills within 3 days prior inclusion.
NIHSS (Kwah & Diong, 2014) was used to evaluate the degree of neurological deficit. The treatment plan employed basic medical treatment. None of the cases included in this study received other rehabilitation treatments such as physical therapy or occupational therapy.
Additionally, seven healthy control participants including four males and three females with mean age: 43.57±17.52 years were recruited. They were right-handed and had to have no history or current diagnosis of neurological or psychiatric diseases.
EEG data acquisition
All patients underwent a neurophysiological evaluation protocol that included a 32-channel video-EEG (standard 10/20 system) with a maximum duration of 180 min in the first 72 hours after stroke (T1). Two similar EEGs with the best possible technical quality (in conditions with eyes closed, resting condition outside hyperventilation, photic stimulation or sleep) were collected on the 5th (T2) and 7th (T3) day post-stroke. Data were collected using a Neuron-Spectrum-EEG series digital electroencephalograph (Neurosoft, Russia), with a sample frequency of 500 Hz (high-frequency filter 100 Hz; low cutoff filter 0.1 Hz). The electrode impedance was controlled and kept within 5 kΩ. At least 5 trials of resting state EEG with a length of 5 mins was collected from each participant, including healthy subjects.
EEG data preprocessing and functional brain network construction
Firstly, the basic characteristics of EEG of the subjects were observed, and the obvious drift waveform generated by interference noise and muscle movement in the original signal was removed. Then, the ocular artifacts were removed by the method of artifact correction. The baseline correction of data was performed to eliminate the EEG noise caused by spontaneous EEG activity. Finally, the artifact was removed. EEG signals were divided into four frequency bands according to the rhythm: delta band (1–4 Hz), theta band (4–7 Hz), alpha band (8–12 Hz), and beta band (12–30 Hz), henceforth referred to as B1, B2, B3, and B4. Patients’ EEG signals in the four frequency bands were collected, connection strength between arbitrary leads of the different rhythms of resting state EEG was obtained using the functional connection mode based on DTF. Data of each frequency band were analyzed, and overall and local EEG signals of stroke patients were taken into account.
Network construction
The DTF model is based on a multivariate autoregressive model. The time is t and the number of leads is N. The EEG waveform X can be described as:
Multivariate autoregressive model (MVAR) was used to fit the data to obtain the following formula (Chklovskii et al., 2004):
The elements in the N×N matrix Λ(k) are MVAR model parameters, and E(t) is a multi-parameter zero-mean white noise vector. p is the order of the MVAR model. The size of the order affects the MVAR fit and converts the above to the frequency domain:
H(f) is the system transfer matrix. The value of the element Hij in H(f) describes the input with j as the input, i is the connection strength between the two leads of the output [6], and information on spectral features and connections between leads are included in the system transfer matrix H(f). The DTF matrix is thus built as follows (Bartels & Zeki, 2004):
The association matrices of brain network are obtained by binarizing the DTF matrices in certain threshold. Since, how to decide the proper threshold is still an open question. Therefore, we set the threshold for matrix binarization from 0.001 to 0.2, and network analysis of this threshold interval are performed.
Clustering coefficient
The clustering coefficient C of node i is defined as the ratio between the number of edges between other nodes directly connected to node i and the maximum possible number of edges between these other nodes (Pedersen et al., 2015), defined as:
Shortest path length
Shortest path length is defined as the average of the shortest distance between any two nodes in the network. The shortest distance between any two nodes is the number of edges on the shortest path of the two nodes. It is recorded as dij, and the network average path can be expressed by the formula (Kaiser & Hilgetag, 2006):
Statistical analysis
MATLAB2016a data analysis software was used to analyze the EEG data. The clustering coefficient and shortest path length of the control and patient groups were calculated. For each frequency band, the average data of the patients were obtained within 72 hours, and on the 5th and 7th day of the disease. The Wilcoxon rank sum test was used to analyze the changes in clustering coefficient and shortest path length during disease onset (Acimovic, 2015) to determine changes in functional brain network connections in patients with acute stroke. Because this hypothesis test comes from simultaneously testing 3 independent hypotheses on the same data set, the significance level when testing a hypothesis is set to 0.01.
Results
NIHSS
The degree of neurological deficit at T1, T2 and T3 is shown in Table 1. All the patients were not accompanied with disturbance of consciousness, and the NIHSS values of these patients were generally small. Combining the changes of NIHSS at different time periods (Fig. 1), it can be inferred that the patient’s neurological functions present a recovery trend from T1 to T3, and the neurological defect gradually approaches normal levels.
NIHSS of seven stroke patients
NIHSS of seven stroke patients
M = Male; F = Female; NIHSS = National Institute of Health Stroke Scale.

NIHSS at different time in acute ischemic stroke, T1: the first 72 hours after stroke; T2: the 5th day post-stork; T3: the 7th day post-stroke.
First, we investigated the clustering coefficient of stroke patients compared with healthy people for different frequency bands (Delta, Theta, Alpha, and Beta). For low thresholds, the clustering coefficient was numerically higher in the patient group compared to that of the control group. However, significance levels were not smaller than 0.01. As the threshold increased (0.027 < Threshold in Delta, 0.025 < Threshold in Theta, (0.025 < Threshold in Alpha, 0.042 < Threshold in Delta), the clustering coefficient of the patient group was lower than that of the control group (P < 0.01) (Fig. 2). For all thresholds (0.001 < Threshold < 0.2). Wilcoxon rank sum test between the two groups showed that the clustering coefficient was lower in the patient group compared to that of the control group in Delta, Theta, and Alpha bands (P < 0.01), see Table 2.

Clustering coefficient of patient group and control group at different thresholds in different frequency bands. Results of delta, theta, alpha and beta band are indicated in sub-figure A, B, C, and D respectively. The thresholds where significant difference was found were indicated by cross mark.
Clustering coefficient and shortest path length between patient group and control group for all binarization thresholds
P < 0.01, *Significant difference between patient group and control group. C: clustering coefficients, L: shortest path length.
Next, we investigated the clustering coefficient in the patient group over time. This analysis revealed a numerical trend of T1 > T2 > T3 (Fig. 3). However, only in the alpha band of a certain threshold interval (0.078 < Threshold < 0.135), the differences between T1 and T2 were significant (p < 0.0167). For all thresholds (0.001 < Threshold < 0.2), Wilcoxon rank sum test between T1 and T2, T1 and T3 also showed significant difference in the alpha band (Table 3). The clustering coefficient of T1 was higher than that of T2 (P < 0.01) and T3 (P < 0.01) in alpha band.

Clustering coefficient of T1, T2 and T3 at different thresholds in different frequency bands. Results of delta, theta, alpha and beta band are indicated in sub-figure A, B, C, and D respectively. The thresholds where significant difference was found are indicated by cross marks.
Wilcoxon rank sum test of clustering coefficients between T1 and T2, T2 and T3, T1 and T3
P < 0.01, *Significant difference between T1 and T2, T1 and T3 in alpha band. T1: the first 72 hours after stroke, T2: the 5th day post-stroke, T3: the 7th day post-stroke.
When comparing the shortest path length between the two study groups across threshold values, we observed an initial increase, followed by a decrease in patients compared to controls (Fig. 4). The peak of the shortest path length was numerically higher in patient group compared to that of the control group in four frequency bands, and the corresponding threshold value was larger when the peak appeared. Near the middle of threshold, the shortest path length was significantly higher in patient group compared to that of the control group (P < 0.01) (Fig. 4). For all thresholds (0.001 < Threshold < 0.2), Wilcoxon rank sum test between the two groups showed that there was significant difference in four bands, and the shortest path length was higher in patient group than that of the control group (P < 0.01) (Table 2).

The shortest path length of the patient group and the control group at different thresholds in different frequency bands. Results of delta, theta, alpha and beta band are indicated in sub-figure A, B, C, and D respectively. The thresholds where significant difference was found are indicated by asterisks.
Finally, we investigated the shortest path length in stroke patients at different time points (Fig. 5). The peak of T3 was numerically higher than that of T2 in four frequency bands, and the corresponding threshold value was smaller than that of T2 when the peak appeared. The shortest path length of T3 was significantly shorter than that of T2 in a certain threshold segment (0.02 < Threshold < 0.08) (P < 0.01). For all thresholds (0.001 < Threshold < 0.2), Wilcoxon rank sum test between T2 and T3, T1 and T3 also showed significant difference in four frequency bands, (Table 4). The shortest path length of T3 was shorter than that of T2 (P < 0.01) and T1 (P < 0.01).
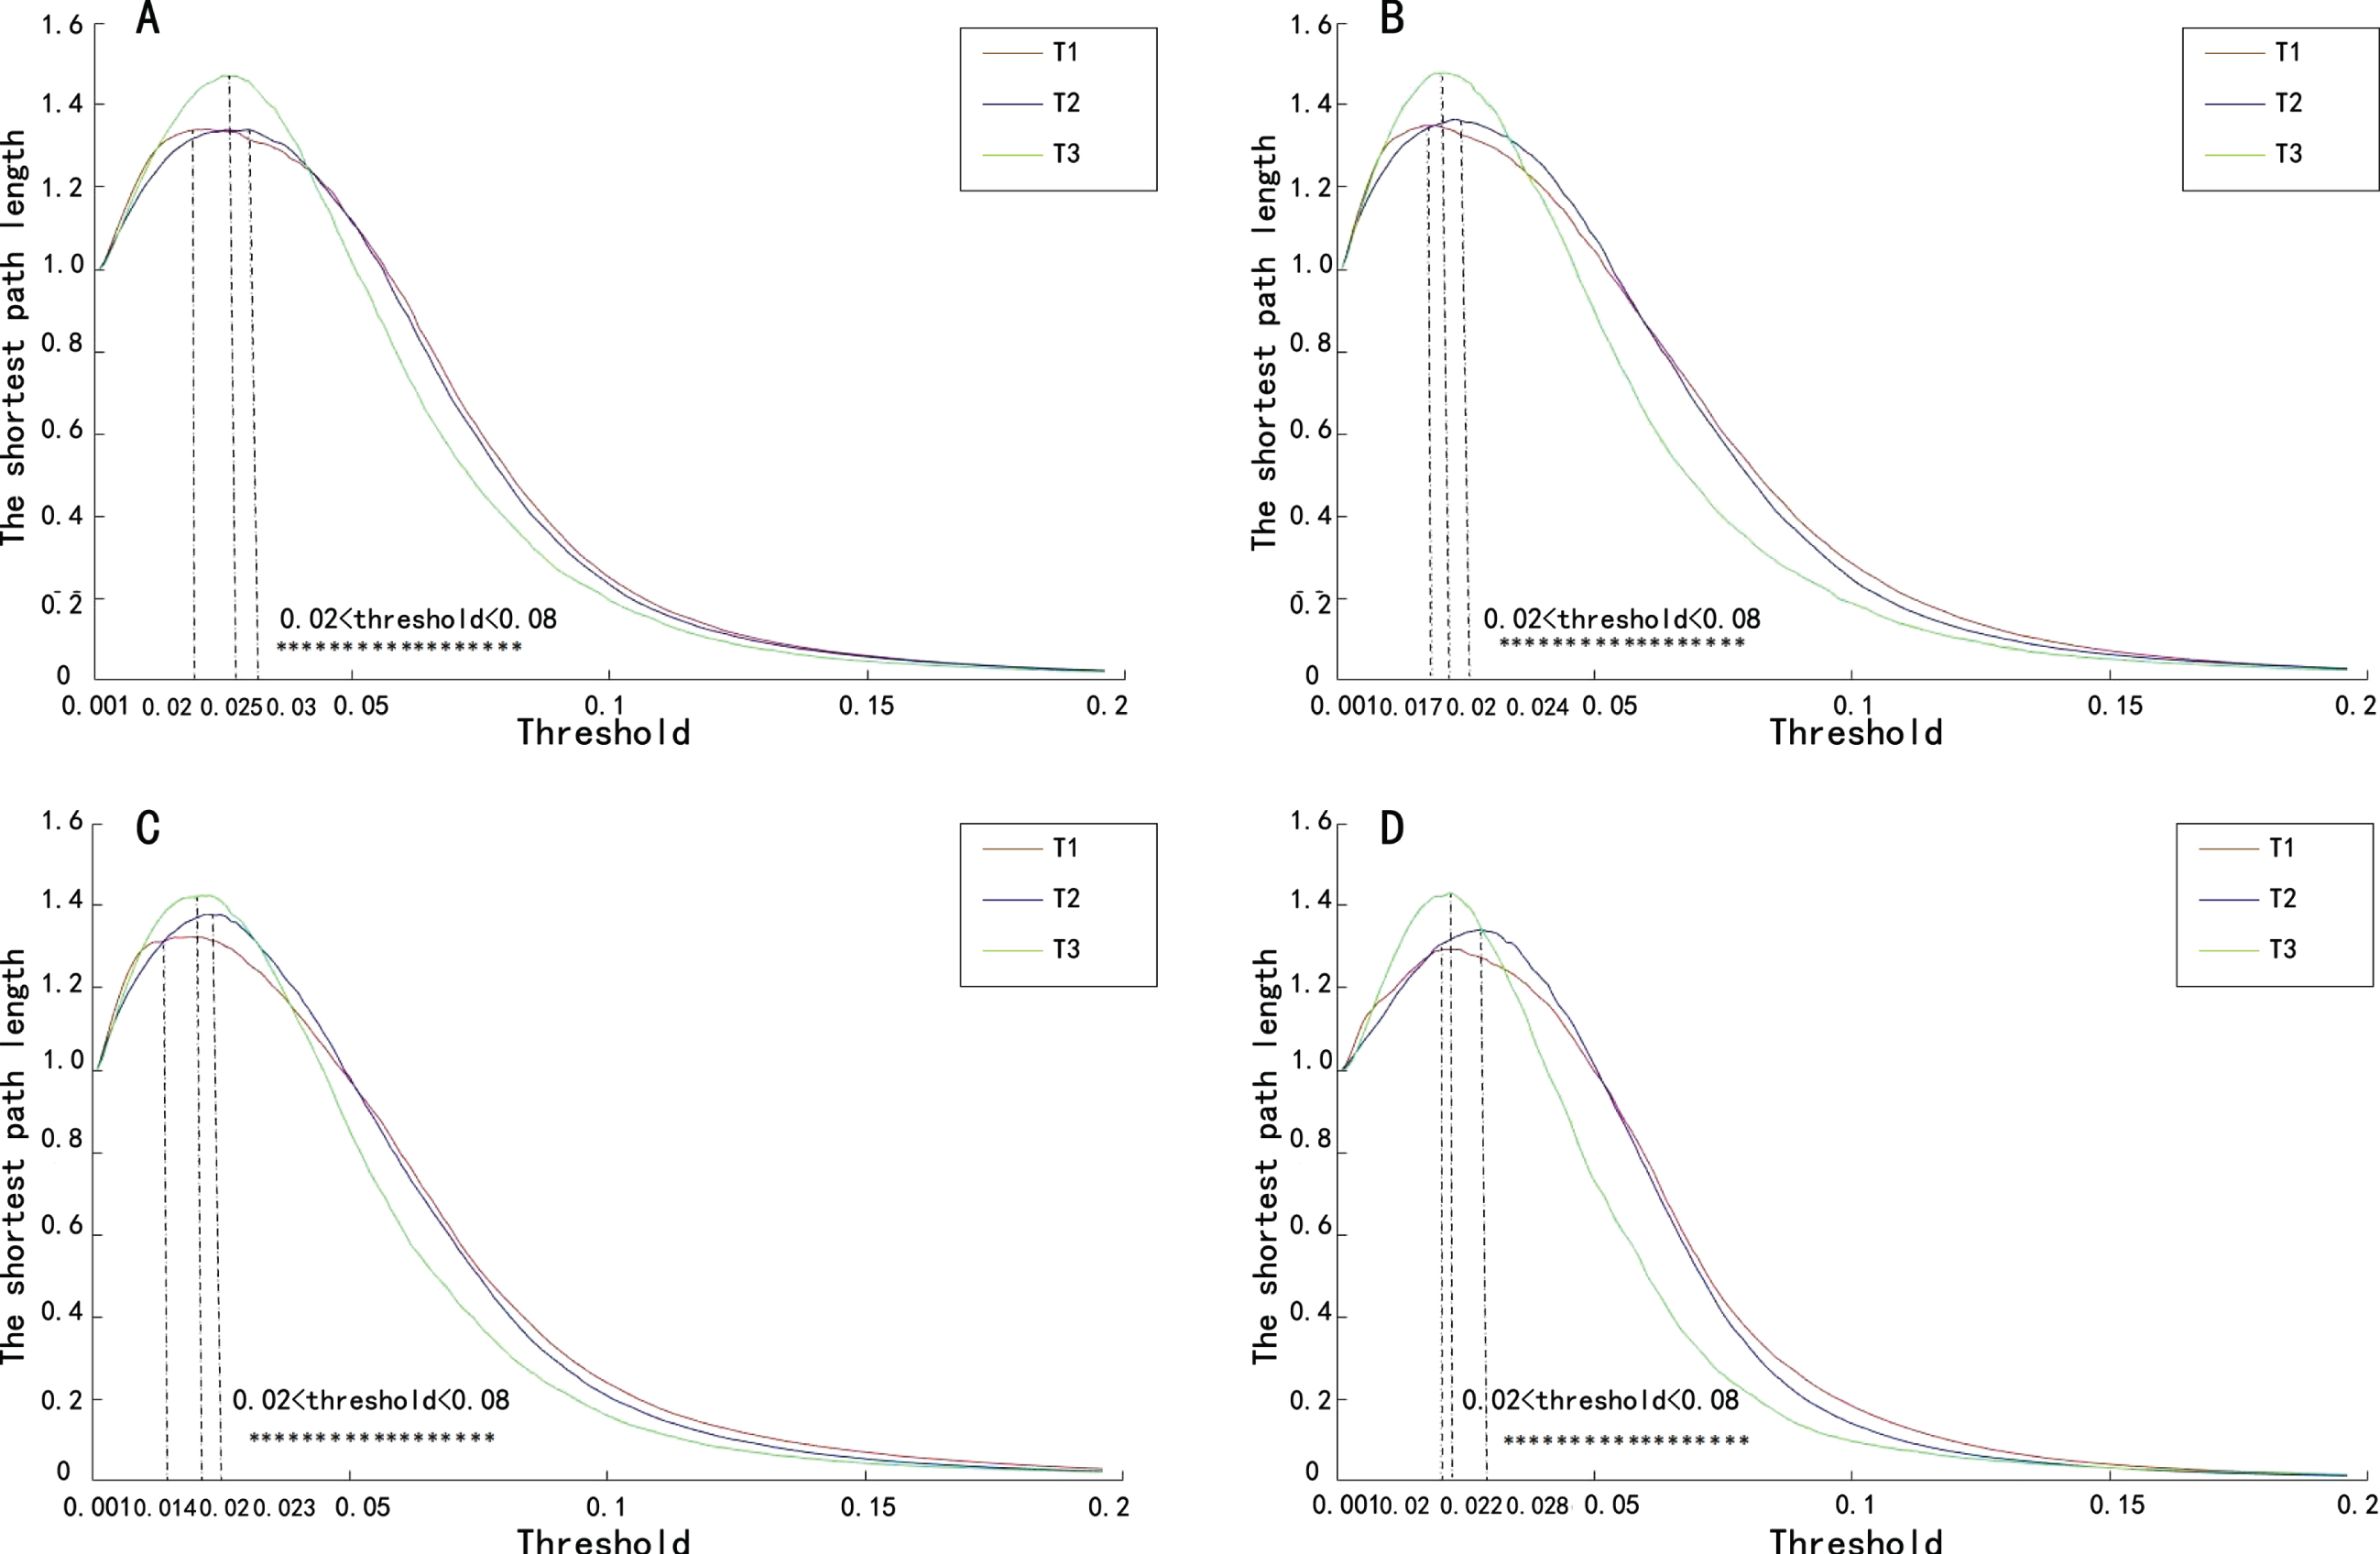
The shortest path length of T1, T2 and T3 at different thresholds in different frequency bands. Results of delta, theta, alpha and beta band are indicated in sub-figure A, B, C, and D respectively. The thresholds, where significant difference between T2 and T3 was found, are indicated by asterisks.
Wilcoxon rank sum test of the shortest path length between T1 and T2, T2 and T3, T1 and T3
P < 0.01, *Significant difference between T2 and T3, T1 and T3 in four bands. T1: the first 72 hours after stroke, T2: the 5th day post-stroke, T3: the 7th day post-stroke.
How to select a proper method to construct the topological graph of brain functional network is still an open question (Bassett & Bullmore, 2017). Related researches employed method based on directed network and undirected network, weighted connection and unweighted connection to study our brain. Although number of weighted connection based researches increased (Bassett & Bullmore, 2017), the original Watts-Strogatz (WS) model was proposed based on sparse unweighted-undirected network (Watts & Strogatz, 1998). The WS model was proposed in certain network density, usually we assumed that was a sparse graph. The comparison between network graphs should be follow similar degree distribution (Van den Heuvel et al., 2009). The degree of weighted graph is strongly associated with the connecting strength between channels of each participant. And the individual differences of the connecting strength are omnipresent. Therefore, it is difficult to answer that either the network density which obtained by weighted method is satisfy the WS model or the brain graph follow the condition of similar degree distribution. The network density of the unweighted and undirected brain graph could be adjusted by scanning all possible binarization thresholds (Stam et al., 2007; Duan et al., 2014; Duan et al., 2017). By doing so, the topological properties of brain graph under different network densities could be considered. During the scanning of binarization thresholds, we could observe the changing process of global connectivity of brain network by the shortest path length. The decrease of the shortest path length when the threshold cross certain value indicates the sparseness of graph makes the brain regions start to isolate with each other. This property could provide us some insight of global efficiency of the brain network.
Characteristics of complex brain networks in stroke patients compared with healthy people
The clustering coefficient of stroke patients indicate the lower local efficiency than that of healthy people. The clustering coefficient is often used to measure the internal accumulation of the network. The more this index tends to be 1, the network nodes are more closely connected. On the contrary, if the value is close to 0, it means that the local accumulation index of the network is lower and the internal connections of the network are looser (Acimovic, 2015). The clustering coefficient of the control group was higher than that of the patient group in Delta, Theta, and Alpha bands. Because of the influence of infarct focus in acute stage of stroke, the pattern of brain connection changed accordingly, which is manifested by the decrease of connection density. The global efficiency indicator, i.e., shortest path length, shows that information of patients should pass longer path than that of healthy people. The shortest path length is often used to show the efficiency of information transmission in the brain network, the shorter the shortest path length, the higher the global efficiency of the network, and the faster the information is transmitted between network nodes. The results suggest that the global efficiency of participants with brain lesion is significantly lower than that of control. The peaks of shortest path length curves indicate the limit threshold that could still ensure the binarized unweight network connected as a whole. The corresponding threshold value in patient groups was higher than that of the control group when the peak appeared, because the brain after stroke is in a highly synchronized state (with stronger connecting strength) and discrete nodes appear in a higher threshold compared with healthy people. Fanciullacci et al. reported that brain activities of stroke group were higher than control (Fanciullacci et al., 2021). Stronger brain activity commonly induces stronger synchronization between nodes and stronger connectivity. The shortest path length of stroke patients in different frequency bands is higher than that of healthy people, because the sparsity of brain network of patients is lower than that of control. Figure 4 also shows, as the threshold increase, the shortest path length curves of patient decrease faster than that of control. It means the unweighted network of control group is easy to maintain the network density when the binarization threshold increase. This result suggests, although brain network of patient group have stronger overall connectivity, but the brain network of control group possess limited number of strong connections. The control group connections hold a great variety of connecting strength.
The characteristics of complex brain networks of stroke patients at different time points
Previous functional network study of the acute stroke recovery mainly focused on the outcome of brain plasticity of tens of days after stroke (Fanciullacci et al., 2021; Hasan et al., 2021; Pietro et al., 2017; Vecchio et al., 2019). This work pay attention to the network reorganization within 10 days. The alpha wave is the main component of the brain activities of healthy adults and is commonly used to indicate normal brain function clinically. The comparative analysis of the clustering coefficients of stroke patients at different time points showed that there was a significant difference between T1 and T2 in the alpha band, the clustering coefficient T1 was higher than T2. The results may suggest that further changes in brain network patterns occurred during the period, i.e., reorganization of brain network showed the increase of network randomness. The patient’s brain may begin to rebuild the global connection from the 3–5 days of onset, reduce local connections, thereby enhancing the global connection of the brain network. From the global efficacy index, the shortest path length was reduced from the 5th day to the 7th day. In the calculation, the distance between unreachable nodes tends to be 0, as the network becomes more and more sparse, partitions will appear between nodes, causing the shortest path length gradually decrease to 0, i.e., the network is completely partitioned. Compared with T1 and T2, Fig. 5 shows, as the increase of binarization threshold, curves of T3 possess higher peaks and decrease faster than that of others. The decrease pattern of T3 curves are more inclined to normal group curves. It is suggested that the connecting strength of brain network may decrease and network regions more easily separated on the 7th day of onset, so it is easier to adjust brain functional connections, to establish new connections. The shortest path length was greatly reduced from the 5th day to the 7th day, and the efficiency of information transmission in the brain network was higher, suggesting that the 5–7 days after onset of ischemic stroke is the key time point of brain network reorganization, and EEG may show changes earlier than clinical assessment.
The analysis of brain functional network connectivity deepened understanding of pathophysiology of functional recovery after stroke
Patients’ function networks in this study showed a trend of reorganization after the 5th day of onset. This transformation process can be explained as the physiological change of the patient’s brain network from rigid to rebuild, and then functional change from regular lattice to other. The brain network is more likely to establish new functional connection patterns during the 5–7 days after onset, suggest the patient’s neurological functions will show a recovery trend. The global efficiency of cerebral network is increased and the local connections is also start to adjust after the 5th day of stroke. The reorganization intends to boost up the information transmission between regions. Concurrently, plastic reorganization of the nerves in the lesioned area was evident, and novel connections enhanced the long term connectivity of brain networks, these novel connections could replace the connections between critical nodes that have been disconnected. However, in this recovery process, brain networks are gradually changing from regular lattice to a random mode, indicating that brain network functional connectivity of stroke patients does not involve all local brain regions during the rehabilitation process. The reorganization of brain network is an ongoing process and does not tend to the optimal small-world network in current stage.
Conclusions
Functional brain networks in patients with acute ischemic stroke show impaired global functional integration and decreased efficiency of information transmission compared with healthy subjects. The shortening of the shortest path length during the recovery indicates neural plasticity and reorganization.
Study limitations
The NIHSS value of stroke patients in this study is generally low, the patient’s condition is relatively mild. In severe stroke patients, its characteristics may be different, which will be further discussed in future studies. The small sample size makes the likelihood of Type II error of our finding. This study analyzes the overall network of the brain, without a comparative analysis of the left and right hemispheres, this will be another interesting research direction in future research.
Conflict of interest
The authors declare that we do not have any commercial or associative interest that represents a conflict of interest in connection with the work submitted.
Footnotes
Acknowledgments
The authors thank all the patients, their families, doctors, and nurses in this study for their generous cooperation.
Funding
This work was supported by grants from the National Natural Science Foundation of China (Grant No. 81541170), the Peking University Medicine Seed Fund for Interdisciplinary Research (Grant No. BMU2018MX027), and Beijing Natural Science Foundation (Grant No. 7181005).