
Abstract
INTRODUCTION:
The symptoms and pathophysiology of multiple sclerosis (MS) could affect how exercise is perceived, including ratings of perceived exertion (RPE). The purpose of this cross-sectional study was to examine absolute and relative RPE during exercise in a large sample of persons with MS.
METHODS:
135 persons with MS (Patient-Determined Disease Steps (PDDS) scale mdn = 2.0, IQR = 3.0) and 64 healthy controls completed a maximal, incremental exercise test on a cycle ergometer with open-circuit spirometry for measuring exercise variables (i.e., VO2peak). RPE were obtained during the last 10 seconds of each minute using Borg’s 6–20 scale. Data were analyzed in the overall sample, in a subsample of participants that continued exercise at and/or above 120 W (84 persons with MS and 57 controls), and in a sample of persons with MS (n = 55) and controls (n = 55) that were matched on age, sex, and VO2peak.
RESULTS:
ANOVA and post-hoc analyses revealed group differences in RPE at absolute exercise intensities (W) in the overall sample with the exception of the lowest intensity (W = 15) and in the subsample and matched sample at only at the highest intensity (W = 120). There were no statistically significant differences in RPE relative to VO2peak (mL/kg/min) in the overall sample, subsample and matched sample, such that RPE increased similarly between groups as a function of relative exercise intensity.
DISCUSSION:
Persons with MS reported similar RPE to exercise compared to healthy controls when data were expressed in terms of relative exercise intensity. RPE can be utilized for exercise prescriptions and documenting adaptations to exercise training in persons with MS.
Introduction
Multiple sclerosis (MS) is a neurodegenerative disease of the central nervous system (CNS) with a prevalence of 1 per 1000 persons in the United States [1]. This disease involves inflammation, axonal demyelination and transection, and neurodegeneration within the CNS that results in neurological disability, functional impairments, and symptoms such as muscle weakness and spasticity, walking and balance dysfunction, and fatigue [2]. These manifestations may be associated with the very low levels of physical activity and high levels of sedentary behavior reported in the MS population [3, 4]. However, there is much evidence demonstrating the benefits and safety of exercise in persons with MS for managing the consequences of the disease [5–7].
Ratings of perceived exertion (RPE) are often used to monitor exercise effort and intensity with acute and chronic training in persons with chronic diseases, including MS [8]. RPE involves the personal recognition and subjective interpretation of sensations arising from the body during exercise and is mediated by physiological and psychological factors, exertional symptoms, and performance settings [9]. RPE is commonly measured using Borg’s 6–20 scale [10], and this scale has recently been validated in submaximal exercise in persons with MS [11]. Importantly, the assessment of RPE during exercise is a practical, non-invasive measure of effort and intensity and is important for exercise prescriptions as well as documenting adaptations to exercise training.
The symptoms associated with MS could affect how exercise is perceived, including RPE. For example, fatigue is one of the most commonly reported MS symptoms that could influence the sense of physical exertion [12]. A recent review indicated that persons with MS demonstrate alterations in outcomes from cardiopulmonary exercise testing when compared with healthy controls, such as lower VO2peak and HRpeak, and that the alterations are exacerbated with increasing disability [13]. These alterations may reflect lower exercise tolerance, cardiovascular autonomic dysfunction, or decreased capacity to exercise. There is very limited research specifically examining RPE during exercise in persons with MS compared with controls. One previous study reported that persons with MS (n = 12) demonstrated similar RPE and physiologic responses to submaximal and maximal exercise compared to controls (n = 12), using the Borg 10-point scale [14]. However, this study was limited in that the sample only included persons with MS with mild disability with a small range of aerobic fitness (i.e., VO2peak) levels. Therefore, this study may not be applicable to the majority of persons with MS with higher levels of disability and across a larger range of aerobic fitness (i.e. VO2peak) compared to healthy controls. These limitations can be addressed by examining replication in a larger and more definitive sample of persons with MS and healthy controls that examines RPE at both absolute (i.e., W) and relative (i.e., % VO2peak exercise intensities).
The purpose of the present study was to examine perceived exertion during a maximal exercise test in persons with MS compared to age-matched healthy controls using the Borg 6–20 RPE scale [10]. Based on previous research that demonstrated alterations in cardiopulmonary outcomes from exercise testing in persons with MS (i.e., lower exercise tolerance and decreased capacity to exercise) [13], we hypothesized that persons with MS will report higher RPE at absolute (W) and relative exercise intensities (% VO2peak) compared with healthy controls. If correct, this would have implications for the application of RPE values recommended for prescribing exercise intensity in training programs as defined by American College of Sports Medicine (ACSM).
Materials and methods
Participants
Participants with MS were recruited using print and e-mail flyers, an advertisement on the National Multiple Sclerosis Society website, and our database of previous participants with MS. Healthy controls were recruited using public e-mail postings. The inclusion criteria for persons with MS included (1) definite physician diagnosis of MS based on McDonald criteria [15]; (2) relapse-free for the previous 30 days; (3) ambulatory with or without assistive devices; (4) between 18 and 64 years of age; (5) willingness and physical ability to undergo a maximal exercise test; and (6) low risk of contraindications for exercise based on the Physical Activity Readiness Questionnaire [16]. The same inclusion criteria were applied for the healthy controls, with the exceptions of diagnosis of MS and relapse-free for the past 30 days. Healthy control participants also matched the sample of persons with MS based on age. Overall, 201 persons with MS and 82 healthy controls satisfied inclusion criteria and underwent testing. The final sample included 135 persons with MS and 64 healthy controls based on valid data from the maximal exercise test.
Perceived exertion assessment
RPE were obtained during exercise using the Borg 6–20 RPE scale, where 6 represents no exertion at all and 20 represents maximal exertion [10]. Participants were provided with standardized instructions on the use of the RPE scale prior to exercise test. During the test, participants were shown a large RPE scale, with numbers and descriptions, held up in front of them during the final 10 seconds of each minute during the test. At this point, they were asked to point at the number that best represented their level of perceived exertion at that time. To ensure accuracy, a researcher repeated the number pointed aloud to participants. This scale has been repeatedly demonstrated as a valid and reliable method for assessing perceived work intensity in the persons with and without diseases (ACSM, 2014) and in a small sample of persons with MS [11].
Maximal exercise test
All participants completed a maximal exercise test on an electronically-braked, computer-controlled cycle ergometer (Lode BV, Groningen, The Netherlands) and an open-circuit spirometry system (TrueOne, Parvo Medics, Sandy, UT, USA) for analyzing expired gases. Participants were not instructed to fast nor to withhold any medication prior to the exercise test. The O2 and CO2 analyzers of the spirometry system were calibrated using verified concentrations of gases, and the flow meter was calibrated using a 3-L syringe (Hans Rudolph, Kansas City, MO, USA). Participants were initially fitted to the cycle ergometer and were read standardized instructions for completing the test, along with instructions for providing RPE. They were then outfitted with a mouth-piece (Hans Rudolph, Kansas City, MO, USA) for collecting expired gases. Participants rested on the cycle ergometer for 1 minute and then performed a 4-minute warm-up at 0 W. Importantly, work rate (WR) continuously increased at a rate of 15 W/minute for both persons with MS and controls, and participants maintained a cadence of 60 rpm until reaching volitional fatigue or being unable to maintain the 60 rpm cadence. Participants were given verbal encouragement over the duration of the test. This test protocol has been validated in persons with MS [17] and has been consistently included in samples of MS and controls [18, 19]. Oxygen uptake (VO2), CO2 production (VCO2), minute ventilation (VE), and respiratory exchange ratio (RER) were measured continuously by the open-circuit spirometry system, and heart rate (HR) was continuously measured using a Polar HR monitor (Polar Electro Oy, Kempele, Finland). VO2peak (L/min; mL/kg/min), VEpeak (L/min), and RERpeak [VCO2 (L/min)/VO2 (L/min)] were defined as the highest recorded 20-second average during the final minutes of the test. WRpeak (W) and HRpeak (bpm) were recorded as peak power output (W) and HR, respectively, during the incremental protocol. RPE was recorded every minute during the test and RPEpeak was recorded as the highest value. The test was considered valid if two of the four criteria were satisfied: (1) plateau of VO2 despite a continued increase in WR (i.e.,≤50 ml difference of VO2 per minute between the 30-second average before the last power increment and that after the last power increment); (2) RERpeak≥1.10; (3) HRpeak≥90 % of age-predicted maximum (220-age); and (4) RPEpeak≥17. Only persons with MS and controls who satisfied two of the four criteria were included in the final sample and data analyses [20, 21].
The ventilatory aerobic threshold (VAT; VO2/VCO2; mL/kg/min) is an index of the onset of exercise-induced metabolic acidosis that represents an upper limit of exercise workloads that can be sustained for a prolonged period. VAT was calculated via the V-slope method as previously described [22, 23]. VO2 and VCO2 data were averaged for each 20-second period of exercise and using plots of VO2 versus VCO2, we determined the first point of VCO2 to depart from linearity (i.e., submaximal VO2 where there is a non-linear rise in VCO2). The average corresponding VO2 value was identified as the VAT. We further calculated the VAT value relative to % VO2peak by dividing the VAT VO2 value by VO2peak *100.
Disability status
The Patient-Determined Disease Steps (PDDS) scale was included as a self-report measure of MS disability status. This scale was developed as an inexpensive surrogate for the Expanded Disability Status Scale (EDSS) [24] and PDDS scores have been validated in MS [25]. The PDDS scale contains a single-item ordinal scale for measuring self-reported neurological impairment, ranging from 0 (normal) through 8 (bedridden).
Procedures
The procedures were reviewed by a university Institutional Review Board, and ethical approval was received. All participants provided written informed consent before data collection. Participants provided demographic and clinical information, followed by the maximal exercise test.
Data analysis
All analyses were performed in SPSS version 24. Demographic and clinical characteristics were analyzed for group (i.e., persons with MS and controls) differences using independent samples t-tests and chi-square difference tests. Data normality of the exercise variables was checked through the Shapiro-Wilk test and the comparison between groups was performed using independent samples t-tests or Mann-Whitney U tests, according to the data distribution. RPE changes during exercise were analyzed for between groups using repeated measures ANOVA. Group was a between-subjects factor with MS and controls as the two levels. Time was a within-subjects factor with repeated measures for exercise intensity, including absolute (W) and relative (% VO2peak) intensities. For absolute exercise intensities, the repeated measures analyses included the first eight absolute submaximal intensities (i.e., 15–120 W), as the majority of participants could not continue exercise above this intensity (i.e., 63% of persons with MS and 89% of controls). For relative exercise intensities, RPE were calculated based on the RPE value associated with the closest absolute exercise intensity at 30%, 40%, 50%, 60%, 70%, 80%, 90%, and 100% of peak exercise intensity (i.e., VO2peak). We performed ANOVA analyses on three samples, including the overall sample (135 persons with MS and 64 healthy controls); a subsample of high-performing participants that continued exercise at or above 120 W (84 persons with MS and 57 controls); and a sample with persons with MS and controls matched on age (±5 years), sex, and VO2peak (± 3 mL/kg/min) (55 persons with MS and 55 controls). Post-hoc analyses with Bonferroni corrections identified differences in RPE for both absolute and relative exercise intensities in the event of a significant interaction term (p < 0.05). We expressed the overall effect sizes from the ANOVAs as partial eta squared (ηp2), and values of 0.01, 0.06, and 0.14 represented small, moderate, and large effects, respectively [26].
Results
Participant characteristics
The demographic and clinical characteristics of persons with MS and healthy controls in the overall sample, subsample and matched sample are presented in Table 1. There were minimal and non-significant differences between persons with MS and controls in age, sex, and BMI.
Demographic and clinical characteristics of persons with MS and healthy controls
Demographic and clinical characteristics of persons with MS and healthy controls
Note. Data presented as mean (SD), unless otherwise noted. MS = multiple sclerosis; BMI = body mass index; RRMS = relapsing-remitting MS; PDDS = Patient Determined Disease Steps; AD = assistive device. The subsample includes participants who were able to exercise at or above 120 W during the maximal exercise test. The matched sample includes participants who were matched on sex, age (±5 years), and VO2peak (±3 mL/kg/min).
Exercise variables are presented in Table 2. Importantly, there were no adverse events during the maximal exercise tests. There were statistically significant differences (p < 0.05) between groups in the overall sample, subsample, and matched sample. In the overall sample, values for the majority of exercise variables were significantly lower in persons with MS compared to controls, including VO2peak, HR peak, WR peak, respiratory exchange ratio (RER peak), minute ventilation (VE peak), and time to exhaustion (TTE). VAT (VO2/VCO2) was also significantly different in persons with MS compared to controls. However, there were no statistically significant differences in the overall sample for RPEpeak or RPE at VAT.
Exercise variables in persons with MS and healthy controls
Exercise variables in persons with MS and healthy controls
Note. MS = multiple sclerosis; HR = heart rate; bpm = beats per minute; W = watts; RER = respiratory exchange ratio; RPE = rating of perceived exertion; VE = minute ventilation; VAT = ventilatory aerobic threshold; TTE = time to exhaustion. The 6–20 Borg RPE scale was used to measure exertion during cycling exercise. *represents a significant difference from Controls in overall sample at p < 0.05. ∧represents a significant difference from Controls in subsample at p < 0.05. #represents a significant difference from Controls in the matched sample at p < 0.05. The subsample includes participants who were able to exercise at or above 120 W during the maximal exercise test. The matched sample includes participants who were matched on sex, age (±5 years), and VO2peak (±3 mL/kg/min).
The subsample demonstrated similar differences between groups, except that RERpeak was not significantly different between persons with MS and controls.
In the matched sample, there were only statistically significant differences between groups for HR peak, WR peak, VE peak, and time to exhaustion (TTE), such that persons with MS demonstrated lower values compared to controls.
RPE at selected absolute exercise intensities in the overall sample, subsample, and matched sample are presented in Table 3. The data are limited to 15–120 W of cycling exercise, which represents the intensities that the majority of participants in the sample were able to complete (n = 84 and n = 57 for persons with MS and controls, respectively). In the overall sample, ANOVA revealed a significant main effect for exercise intensity (i.e., W) [F(7,197) = 599.5, p < 0.05, ηp2 = 0.75] and group (i.e., persons with MS vs. controls) [F(1,197) = 12.8, p < 0.05, ηp2 = 0.06]. There was a weak, yet statistically significant group×exercise intensity interaction [F(7,197) = 4.09, p < 0.05, ηp2 = 0.020]. The post-hoc analysis demonstrated that persons with MS reported higher RPE at each absolute intensity compared with controls, except at the lowest intensity (W = 15).
RPE at selected absolute exercise intensities and at relative exercise intensities in persons with MS and healthy controls
RPE at selected absolute exercise intensities and at relative exercise intensities in persons with MS and healthy controls
Note. Data presented as mean (SD), unless otherwise noted. MS = multiple sclerosis; RPE = rating of perceived exertion. The 6–20 Borg RPE scale was used to measure exertion during cycling exercise. *represents a significant difference from Controls in overall sample at p < 0.05. ∧represents a significant difference from Controls in subsample at p < 0.05. #represents a significant difference from Controls in the matched sample at p < 0.05. The subsample includes participants who were able to exercise at or above 120 W during the maximal exercise test. The matched sample includes participants who were matched on sex, age (±5 years), and VO2peak (±3 mL/kg/min).
In the subsample, ANOVA revealed a significant main effect for exercise intensity (i.e., W) [F(7,139) = 550.6, p < 0.05, ηp2 = 0.80], but not group (i.e., persons with MS vs. controls) [F(1,139) = 1.7, p = 0.20]. There was a weak, yet statistically significant group×exercise intensity interaction [F(7,139) = 2.97, p < 0.05, ηp2 = 0.021]. However, the post-hoc analysis demonstrated that persons with MS reported similar RPE at each absolute intensity compared with controls, except at the highest intensity (W = 120) whereby persons with MS reported higher RPE than controls.
In the matched sample, ANOVA revealed a significant main effect for exercise intensity (i.e., W) [F(7,108) = 728.1, p < 0.05, ηp2 = 0.87], but not group (i.e., persons with MS vs. controls) [F(1,108) = 2.2, p = 0.14]. There was further no statistically significant group×exercise intensity interaction [F(7,108) = 1.8, p = 0.08]. The post-hoc analysis again demonstrated that fitness-matched persons with MS reported similar RPE at each absolute intensity compared with controls, except at the lowest intensity (W = 15).
RPE at relative exercise intensities (i.e., 30%, 40%, 50%, 60%, 70%, 80%, and 100% of VO2peak) are also presented in Table 3 and Figs. 1–3, respectively. In the overall sample, ANOVA revealed a significant main effect for exercise intensity (i.e., % VO2peak) [F(7,197) = 696.1, p < 0.05, ηp2 = 0.78], but not group [F(1,197) = 1.05, p = 0.31]. There further was no statistically significant group×exercise intensity interaction [F(7,197) = 2.0, p = 0.11].
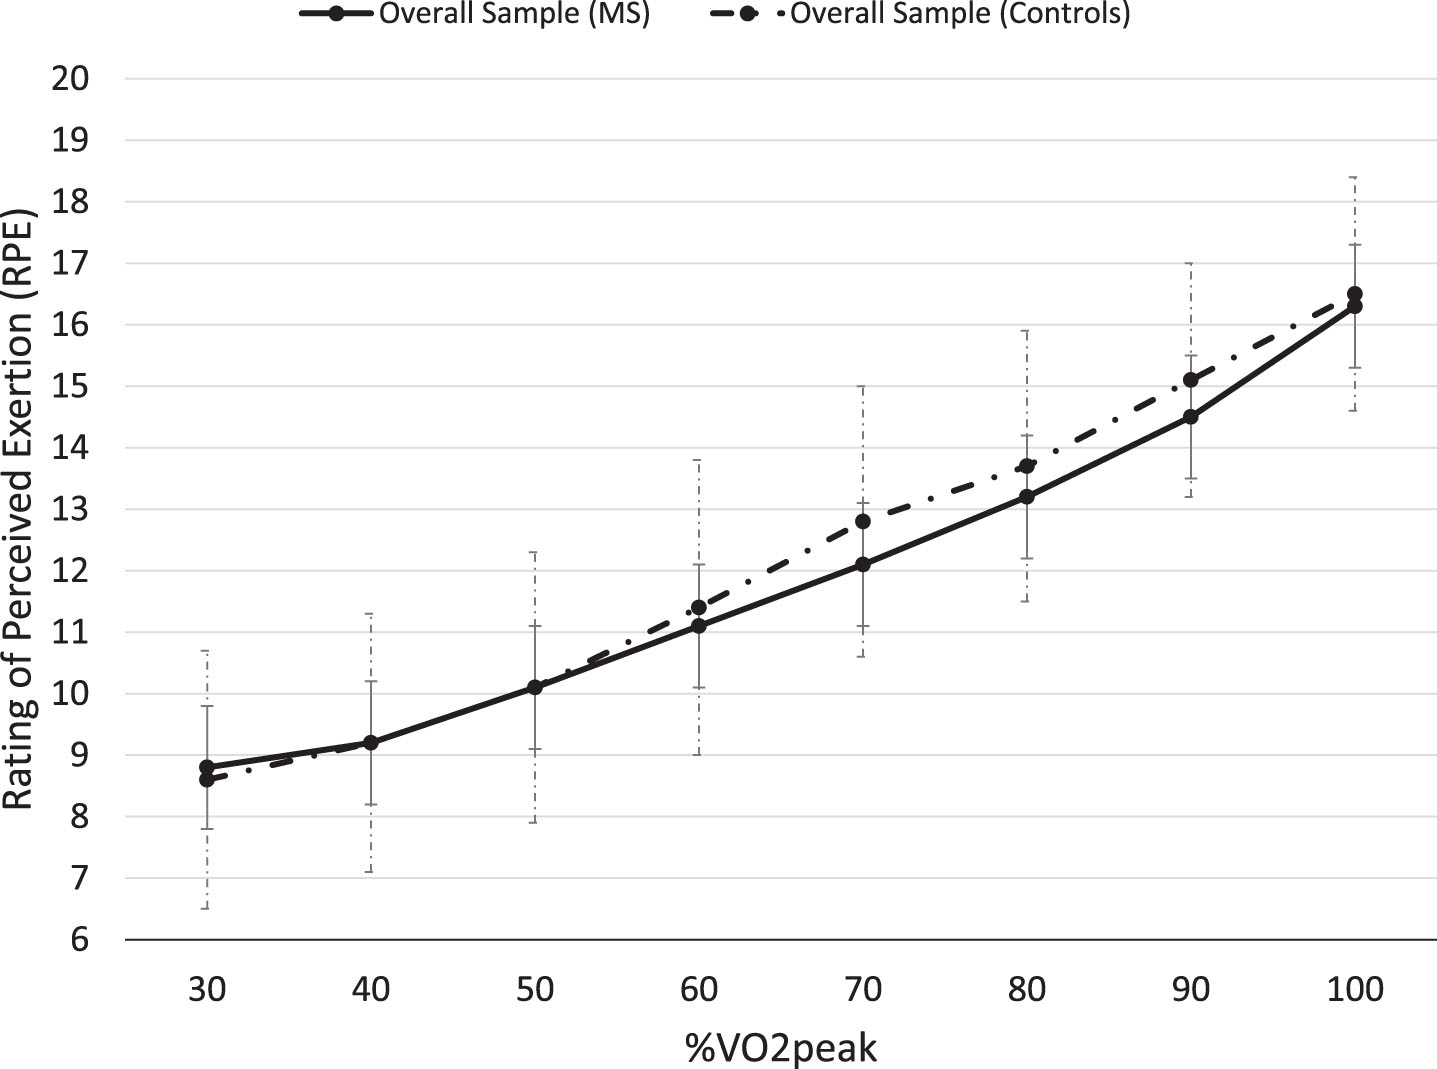
Mean RPE (±SD) as a function of relative exercise intensity (% VO2peak) for the overall sample of persons with MS (n = 134) and controls (n = 65).
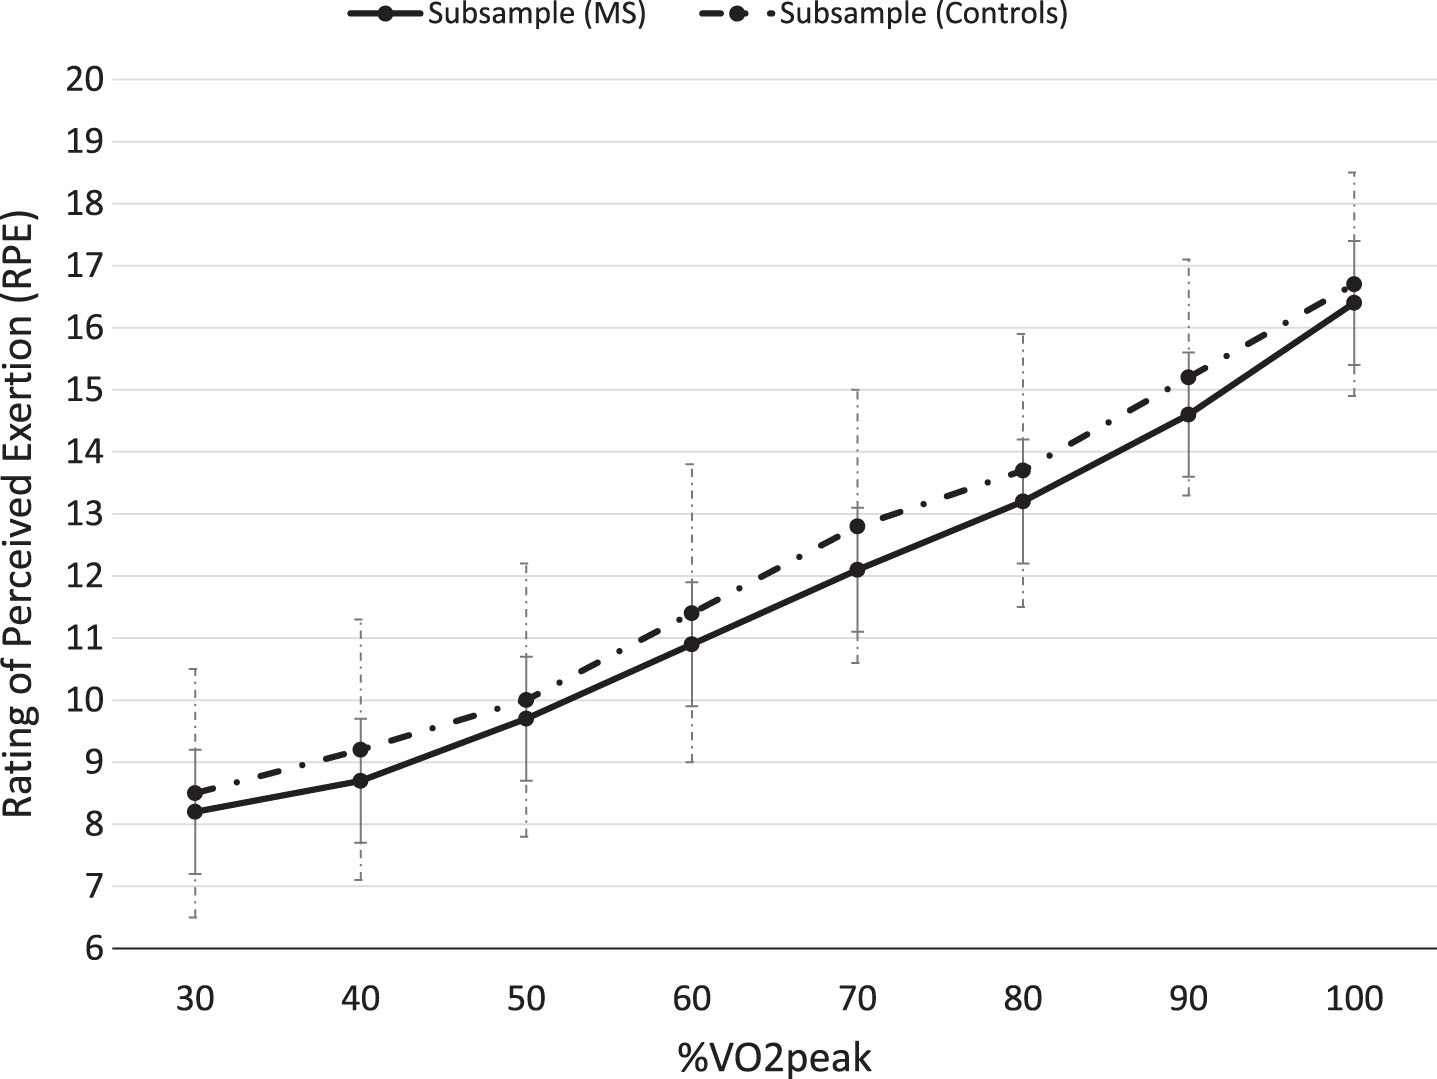
Mean RPE (±SD) as a function of relative exercise intensity (% VO2peak) for the subsample of persons with MS (n = 84) and controls (n = 57) (participants who were able to exercise at or above 120 W during the maximal exercise test).
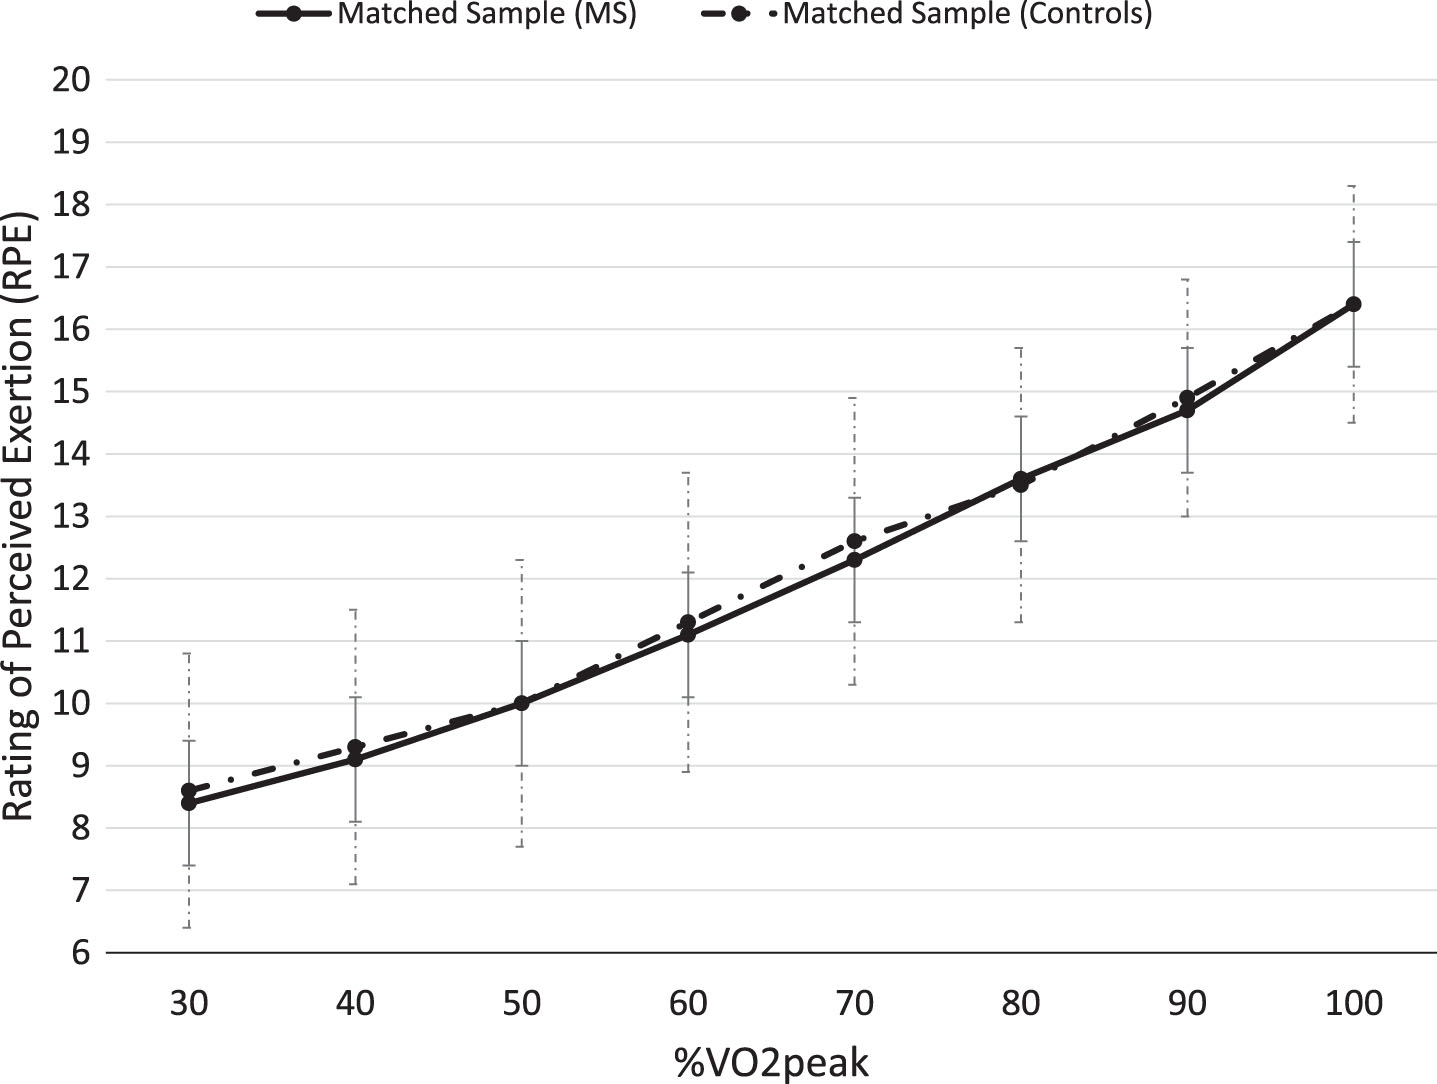
Mean RPE (±SD) as a function of relative exercise intensity (% VO2peak) for the sample of persons with MS (n = 55) and controls (n = 55) matched on sex, age (±5 years), and VO2peak (±3 mL/kg/min).
In the subsample, ANOVA revealed a significant main effect for exercise intensity (i.e., % VO2peak) [F(7,139) = 677.0, p < 0.05, ηp2 = 0.83], but not group (i.e., persons with MS vs. controls) [F(1,139) = 2.3, p = 0.13]. There was no statistically significant group×exercise intensity interaction [F(7,139) = 0.55, p = 0.79].
In the matched sample, ANOVA revealed a significant main effect for exercise intensity (i.e., % VO2peak) [F(7,108) = 851.0, p < 0.05, ηp2 = 0.81], but not group (i.e., persons with MS vs. controls) [F(1,108) = 0.16, p = 0.69]. There was no statistically significant group×exercise intensity interaction [F(7,108) = 0.32, p = 0.95]. Therefore, in the overall sample, subsample, and matched sample, RPE increased similarly between groups as a function of relative exercise intensity.
The purpose of the present study was to examine RPE using the Borg 6–20 RPE scale [10] during a maximal, incremental exercise test on a cycle ergometer in a large sample of persons with MS compared with healthy controls who were similar in age, sex, and BMI. Overall, our results demonstrate that RPE is a valid indicator of perceived effort during submaximal and maximal exercise in a large, diverse cohort of persons with MS across a range of fitness levels. Our results agree with those of a previous investigation that demonstrated persons with MS and controls with comparable VO2peak reported similar RPE to submaximal and maximal exercise, when measured using relative exercise intensities (% VO2peak) [13]. The novel findings of the current study demonstrate that persons with MS report significantly higher RPE to submaximal and maximal exercise when measured at absolute exercise intensities (W) compared with controls. However, these differences generally lost significance when including high-performing participants who were able to exercise at or above 120 W during the maximal exercise test (i.e., subsample of persons with MS and controls) and when matching persons with MS and controls on age, sex, and VO2peak.
When comparing peak exercise variables in our overall sample and subsample of persons with MS and age-matched controls, persons with MS consistently demonstrated lower peak exercise variables compared to healthy controls, including lower VO2peak, HRpeak, W, RER, VE, VAT (mL/kg/min), and TTE (Table 2). Therefore, the lower cardiovascular fitness (i.e., VO2peak) and reduced exercise capacity (i.e., RER and VE) in persons with MS that are often associated with the disease,13 might contribute to the differences in RPE at absolute (W) submaximal and maximal exercise compared to healthy controls. However, it has previously been suggested that afferent feedback from the skeletal muscles, heart, and lungs may not fully contribute to the perception of effort during exercise and that the sense of effort is centrally generated by forwarding neural signals from the motor or sensory areas of the cerebral cortex [27]. Our data support perceived exertion ratings as a valid indicator of exercise intensity (i.e. a valid measure of effort sense) because it would be expected that individuals of lower fitness would rate absolute exercise intensities as more effortful than their more-fit counterparts. When matched on fitness and/or expressing RPE relative to exercise capacity, these differences were eliminated; thereby providing further evidence that persons with MS perceive exercise similar to otherwise healthy persons.
When examining the differences between persons with MS in the overall sample (n = 84) and subsample (n = 57) (i.e., participants who were able to exercise at or above 120 W during the maximal exercise test), the overall sample reported higher disability compared to the subsample (i.e., median PDDS score of 2.0 vs. 1.0, respectively) as well as higher AD use (18.6% vs. 10.1%, respectively). Therefore, these results suggest that the disease might influence exercise capacity (i.e., WRpeak) in persons with MS with moderate disability. However, when measured using relative exercise intensities (% VO2peak), RPE was similar in both the overall sample and subsample and suggests that disability status may not affect perceived effort during exercise.
The current study was novel in that we further examined RPE at the VAT (mL/kg/minute). Our results demonstrated that persons with MS further reported a similar RPE at the VAT (mL/kg/min) compared to controls in the overall sample (11.7 (2.5) vs. 11.7 (2.5), respectively), subsample (11.3 (2.5) vs. 11.5 (2.6), respectively), and matched sample (11.6 (2.5) vs. 11.7 (2.6), respectively). However, the VAT was significantly lower in persons with MS compared to controls in the overall sample (14.0 (4.2) vs.16.6 (5.6), respectively) and subsample (15.3 (4.5) vs. 17.1 (4.6), respectively). These data agree with the vast majority of perceived exertion literature demonstrating the VAT as objective anchor point of effort sense, occurring between and ‘11’ and ‘13’ on Borg’s 6–20 scale [10]. For example, in a previous study, RPE at the lactate threshold did not significantly differ between trained and untrained men and women, despite large and significant differences in aerobic capacity and the percentage of VO2peak that the lactate threshold occurred at [28]. The lack of difference in RPE at the VAT between persons with MS and controls provides further support that RPE is a valid indicator of effort sense in this patient population.
The practical implications of this study involve the application of RPE values for prescribing exercise intensity in persons with MS with mild to moderate disability. Our results confirm that person with MS with mild to moderate disability may safely obtain an exercise stimulus of similar magnitude as healthy adults in the general population. Importantly, exercise prescriptions for persons with MS should be based on relative exercise intensities (i.e., % VO2peak) when examining exercise responses compared to healthy controls. Researchers and clinicians should therefore be able to base exercise prescriptions for persons with MS on ACSM RPE values and ranges recommended for healthy adults. ACSM guidelines propose an exercise intensity guide using the 6–20 Borg scale as 10–11 for low intensity, 12–13 as moderate intensity, and 14–16 as high intensity [29].
This study has several limitations. First, we did not assess symptoms in persons with MS, and symptoms of the disease, such as fatigue, may be associated with RPE. Second, we did not measure current physical activity or exercise behavior in the MS and control samples, which may have influenced exercise outcomes as previous research has demonstrated physical activity as a correlate of VO2peak [30]. Third, some participants were not included in the analyses due to invalid maximal exercise tests. Therefore, our results do not include participants with possibly altered or reduced exercise capacity. Fourth, we did not assess medication usage or comorbidities of the participants that may have affected performance on the maximal exercise test. Lastly, the sample of persons with MS was predominantly female and consisted of persons with relapsing-remitting MS with relatively mild to moderate disability; hence, our results may not be generalizable to the entire MS population. There were also several notable strengths that add to the scant RPE and MS literature including: a large and more generalizable sample of persons with MS; the application of standardized criteria for maximal effort, thus allowing for accurate comparisons of exercise intensity; comparison of both absolute and relative exercise intensities; and the ability to compare RPE in participants who were matched on aerobic fitness, which allowed for a more direct and definitive comparison of perceived effort across exercise intensities.
Conclusions
In summary, persons with mild to moderate MS generally perceive exercise as requiring similar exertion as healthy controls, as measured by the Borg 6–20 RPE scale. This is generally consistent with previous research involving small samples of persons with mild MS and further supports RPE as a valid indicator of exercise intensity in this patient population. Future research examining sex differences, associations with symptoms and levels of physical activity and sedentary behavior, and the influence of neural signals is warranted to further test the influence of MS on perceived exertion [31]. This is important for identifying the utility of RPE for exercise prescriptions and documenting adaptations to exercise training in persons with MS.
Conflict of interest
None to report.