
Abstract
INTRODUCTION:
The aim of this study was to investigate the association between gait parameters, gross motor function and physical activity (PA) in young people with cerebral palsy (CP).
METHODS:
Thirty-eight adolescents aged between 10–19 years with spastic CP in GMFCS levels I-III (mean [standard deviation] age 13.7 [2.4] yr; 53%female) were included in this cross-sectional study. Hip, knee and ankle joint excursion and stance time was assessed using 3D gait analysis. Self-selected walking speed was assessed during a timed 10 m overground walk and treadmill walking. Gross motor function was assessed using dimensions D and E of the Gross Motor Function Measure (GMFM-66). Moderate-to-vigorous PA, light PA and step-count were assessed using an accelerometer. Linear regression was used to examine associations.
RESULTS:
After adjusting for age, sex and GMFCS level, percentage stance time was associated with dimension E of the GMFM-66 (β= –0.29, 95%CI –0.54 to –0.05). There was no evidence that any other gait parameters were associated with GMFM-66 dimensions D or E. There was also no evidence that gait parameters or GMFM-66 dimensions D or E were associated with step-count or time in PA after adjusting for age, sex and GMFCS level.
DISCUSSION:
The findings provide an insight into the complexity of the relationship between gait quality or ability at the impairment level, function as measured in a controlled environment, and the performance of habitual PA, which is essential for health among children with CP.
Keywords
Introduction
Cerebral palsy (CP) is a permanent, non-pro-gressive disorder associated with an impairment of the developing fetal or infant brain [1]. It is a common cause of childhood physical disability worldwide and is characterised by abnormal fine and gross motor functioning [1]. In addition to abnormal tone, people with CP experience reduced muscle strength and aerobic fitness, musculoskeletal disorders, and often participate in low levels of physical activity (PA) [1–3]. Management of CP encompasses medical, surgical and therapeutic interventions, which typically aim to improve functioning as described by the World Health Organisation’s International Classification of Functioning, Disability and Health (ICF). According to the ICF, functioning refers to body structures and functions, activity and participation, where activity is described as the execution of a task by an individual and participation is involvement in a life situation [4].
Improving mobility is often a primary therapeutic goal for people with CP [5]. Many interventions to improve mobility target impairments in body structures and functions in order to optimise activity and participation. However, the effects of such treatments are often evaluated on only one level of the ICF [6, 7]. For example, the effect of orthopaedic surgery on mobility is often examined by assessing gait parameters, as a measure of body structures and functions [7]. Whereas the effect of exercise on mobility is often examined by assessing gross motor function, as a measure of activity [6]. Further, the effect of interventions on mobility in the context of a person’s usual environment is rarely examined [6, 7]. As functioning of an individual is context-dependent [4], a person’s mobility in a controlled environment (i.e., activity capacity) may differ to their mobility in their daily environment (i.e., activity performance) [8]. Guidelines in the United Kingdom recommend that children should participate in an average of at least 60 minutes of moderate-to-vigorous intensity physical activity (MVPA) per day across the week [9]. Although PA of any intensity can provide health benefits, MVPA is needed to achieve the maximum health benefits [9]. As many children with CP do not achieve sufficient MVPA [3], understanding the potential association between gait parameters, function and MVPA warrants further consideration.
The literature investigating the associations between gait parameters, gross motor function, and PA performance in a person’s daily environment is relatively limited. To date, there has been no investigation of the relationship between gait kinematics and both gross motor function and PA in the same cohort of children with CP. In relation to the association between gait parameters and gross motor function, Robinson found that the Gait Profile Score (GPS) differed between children in Gross Motor Function Classification System (GMFCS) levels I, II and III [10], with more impaired gait kinematics seen in those with poorer functional mobility. Molloy found a strong correlation (r = 0.70) between the Gait Deviation Index and total score on the Gross Motor Function Measure (GMFM) among children aged 4–17 yr in GMFCS levels I-IV [11]. Damiano and Abel found cadence, normalized velocity, hip knee excursion and percentage single support were associated with score on the GMFM among children aged [12]. Two studies have examined the association between gait kinematics and PA. Guinet and Desailly reported a correlation of 0.41 (Spearman’s rho) between the Gait Deviation Index (GDI) and step count in 25 adolescents with CP in GMFCS level I-II [13]. Wilson reported a stronger correlation of 0.58 between the GDI and step count in a larger sample of 55 children and adolescents aged 6 to 18 years [14]. However, neither study found an association between GDI and time in MVPA. Guinet and Desailly reported fair correlations between MVPA and key kinematic parameters at heel strike and toe off (spearman’s rho 0.3 to 0.33) [13]. However, these specific gait cycle points give a limited snapshot of an individual’s gait deviation.
Given that the ICF places an emphasis on the in-teraction between body functions and activity, understanding the association between gait parameters, gross motor function and habitual PA is important for awareness of the impact of CP on the individual and identification of appropriate interventions. However, there is a lack of evidence regarding the association between gait and gross motor function, and gait and habitual PA, respectively, in a single cohort of people with CP.
The aim of this study was to investigate the association between gait parameters, gross motor function and PA in young people with CP.
Methods
Data for this cross-sectional study were obtained from the baseline assessment of a randomised controlled trial that aimed to investigate the effects of strength training for adolescents with CP [15]. Recruitment took place between August 2015 and May 2017. Participants were recruited throughout England from eight National Health Service (NHS) trusts, a special education needs school, a University, a primary care organisation, national organisations for people with disabilities, and by word of mouth. Inclusion criteria were a diagnosis of spastic CP, aged 10–19 years, ability to walk independently with or without a mobility aid (i.e., GMFCS levels I-III), and an ability to activate the ankle plantarflexors as determined by palpation. Adolescents were excluded if they had orthopaedic surgery of the lower limbs in the past 12 months, had botulinum toxin type A injections or serial casting in the past 6 months, or had insufficient cognition to comply with assessment procedures and the training programme delivered as part of the trial. Participants aged 16 years and over gave written informed consent. Participants under 16 years of age gave written informed assent and a parent or guardian provided written informed consent. The trial was approved by Brunel University London’s College of Health and Life Sciences Research Ethics Committee and the Surrey Borders Research Ethics Committee (ref: 15/LO/0843).
Gait parameters
The gait parameters examined in this study were total sagittal plane excursion of the hip, knee and ankle (i.e., the difference between maximal and minimal angles over one full gait cycle), percentage stance time, and self-selected walking speed. These parameters were selected in order to provide clinical information relevant to joint movement during gait. Reduced sagittal excursion at the hip, knee and ankle has been shown in pathological gaits in CP, for example, at the knee and ankle in crouch [16] and at the hip, knee and ankle in children with hemiplegia who also show excessive muscle coactivation [17]. Variation in gait patterns was expected among participants, given the inclusion of adolescents in GMFCS levels I, II and II. Therefore, analysis of total sagittal plane excursion was preferred over joint angles at single gait cycle points, which could differ considerably depending on the participant’s pattern.
Kinematic data during treadmill walking were collected using a computerized motion capture system (Motion Analysis, Motion Analysis Corporation, Santa Rosa, CA, USA) with 8 infrared cameras. Two researchers with over 5 years of experience each in 3D motion capture research and PhDs in closely related areas collected the data. The Motion Analysis software Cortex was used for the processing of kinematic data (150 Hz).
Participants were asked to walk on a fully instrumented treadmill (Bertec Corporation, Columbus, Ohio) at their preferred walking speed. Prior to testing, participants performed a familiarisation session to ensure they were comfortable walking on the treadmill, and to establish a comfortable preferred treadmill walking speed as previously described [18]. Following a mandatory two minute rest period after familiarisation, participants were asked to walk on the treadmill at their preferred walking speed for two minutes to ensure a minimum of 30 gait cycles were collected for further analysis [19].
Knee, ankle and hip joint kinematics were measured from a body motion analysis marker set. For this purpose, reflective markers were placed on the anterior superior iliac spine, sacrum, the greater trochanters, mid-thigh, medial and lateral femoral epicondyles, on each tibia (midway between the ankle and knee), the medial and lateral malleoli, the heads of the first and fifth metatarsals and the calcaneus. Kinematics from the most affected leg, as reported by the participant, were calculated in Visual 3D software using the conventional gait model [20], with a modification at the foot. Where the participant reported that both sides were equally affected, data from the right leg were used. Joint angles were computed as the angles between the proximal and distal segment of the relevant joint with the primary axis of the foot segment defined as the line between the ankle joint centre (rather than the calcaneus) and the mid-point of the first and fifth metatarsal heads, as previously described [21]. The foot was calculated in this way due to intermittent occlusion of the calcaneus marker by the treadmill apparatus, but the use of the ankle joint centre did not affect total ankle joint range.
In addition to gait parameters collected during treadmill walking, self-selected overground walking speed was measured as this is potentially a more feasible method of assessing gait during routine clinical practice. Preferred walking speed during two minutes of treadmill walking was recorded. Participants were instructed to walk at a self-selected speed over approximately 15 metres. The time taken to walk 10 metres was recorded. Participants repeated this three times and the average speed of the three trials was used in analysis. Walking speed normalised to height was used in analyses.
Gross motor function
Gross motor function was assessed using dimensions D and E of the GMFM-66, which were administered by two physiotherapists and video-recorded. A specialist paediatric physiotherapist, with training and experience of scoring the GMFM-66, scored performance. The GMFM-66 is valid and reliable in children with CP [22, 23]. Dimension D evaluates activities in standing. Dimension E evaluates activities in walking, running and jumping. A higher score indicates better gross motor function.
Physical activity
Daily light PA, moderate-to-vigorous PA and step-count were measured using an Actigraph wGT3X accelerometer (Actigraph, USA) worn on the waist above the right hip or least affected side in the case of significant asymmetry, in the midaxillary line. Participants were asked to wear the accelerometer for 7 consecutive days. Participants with at least 2 days of monitoring were included in the analysis as two days is necessary to achieve a reliability coefficient of 0.70 for adolescents with CP [24]. Data were analysed using Actilife Software. Non-wear time was identified using an algorithm developed by Choi [25]. Non-wear time was identified as a period of ≥90 minutes of no movement with a spike tolerance of two minutes. Cut-points validated in children and adolescents with CP were applied to identify time spent in light physical activity (LPA) and MVPA [26].
Statistical analysis
Data were analysed using Stata version 15.0 (StatCorp LLC, TX, USA). Distribution of data was explored using histograms and Q-Q plots. We removed GMFM-66 D score for one participant with an outlying value, 5 standard deviations from the mean. Continuous data were summarised as mean and standard deviation or median and interquartile range if data were not normally distributed. Categorical variables were summarised as frequency counts. Linear regression was used to explore associations between gait parameters (i.e., hip, knee and joint excursion, percentage stance time, normalised overground and treadmill walking speed), gross motor function (i.e., GMFM-66 dimension D and E), and PA (i.e. time in MVPA and LPA, and step-count). Univariable models (i.e., linear regression models with one dependent variable and one independent variable) were fitted to examine separate associations between each gait parameter (i.e., independent variable) and GMFM-66 D score, GMFM-66 E score, time in LPA, time in MVPA, and step-count (i.e., dependent variables). Multivariable models (i.e., linear regression models with one dependent variable and more than one independent variable) were fitted to examine the associations between each independent variable and each dependent variable after adjusting for age, sex and GMFCS level. We explored the effect of additionally adjusting for distribution but chose not to include it in final models because there was no evidence that it changed the coefficient for the independent variable of interest by > 10%after age, sex and GMFCS level had been adjusted for. To explore if gross motor function and gait parameters jointly explained variation in PA, we fitted three linear regression models with GMFM-66 D and E score, hip, knee and ankle joint angle, normalised overground walking speed, and percentage stance time as independent variables and (1) MVPA, (2) LPA and (3) step-count as dependent variables. For each model, F-tests were used to test the null hypothesis that gait parameters and gross motor function were not jointly associated with PA.
Assumptions of linear regression, namely normally distributed residuals, homoscedasticity, and a linear relationship between each independent variable and dependent variable conditional on the other independent variables in the model, were checked using appropriate plots. In models where GMFM-66 D and E score were dependent variables, there was some evidence that residuals were not normally distributed. Therefore, for these models a bootstrapping procedure was used. The bootstrap provides an alternative way to estimate valid standard errors and confidence intervals without relying on assumptions about distributions [27]. It involves calculating β in multiple “bootstrap samples” that are sampled with replacement from the original sample [27]. Bias corrected and accelerated bootstrap confidence intervals (CIs) were calculated from 2,000 replicates [28]. As exact p values are not calculated when a bootstrapping procedure is used, the p value associated with each effect estimate was inferred from the confidence interval (CI) (i.e., p < 0.05 or p < 0.01 where the 95%CI or 99%CI, respectively, did not include the null value).
Results
Thirty-eight adolescents with complete data on gait parameters were included in the study. Participant characteristics are described in Table 1.
Description of kinematic variables, walking speed, gross motor function and physical activity
Description of kinematic variables, walking speed, gross motor function and physical activity
SD: standard deviation. aData presented as median (interquartile range); bnormalised to height.
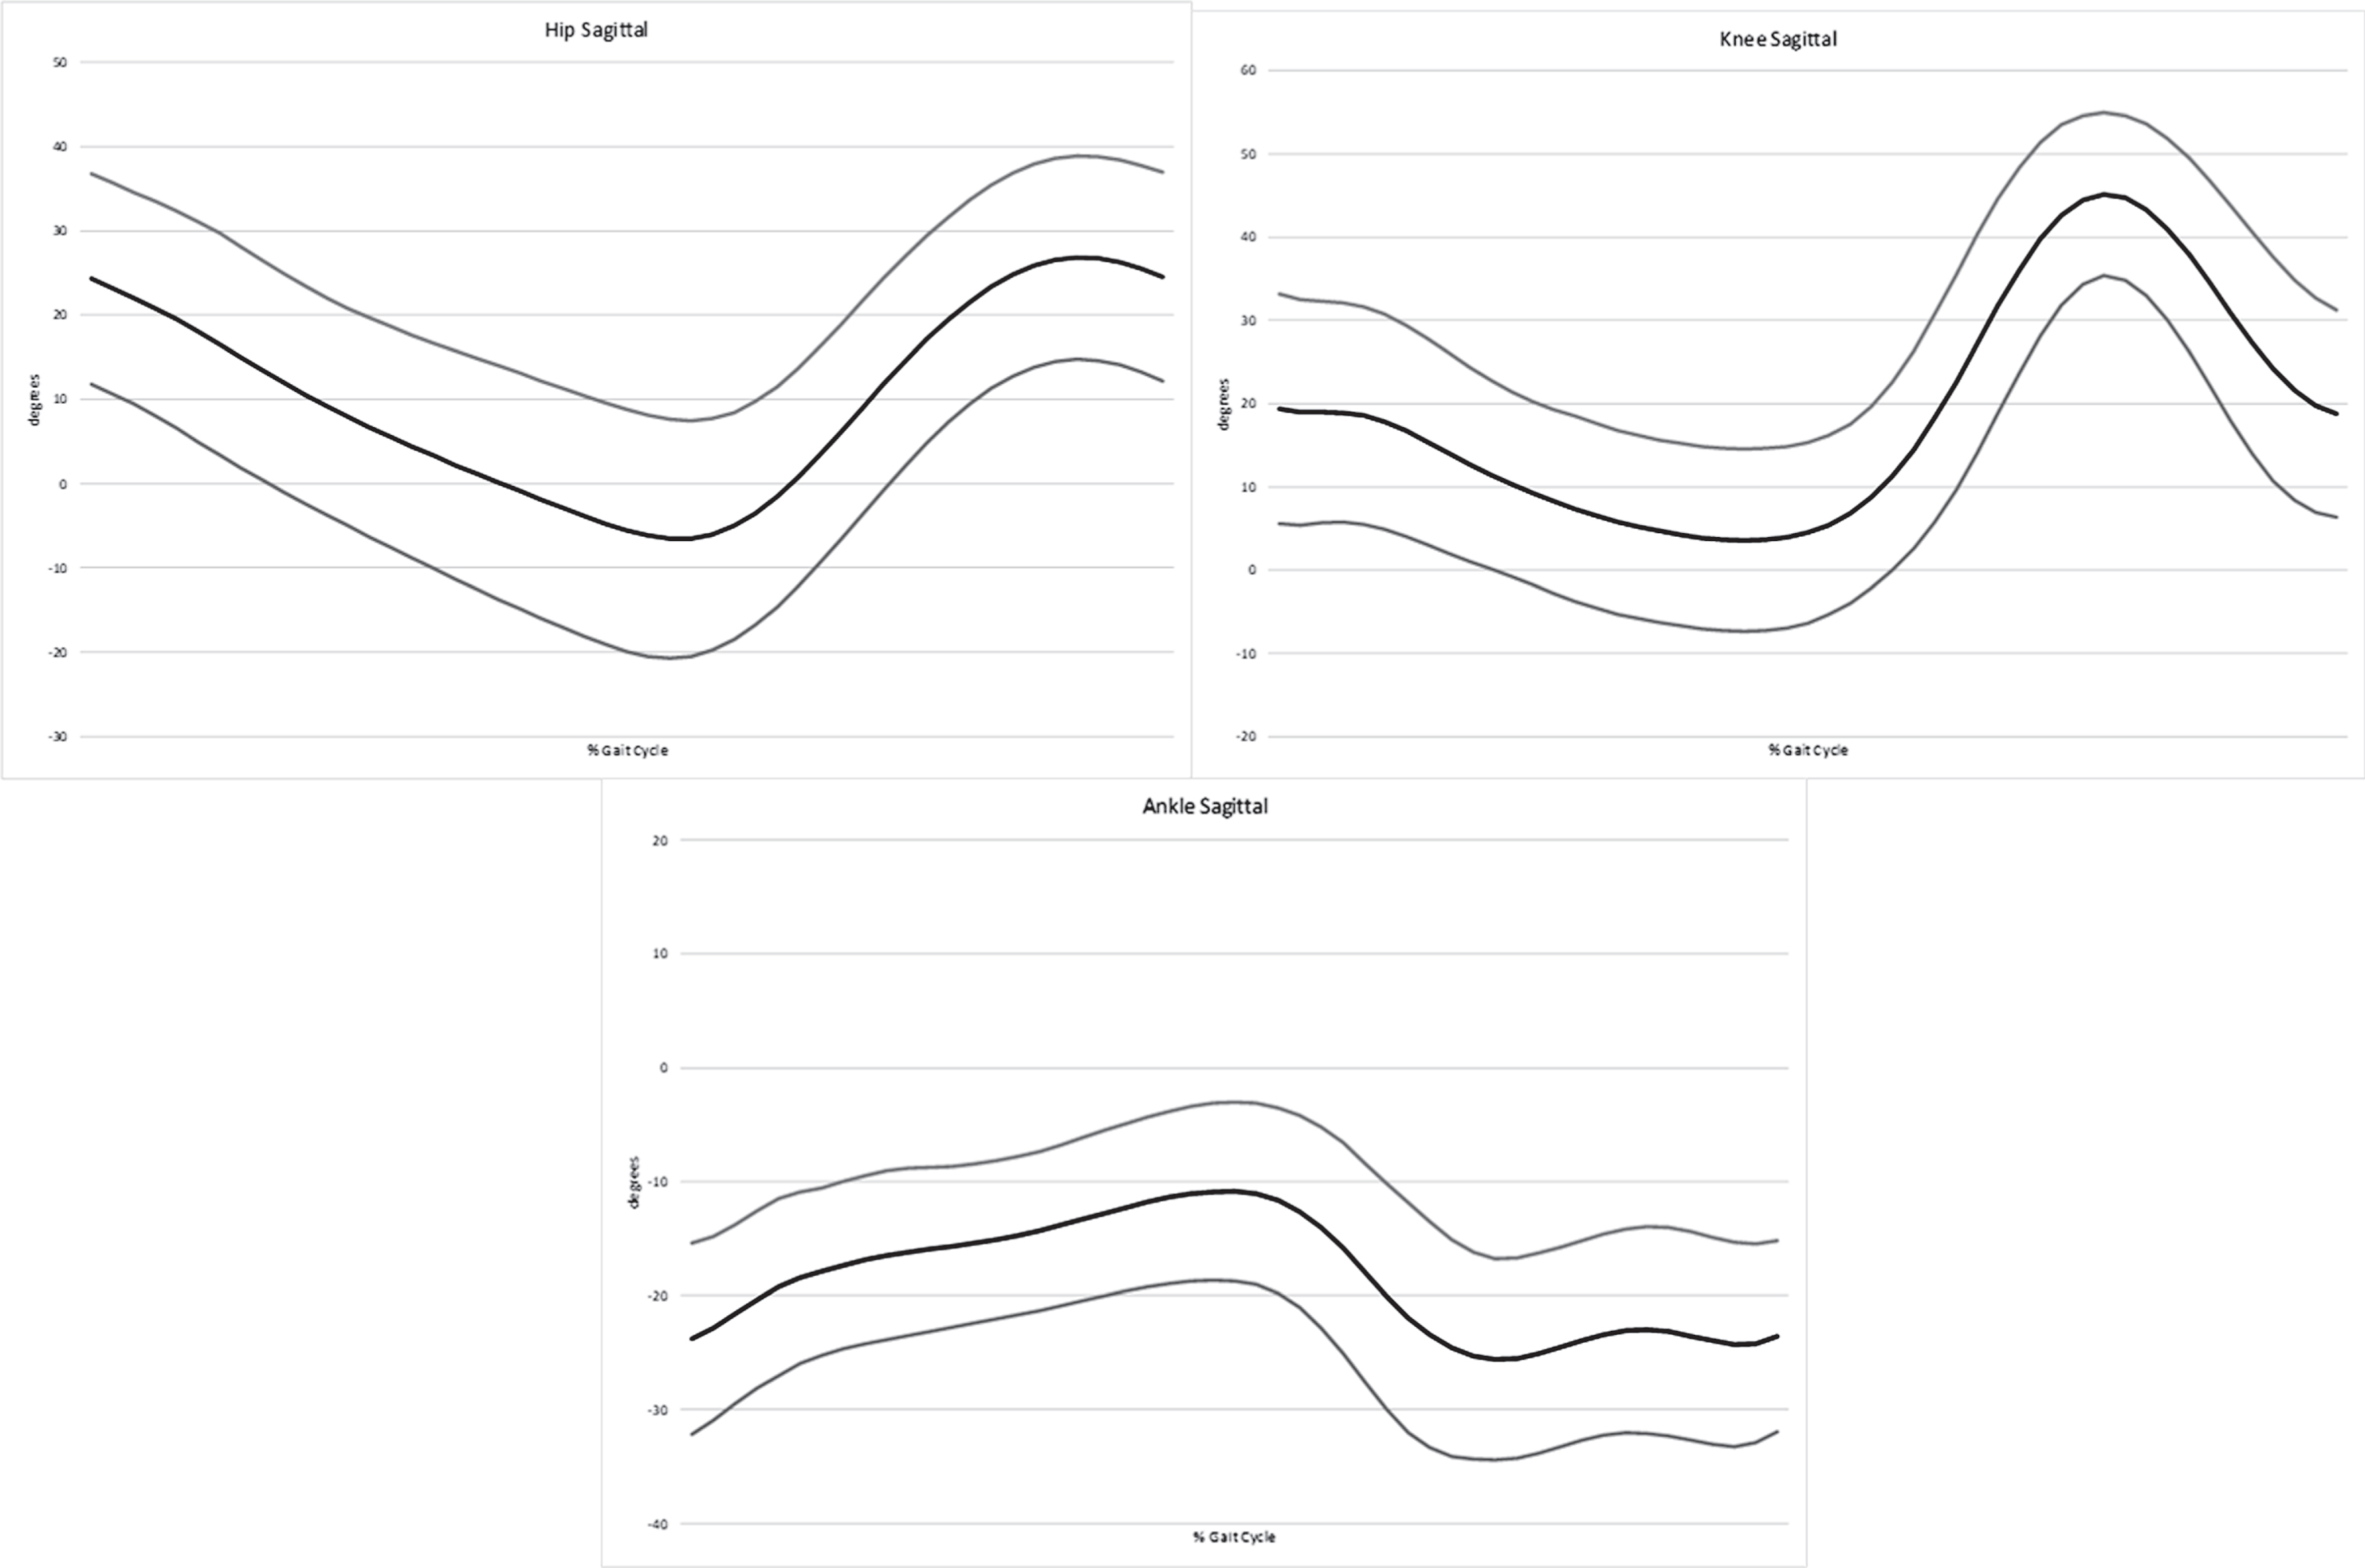
Hip, knee and ankle joint excursion, percentage stance time, self-selected walking speed during overground walking and treadmill walking, GMFM-66 D score, GMFM-66 E score, light PA, moderate-to-vigorous PA and step-count are described in Table 2. Figure 1 shows hip, knee and ankle kinematics over the gait cycle in the sagittal plane.
Participant characteristics
SD: standard deviation.
Additional kinematic graphs.
Associations between gait parameters and gross motor function are presented in Table 3. In unadjusted analyses, normalised overground walking speed and percentage stance time were associated with dimensions D and E of the GMFM-66, and normalised treadmill walking speed was associated with dimension D of the GMFM-66. However, after adjusting for age, sex and GMFCS level, only percentage stance time remained associated with dimension E (β= –0.29, 95%CI –0.54 to –0.05). Hip, knee and ankle joint excursion were not associated with dimension D or E in unadjusted or adjusted analysis.
Unadjusted and adjusted associations between gait parameters and gross motor function
aadjusted for age, sex and GMFCS level; bexact p value not provided as bootstrapping procedure was used to obtain β and associated confidence interval; cnormalised to height. CI: confidence interval. Bold text indicates p < 0.05.
Associations between gait parameters and PA are presented in Table 4. There was no evidence that hip, knee or ankle joint excursion were associated with LPA, MVPA or step-count. There was also no evidence that percentage stance time or normalised treadmill walking speed were associated with LPA, MVPA or step-count. Normalised overground walking speed was associated with daily step-count and time in MVPA, but not LPA, in unadjusted analyses. However, after adjusting for age, sex and GMFCS level there was no evidence that normalised overground walking speed was associated with LPA, MVPA or step-count.
Unadjusted and adjusted associations between gait parameters and physical activity
aadjusted for age, sex and GMFCS level; bnormalised to height. CI: confidence interval. Bold text indicates p < 0.05.
When all gait parameters, GMFM-66 D and GMFM-66 E score were entered into a regression model as independent variables, hip joint excursion was associated with step-count (p = 0.046; Table 5). A one degree increase in hip excursion was associated with an increase of 133 steps per day. However, there was no evidence that gait parameters and gross motor function were jointly associated with step-count (p =0.133), MVPA (0.209) or LPA (p = 0.406). In combination, gait parameters and gross motor function explained 33%of the variance in step-count (R2 =0.325), 29%of the variance in MVPA (R2 = 0.289) and 22%of the variance in LPA (R2 = 0.225).
Associations between gait parameters, gross motor function and physical activity
CI: confidence interval; LPA: light physical activity; MVPA: moderate-to-vigorous activity.
The results of this study indicate percentage time spent in stance is negatively associated with gross motor function, specifically activities relating to walking, running and jumping. After controlling for age, sex and GMFCS level, a 1%increase in stance time is associated with on average a –0.29 point reduction on GMFM-66 dimension E score. Gait parameters and function were not associated with step-count or time in PA after adjusting for age, sex and GMFCS level. Similarly, in combination, gait parameters and function were not predictive of step-count or time in PA and explained a relatively small proportion of the variance in these outcomes.
Few studies have examined associations between gait parameters, gross motor function and PA. Molloy et al. reported a strong association between the GDI and total score on the GMFM in children and adolescents in GMFCS levels I-IV [11]. However, potentially confounding variables such as age, sex and GMFCS level were not adjusted for when examining this association. Similarly to this study, Damiano and Abel reported unadjusted associations between percentage single support, normalised velocity and score on the GMFM among 32 children aged 3–18 years [12]. After adjusting for age, sex and GMFCS level, we found that walking speed did not remain associated with GMFM-66 dimensions D or E. Damiano and Abel also found that hip knee excursion was associated with GMFM score. Lack of agreement between our findings may be due to differences in the age range of the sample and the use of the full GMFM score. The variance of full GMFM score and the variance of hip joint excursion are likely bigger among children aged 3–18 years compared to children aged 10–19 years, and may explain why an association was observed by Damiano and Abel.
We did not find that gait parameters or function were associated with step-count or time in MVPA after adjusting for age, sex and GMFCS level. However, when all gait parameters and GMFM-66 dimensions D and E were included together in multiple linear regression, hip joint excursion was independently associated with step-count. A one degree increase in hip excursion was associated with an average increase of 133 steps per day. A previous study, examining associations between a set of 54 kinematic and spatio-temporal parameters, step-count and MVPA among adolescents with CP, found that hip flexion at toe off, knee flexion at heel strike and ankle flexion at heel strike, were weakly and negatively correlated with MVPA [13]. The same study found GDI and stance duration were weakly correlated with step-count but were not correlated with MVPA. A moderate correlation between GDI and step-count has also been observed among children with CP [14]. These findings suggest that gait parameters may be weakly correlated with performance of steps in daily life but not general activity.
However, gait parameters and function still explained relatively little of the variance in step-count. This, in combination with the limited number of associations we observed between gait impairments, function, and PA, emphasise the important contribution of environmental and personal factors to the interaction between body structures and functions and activity, as outlined by the ICF [4]. Associations between impairments and activity limitations, either in a controlled environment or a person’s usual environment, are influenced by contextual factors. Motivation and self-efficacy play an important role in participation in PA among adolescents with CP [29, 30], which may be unrelated to impairments. Other barriers include lack of access to appropriate equipment, inadequate staffing within schools, transport to activities, and lack of inclusive sport opportunities [29, 30].
Study limitations
Limitations of this study include the relatively small sample and lack of applicability of findings to adolescents with moderate motor impairment, given that only two participants were in GMFCS level III. A strength of the study is that we adjusted for age, sex and GMFCS level, which confounded a number of associations between gait parameters, function and PA as evidenced by differences between unadjusted and adjusted β coefficients. These confounders were not controlled for in previous studies. We calculated separate scores for GMFM-66 dimension D and E, rather than calculating a score for the full GMFM-66, as we hypothesised that associations between gait parameters, physical activity and function may differ for function relating to standing (i.e., GMFM dimension D) and function relating to walking running and jumping (i.e., GMFM dimension E). We also believed these specific associations are of interest to clinicians. However, it should be noted that these scores on the individual dimensions of the GMFM-66 may not be reflective of a person’s full GMFM-66 score. While abbreviated approaches for estimating the full GMFM-66 score are accurate at a single time point, they are less accurate at estimating change in the full GMFM-66 over time [32].
Conclusion
This study found percentage time spent in stance is negatively associated with function assessed in a controlled environment, specifically activities relating to walking, running and jumping. Gait parameters and function were not associated with step-count or time in PA after adjusting for age, sex and GMFCS level. The findings provide an insight into the complexity of the relationship between gait quality or ability at the impairment level, function as measured in a controlled environment, and the performance of habitual PA, which is essential for health among children with CP.
Footnotes
Acknowledgments
Action Medical Research and the Chartered Society of Physiotherapy Charitable Trust have jointly funded this project, and it is supported by a generous grant from The Henry Smith Charity (GN2340).
Conflict of interest
The authors have no conflict of interest to report.