
Abstract
INTRODUCTION:
Approximately 20% of patients are not satisfied following Total knee arthroplasty (TKA). The ability to identify patients at risk of poor outcomes in the early-postoperative period following TKA could inform the development of targeted treatments with the ability to improve outcomes for these patients. This prospective cohort study aimed to identify early post-operative, prognostic factors for patients experiencing dissatisfaction and poor outcomes at 12-months post TKA.
METHODS:
Patients (n = 185) were recruited from TKA waiting lists at a single site, completed measures of pain intensity, neuropathic pain, anxiety, depression, generic and disease specific health related quality of life (HRQoL), satisfaction and expectations, at discharge from hospital; three weeks post-surgery and again at 1 year. ROC curve analysis identified which variables best predicted patients experiencing dissatisfaction (VAS < 5/10) and poor outcomes (Western Ontario and McMaster Universities Arthritis Index (WOMAC)<40) at 12-months.
RESULTS:
The strongest prognostic factors for dissatisfaction were low HRQoL (EQ5D3L) at both day of discharge (AUC = 0.812) and three weeks post-surgery (AUC = 0.810), and high pain levels (WOMAC pain sub-scale) at 3-weeks post-TKA (AUC = 0.796). The strongest prognostic factors for poor outcomes were poor function (WOMAC function sub-scale) at three weeks post TKA (AUC = 0.815); low HRQoL (EQ5D3L) at three weeks post-TKA (AUC = 0.783) and high levels of pain (WOMAC pain sub-scale) at 3 weeks post-TKA (AUC = 0782). Anxiety and depression at 3-weeks were also prognostic factors for dissatisfaction (AUC = 0.629 & AUC = 0.686) and poor outcomes (AUC = 0.632 & 0.713) at 12-months.
CONCLUSION:
This single site cohort study suggests that patients with low HRQoL, high pain levels, poor function, anxiety, and depression in the first three weeks following TKA are at risk of dissatisfaction and poor outcomes at one-year post-surgery.
Introduction
Approximately 10–20% of patients are not satisfied after Total knee arthroplasty (TKA), which equates to between ten and twenty thousand individuals in the UK each year [1]. The individual and economic impact of this is not fully understood; however, it is likely to be significant as patients with persistent pain following TKR often require investigations (41%) and revision surgeries (54%) [2, 3].
The primary reason individuals cite for undergoing TKA is pain relief [4]. Whilst the relationship between, persistent pain, poor function and dissatisfaction following TKA is well established; it is not without complexity [5]. Satisfaction is a multi-factorial outcome measure which is linked to many factors such as expectations and societal issues such as isolation [6]. Data suggests that some patients are satisfied with their outcomes, despite high pain levels and limited function, whilst the opposite is also reported [6].
It remains a challenge to reliably measure success following TKA and identify individuals who will do well, and who will not following TKA [7]. Research investigating pre-operative prognostic factors for poor outcomes following TKA has been plentiful; yet the outcomes have been contradictory and resulting predictive models have been counter intuitive. For example, one model predicted that patients who had no difficulty getting off the toilet were more at risk of poor outcomes than those with moderate to severe difficulties [8–10]. It is likely therefore that the drivers of poor outcomes and persistent pain post-TKA are both complex and peri-operative and that individually targeted interventions are likely to provide best outcomes [11].
There is a need therefore for high-quality research investigating early post-operative risk factors of poor outcomes after TKA; as few studies have investigated whether risk factors present in the early post-operative phase following TKA reliably predict long term outcomes. Logically, the earlier individuals at risk of problems are identified, the more chance there is to provide interventions which reduce the negative impact of them [7].
This prospective cohort study therefore examined whether validated self-reported measurement tools (measuring pain intensity, neuropathic pain, function, stiffness, anxiety, depression, expectations, satisfaction and health-related quality of life) taken at day of discharge from hospital and three weeks post-surgery were able to predict patients experiencing poor outcomes as well as dissatisfaction at twelve months. The ability to reliably identify patients at risk of poor outcomes and dissatisfaction, so early in the post-operative recovery could lead to the development of early, targeted interventions to be tested in future research trials.
Methods
Ethical approval for the study was granted by the Health Research Authority (ref.16/NW/0142). Two hundred participants were recruited from the TKA surgical waiting lists at a single elective orthopaedic NHS hospital trust between June 2016 and July 2017.
Inclusion criteria for the study included those undergoing primary TKA or uni-condylar knee arth-roplasty for OA only, aged over 55. Exclusion criteria included diagnosis of inflammatory arthropathies, further arthroplasty planned in the next 12-months and impairment of understanding (eg. unable to speak / read English, Dementia).
Participants were consented pre-operatively and completed the measurement tools (Table 1) at day of discharge (+/- 2 days) from hospital. Participants then completed the same outcome measures, as well as the WOMAC questionnaire at three weeks (+2 weeks / –1 week) and 12 months (+/–2 months) post-surgery and returned them by post. The WOMAC questionnaire is a 24-item, patient reported outcome measure, with sub-scales for pain, stiffness, and function, commonly used for the evaluation of outcomes following TKA [12]. The WOMAC questionnaire was not included at day of discharge as too many of the questions relating to function would be irrelevant to subjects at this point of their recovery. Data received outside of the time points was withdrawn from the analysis. A pragmatic sample of two hundred patients consented to take part in the study, however fifteen patients did not have surgery, leaving 185 patients recruited to the study. More females (103), than males (82) were recruited and participants had a mean age of 70 years old (SD 8.6; Range 50–90). Participants who completed the twelve-month outcome measures and submitted data at one of the earlier time points (138 participants; 75%) were included in the final analysis (Fig. 1). Data has been reported in line with The Strengthening the Reporting of Observational Studies in Epidemiology (STROBE) Statement (Appendix 1) [17].
Measurement tools used to identify prognostic factors
Measurement tools used to identify prognostic factors
WOMAC
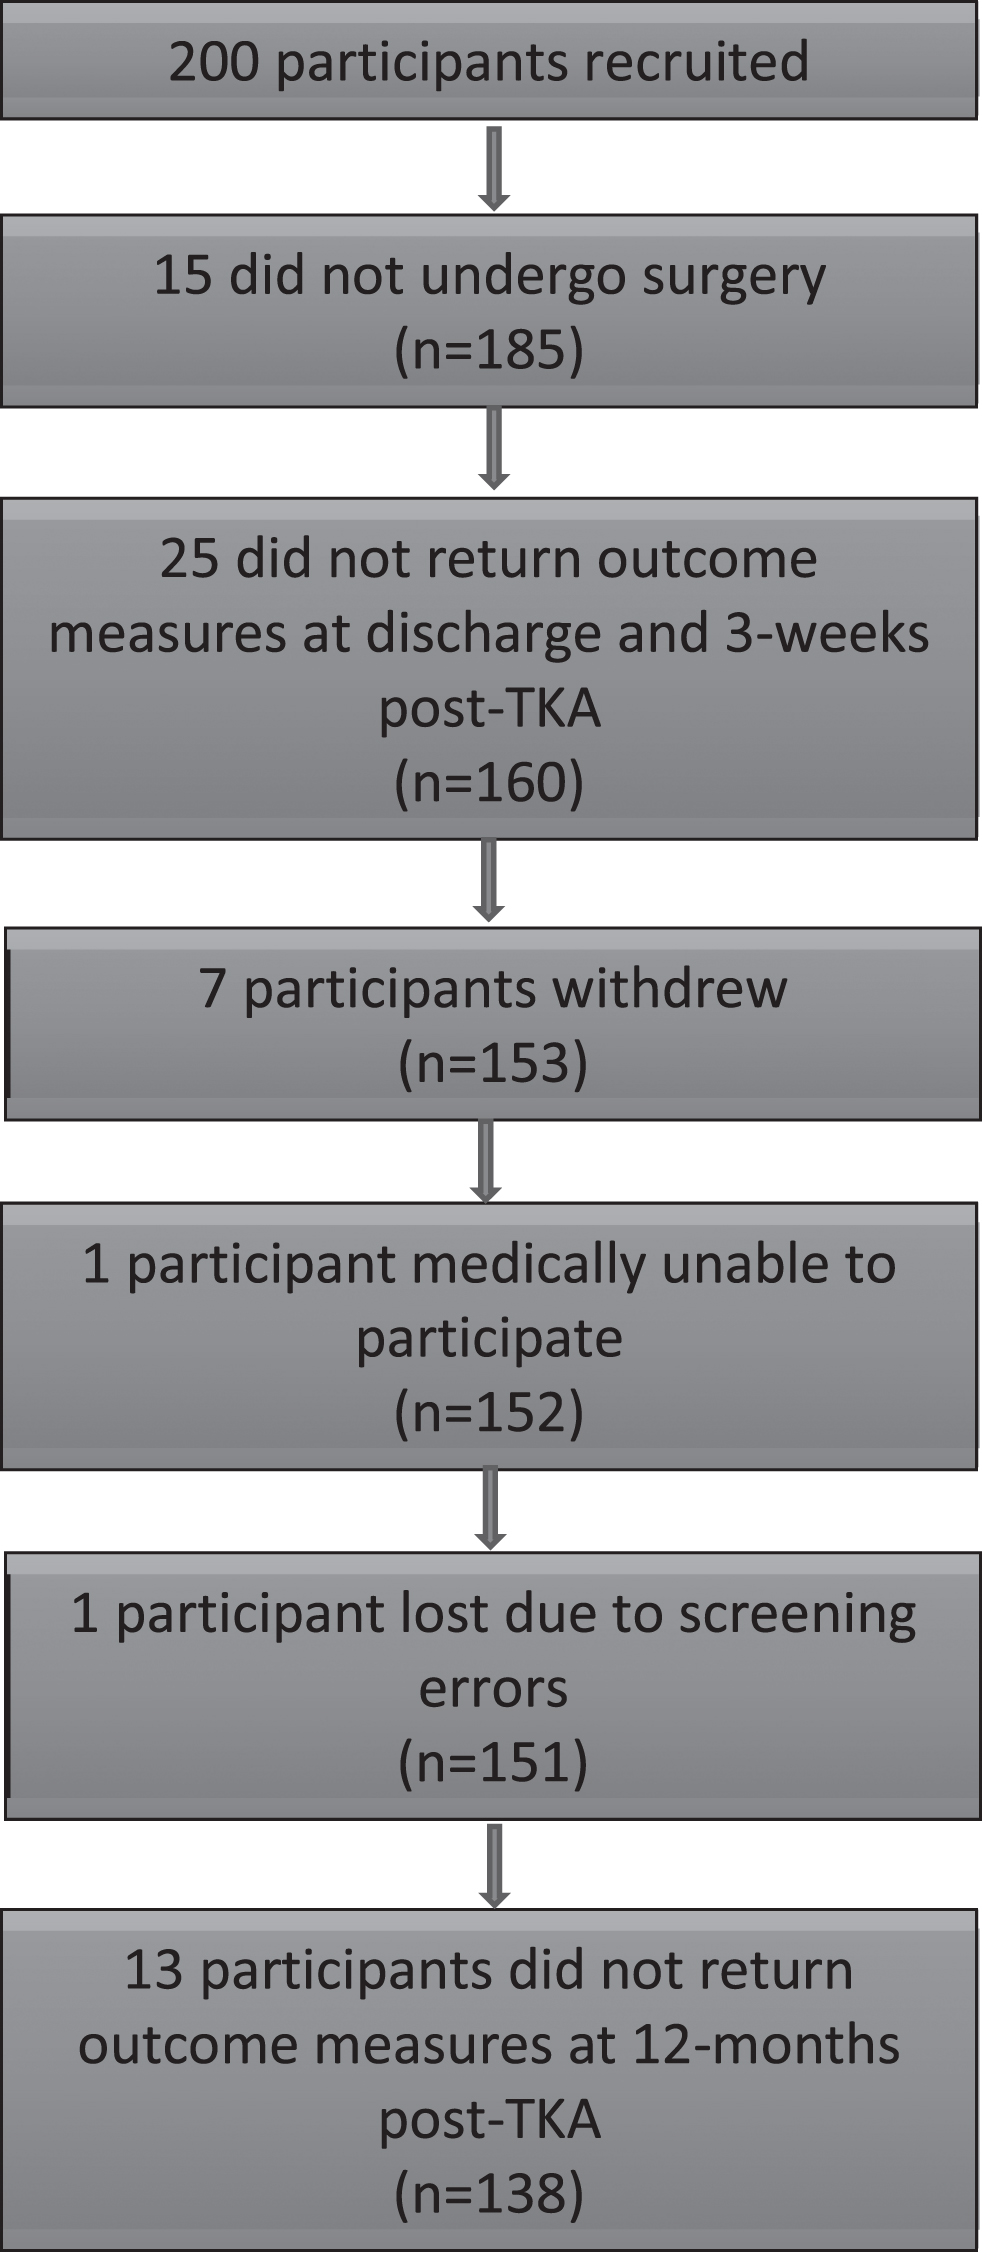
Recruitment flow diagram.
Participants experiencing poor outcomes at one-year post-TKA, were defined as those who scored below forty on the WOMAC outcome measure. When scored in reverse, this cut off point has demonstrated to identify patients who are dissatisfied with their outcomes [15, 16]. Dissatisfaction was determined by asking a single question, ‘overall, how satisfied are you with your knee replacement so far?’ A visual analogue scale was provided from 0–10 (0 = completely dissatisfied, 10 = completely satisfied). Dissatisfaction was determined by scores of less than 5/10 at one-year post-surgery, as this cut off point has been used in similar research to define participants who are more dissatisfied than satisfied9. The variables to explore were determined by a scoping review of the literature by the author group.
Data analysis
Of the one hundred and thirty-eight participants included in the final analysis; one hundred and nine (78.9%) provided complete data sets. Thirteen failed to provide data at hospital discharge (13/138; 9.4%) and sixteen participants (16/138; 11.6%) failed to provide data at three weeks. All data described in this analysis, will be presented as a percentage of the completed data sets.
Differences in the baseline characteristics of participants (Table 3) were calculated using the Fisher’s exact test to compare gender; Kendall’s tau-b to compare BMI and the Mann-Whitney test to analyse age.
Characteristics of the 138 patients included in the final analysis
Characteristics of the 138 patients included in the final analysis
Comparison of the characteristics of patients in the final analysis
Statistically significant relationships between the variables and dissatisfaction and poor outcomes were calculated using the Mann-Whitney test. P-values =< 0.05 were accepted as statistically significant. A receiver operating characteristic (ROC) curve analysis was used to analyse the ability of each variable to predict those who were dissatisfied and experiencing poor outcomes. ROC curve analysis plots specificity against sensitivity to produce a curve where the area under the curve (AUC) demonstrates the relationship between the variables. The closer the AUC value is to 1, the better the discriminatory performance of the test.
Secondary analysis of the data was performed on the variables which were statistically significant prognostic factors for dissatisfaction and poor outcomes at 12-months post-surgery. The sensitivity and specificity with which the worst 20% of scores for each variable, identified the patients who experienced dissatisfaction (VAS < 5/10) and poor outcomes (WOMAC < 40) at 12-months were calculated. The 20% cut off was used as data suggest that 20% of patients are likely to experience poor outcomes [1]. These secondary data provide further information on the performance of the tools as prognostic indicators.
One hundred and thirty-eight participants (138/200; 69.0%) were included in the final analysis. Of these, one hundred and twenty-seven patients (127/138; 92.0%) provided eligible WOMAC scores at twelve months and one-hundred and thirty-five patients (135/138; 97.8%) provided satisfaction scores. Thirteen participants (13/127; 10.2%) re-corded WOMAC scores below forty at twelve months post-surgery and were therefore defined as having had ‘poor outcomes’; whereas seventeen participants scored less than 5/10 for satisfaction and were defined as ‘dissatisfied’ (17/135; 12.6%). Ten participants experienced poor outcomes (10/13; 76.9%) and dissatisfaction (10/17; 58.8%) at twelve months post-surgery.
There were no statistically significant differences between participants who were satisfied or dissatisfied in terms of age, gender or BMI. This was the same for participants with WOMAC scores above and below forty (Table 3).
Predictors of dissatisfaction at 12-months (VAS <5/10)
Mann-Whitney testing revealed many significant relationships between the variables examined and patients who were dissatisfied at twelve months (Table 4). ROC curve analysis revealed that low self-reported HRQoL (EQ5D3L Index) at day of discharge (AUC = 0.812; 95% CI 0.70–0.92) from hospital and three weeks post-surgery (AUC = 0.810; 95% CI 0.70–0.92) were the strongest predictors of dissatisfaction at twelve months. Poorer outcomes on the WOMAC (AUC = 0.789; 95% CI 0.63–0.95), as well as the WOMAC subscales for function (AUC = 0.769; 95% CI 0.62–0.92) and pain (AUC =0.796; 95% CI 0.65–0.95) at three weeks post-surgery also strongly predicted dissatisfaction.
Predictors of low satisfaction at day of discharge and 3-weeks post-surgery
Predictors of low satisfaction at day of discharge and 3-weeks post-surgery
AUC = Area Under ROC Curve; HADS = Hospital Anxiety and Depression Scale; NP = Neuropathic; VAS = Visual Analogue scale; WOMAC = The Western Ontario and McMaster Universities Arthritis Index; *Number of subjects with a positive diagnosis for the scale.
At day of discharge, high scores (VAS 0–10) for ‘worst pain’ (AUC = 0.759; 95% CI 0.64–0.88) and ‘average pain’ (AUC = 0.723; 95% CI 0.59–0.85) experienced in the previous forty-eight hours predicted dissatisfaction. At three weeks post-surgery, higher ‘average pain’ scores (AUC = 0.730; 95% CI 0.62–0.85) and highest ‘best pain’ scores for the previous forty-eight hours (AUC = 0.727; 95% CI 0.59–0.86), predicted those who were dissatisfied at twelve months. Individuals with anxiety at both point of discharge (AUC = 0.659; 95% CI 0.50–0.81) and three weeks (AUC = 0.629; 95% CI 0.46–0.80) post-surgery were statistically likely to be dissatisfied; as were those who experienced depression at day of discharge (AUC = 0.619, 95% CI 0.46–0.78) and three weeks post-TKA (AUC = 0.686; 95% CI 0.52–0.85). Neuropathic pain, stiffness, satisfaction and expectations were not associated with low satisfaction scores at either time point (Table 4).
ROC curve analysis revealed that the strongest predictors of poor outcome at twelve months post-surgery were low scores the WOMAC function sub-scale (AUC = 0.815; 95% CI 0.63–1.00), low HRQoL (EQ5D3L Index) at both three weeks post-surgery (AUC = 0.783; 95% CI 0.61–0.96) and day of discharge (AUC = 0.769; 95% CI 0.63–0.91); higher pain scores on the WOMAC pain sub-scale (AUC = 0.782; 95% CI 0.59–0.98) as well as the WOMAC total score at three weeks post-surgery (AUC = 0.778; 95% CI 0.57–0.99). Anxiety (AUC =0.632; 95% CI 0.44–0.83) and depression (AUC =0.713; 95% CI 0.53–0.90) at three weeks post-TKA were also significant predictors of poor outcomes (Table 5). Visual analogue scales of best, worst and average pain (in the previous 48 hours), neuropathic pain, satisfaction, expectations, depression (at discharge) and anxiety (at discharge) were not predictive of poor outcomes at one year (Table 5).
Predictors of WOMAC scores below 40 at discharge and 3-weeks post-surgery
Predictors of WOMAC scores below 40 at discharge and 3-weeks post-surgery
AUC = Area Under ROC Curve; HADS = Hospital Anxiety and Depression Scale; NP = Neuropathic; VAS = Visual Analogue scale; WOMAC = The Western Ontario and McMaster Universities Arthritis Index; *Number of subjects with a positive diagnosis for the scale.
HRQOL (EQ5D3L Index) was the only outcome measure which predicted both poor outcomes and dissatisfaction at one-year post-TKA at both discharge from hospital and three weeks post-surgery. High pain scores were predictive of both dissatisfaction and poor outcomes, at day of discharge and three weeks post TKA, but not on the same measurement tool (high average and worst pain scores at discharge from hospital and the WOMAC pain sub-scale at three weeks post TKA). The WOMAC total score, the WOMAC sub-scales for pain and function, as well as anxiety and depression, were all found to be predictive of dissatisfaction and poor outcomes at three weeks post TKA.
Sensitivity and specificity
The extent to which the worst 20% of scores for the significant prognostic factors identified those experiencing dissatisfaction and poor outcomes was calculated (Tables 6 and 7). WOMAC total scores at 3-weeks (specificity 84%; sensitivity 64%), as well as the sub-scales for function (specificity 83%; sensitivity 69%) and pain (specificity 86%; sensitivity 62%) demonstrated the best performance for identifying patients who were dissatisfied (Table 6). The WOMAC function sub scale (specificity 82%; sensitivity 78%) was best at identifying patients who were likely to experience poor outcomes at 12 months; followed by the WOMAC sub-scale for pain at 3-weeks (specificity 85%; sensitivity 60%).
The sensitivity and specificity with which patients experiencing the worst 20% of outcomes for each variable identified those who were dissatisfied at 12-months post-TKA
The sensitivity and specificity with which patients experiencing the worst 20% of outcomes for each variable identified those who were dissatisfied at 12-months post-TKA
HADS = Hospital Anxiety and Depression Scale; VAS = Visual Analogue scale; WOMAC = The Western Ontario and McMaster Universities Arthritis Index.
The sensitivity and specificity with which patients experiencing the worst 20% of outcomes for each variable identified those who experienced poor outcomes at 12-months post-TKA
HADS = Hospital Anxiety and Depression Scale; VAS = Visual Analogue scale; WOMAC = The Western Ontario and McMaster Universities Arthritis Index.
This cohort study has identified a range of early prognostic factors for individuals likely to experience poor outcomes and dissatisfaction following TKA. In keeping with previous research, most patients undergoing TKA, were satisfied with their surgery. The rate of dissatisfaction in this study (10/138; 12.3%) was lower than in other research (20%); however, some of this may be explained by the different methods used to measure satisfaction rates [1].
Satisfaction post-surgery is a multi-factorial way of evaluating TKA, but arguably the most important. Post-operative dissatisfaction has been linked to many variables including age, gender, comorbidities, expectations, pain, function and mental health [9, 18–21]. This study revealed that the strongest predictor of dissatisfaction post TKA was poor self-perceived HRQoL, measured on the EQ5D3L questionnaire. Few studies have examined whether generic measures of quality of life such as EQ5D3L are linked with satisfaction, due to the high ceiling effects associated with these measures [22]. Most studies have focused on disease specific self-reported outcome measures with questions relating to pain, function and stiffness like the WOMAC or Oxford Knee score as they are more sensitive to change, especially in the latter stages of recovery [22]. Clement and Burnett (2013) [23], used a generic quality of life questionnaire (SF-12) and found that general physical wellbeing was predictive of satisfaction post-TKA at twelve months post-surgery. Generic outcome measures such as ED5D3L incorporate psychological factors which make up satisfaction and may therefore have a role to play in identifying patients who are likely to be dissatisfied. The data in this study also revealed that EQ5D3L predicted those who were likely to experience poor outcomes at twelve months. Generic measures of HRQoL may therefore not be as sensitive as disease specific outcomes for measuring the extent of recovery, but lower quality of life in the first three weeks post-surgery may have a role in predicting those at risk of dissatisfaction and poor outcomes. This study suggests that as early as day of discharge and three weeks post-TKA; EQ5D3L is able to predict patients who are likely to be dissatisfied and experience poor outcomes at twelve months after surgery. It also raises the question of whether the same would be present pre-operatively. Further multi-site research examining the ability of generic measures of quality of life to identify those at risk of poor outcomes and dissatisfaction after TKA is warranted and could lead to the development of early post-operative interventions for patients at risk of dissatisfaction and poor outcomes following TKA.
This study suggests that disease specific measure of HRQoL (WOMAC) can identify patients at risk of dissatisfaction and poor outcomes, as early as three weeks following TKA. Interestingly the WOMAC sub-scales for pain and function, independently predict those at risk of dissatisfaction and poor outcomes, however the stiffness subscale (made up of only two questions), carries no predictive value. In isolation, the WOMAC function sub-scale was the strongest predictor of poor outcomes at one year. Very few studies have collected data this early after surgery, however, of those that have, this finding appears consistent [24]. Further research is required in statistically powered observational studies to identify whether the WOMAC can be successfully used to identify patients at risk of poor outcomes in the immediate post-operative period.
It remains inconclusive from the evidence which factors predispose patients to increased post-op pain [11]. However, it is clear that pain relief is the main expectation of patients undergoing TKA [9], and that patients with persistent pain after TKA, are less satisfied [8, 25]. This study supports these findings as the WOMAC pain sub-scale at three weeks post TKA, was highly predictive of those who were dissatisfied and had poor outcomes. Visual analogue scores for worst pain also predicted those likely to be dissatisfied and experience poor outcomes at discharge, but not at three weeks post-surgery. This research supports the need for research targeting patients with high pain scores in the early post-operative period following TKA.
Philips et al. (2014) [26] reported the incidence of neuropathic pain, measured by Pain DETECT post TKA as 8% at six weeks; 3% at three months and 2% at twelve months and concluded that it is an underestimated problem following Total Knee Arthroplasty. Many Pain DETECT questionnaires were withdrawn, due to missing values in this study, however the presence of neuropathic pain in the early post-operative period demonstrated no predictive value.
A recent cohort study of 266 patients revealed that anxiety may be a risk factor for persistent knee pain after TKA; whereas depression may be more related to poor function [27]. Research estimating the impact of poor mental health on outcomes after TKA has been contradictory [28, 29]. Most studies have looked at whether pre-operative depression is a risk factor for poor outcomes; with one study estimating that up to 30% of patients awaiting TKA suffer from depression [30]. However, few studies have looked at acute episodes of anxiety and depression after surgery in those that have pre-operative depression and those that do not. This study is not able to make any conclusions on this matter but did establish the presence of depression and anxiety at three weeks post-surgery was a prognostic factor for dissatisfaction and poor outcomes at one year. Further research looking at changes in mental state before and after surgery and their impact on outcomes are warranted.
The results of this study suggest that interventions targeting patients with high pain levels (eg. optimised analgesic regimes); low health-related quality of life (eg. enhanced rehabilitation provision; lifestyle interventions; social support) and anxiety and depression (eg. cognitive behavioural interventions), could be developed and targeted to individuals with specific risk factors which are identifiable very soon after TKA.
The 25% drop out-rate; the number of missing values and recruitment from a single site means that results from this study cannot be generalised to the whole TKA population. Further research studies are required to establish whether these relationships are demonstrated across multiple sites in a larger cohort of patients. This knowledge would allow for the development of targeted interventions for patients at risk of poor outcomes after TKA, to be tested in randomised controlled trials.
Conclusions
This single site cohort study suggests that as early as day of discharge from hospital and three weeks post-TKA, patients at risk of dissatisfaction and poor outcomes at one-year post-surgery could be identified using validated measures of HRQoL (EQ5D3L) and pain (VAS at discharge and WOMAC pain sub-scale at three weeks post-surgery). At three weeks post-surgery, patients experiencing low HRQoL (WOMAC), anxiety and depression (HADS) were also likely to be dissatisfied and experience poorer outcomes at one-year post surgery. This knowledge should contribute to the development of targeted interventions for patients at risk of poor outcomes post-TKA which can be implemented early in their post-operative recovery.
Conflict of interest
The authors have no conflict of interest to report.
Footnotes
Appendix 1
STROBE Statement *Give information separately for exposed and unexposed groups.
Item No
Recommendation
1
(a) Indicate the study’s design with a commonly used term in the title or the abstract
(b) Provide in the abstract an informative and balanced summary of what was done and what was found
Background/rationale
2
Explain the scientific background and rationale for the investigation being reported
Objectives
3
State specific objectives, including any prespecified hypotheses
Study design
4
Present key elements of study design early in the paper
Setting
5
Describe the setting, locations, and relevant dates, including periods of recruitment, exposure, follow-up, and data collection
Participants
6
(a) Give the eligibility criteria, and the sources and methods of selection of participants. Describe methods of follow-up
(b) For matched studies, give matching criteria and number of exposed and unexposed
Variables
7
Clearly define all outcomes, exposures, predictors, potential confounders, and effect modifiers. Give diagnostic criteria, if applicable
Data sources/ measurement
8*
For each variable of interest, give sources of data and details of methods of assessment (measurement). Describe comparability of assessment methods if there is more than one group
Bias
9
Describe any efforts to address potential sources of bias
Study size
10
Explain how the study size was arrived at
Quantitative variables
11
Explain how quantitative variables were handled in the analyses. If applicable, describe which groupings were chosen and why
Statistical methods
12
(a) Describe all statistical methods, including those used to control for confounding
(b) Describe any methods used to examine subgroups and interactions
(c) Explain how missing data were addressed
(d) If applicable, explain how loss to follow-up was addressed
(e) Describe any sensitivity analyses
Participants
13*
(a) Report numbers of individuals at each stage of study—eg numbers potentially eligible, examined for eligibility, confirmed eligible, included in the study, completing follow-up, and analysed
(b) Give reasons for non-participation at each stage
(c) Consider use of a flow diagram
Descriptive data
14*
(a) Give characteristics of study participants (eg demographic, clinical, social) and information on exposures and potential confounders
(b) Indicate number of participants with missing data for each variable of interest
(c) Summarise follow-up time (eg, average and total amount)
Outcome data
15*
Report numbers of outcome events or summary measures over time
Main results
16
(a) Give unadjusted estimates and, if applicable, confounder-adjusted estimates and their precision (eg, 95% confidence interval). Make clear which confounders were adjusted for and why they were included
(b) Report category boundaries when continuous variables were categorized
(c) If relevant, consider translating estimates of relative risk into absolute risk for a meaningful time period
Other analyses
17
Report other analyses done—eg analyses of subgroups and interactions, and sensitivity analyses
Key results
18
Summarise key results with reference to study objectives
Limitations
19
Discuss limitations of the study, taking into account sources of potential bias or imprecision. Discuss both direction and magnitude of any potential bias
Interpretation
20
Give a cautious overall interpretation of results considering objectives, limitations, multiplicity of analyses, results from similar studies, and other relevant evidence
Generalisability
21
Discuss the generalisability (external validity) of the study results
Funding
22
Give the source of funding and the role of the funders for the present study and, if applicable, for the original study on which the present article is based