




Abstract
BACKGROUND:
The World Health Organization Disability Assessment Schedule (WHODAS 2.0) is a practical, generic and widely used tool to assess the functioning and disability in several settings and health conditions. Although the use of categorical variables is common, this choice to present data could separate persons with very close functioning profiles into different categories.
PURPOSE:
This study aims to compare different ways of expressing the WHODAS score and give elements for the researcher to understand and choose the most appropriate way to statistically analyse the WHODAS scores.
METHODS:
A methodological study with secondary data of one hundred ninety-five women. The WHODAS score was analysed in different ways and associated with sociodemographic characteristics, lifestyle, and health aspects. The Poisson regression was chosen with the final WHODAS score in four variations (continuous, dichotomous, polytomous, and quartiles), and the presence of chronic disease.
RESULTS:
The analysis showed statistical significance in the univariate analysis for the adjustment variables and all the variations of the disability variable. The distribution analysis of the prevalence ratio and the AIC evidenced that the WHODAS score as a continuous variable had the lower AIC and statistical significance, as well as the most significant area under the ROC curve.
CONCLUSIONS:
These results show that the use of the continuous variable is the most indicated and that the categorization of the WHODAS score should be avoided.
Keywords
Introduction
The World Health Organization Disability Assessment Schedule (WHODAS 2.0) is a practical, generic and standardised tool developed by the World Health Organization (WHO) to assess health and disability in population or clinical environments. It was developed according to the concept of functioning from the International Classification of Functioning, Disability, and Health (ICF) [1].
The WHODAS 2.0 is a patient-reported outcome measure which contains three different application forms (interview, self-administered, proxy version). The tool is organized into 36 items, divided into six domains: 1) cognition –understanding and communication; 2) mobility –getting around; 3) self-care –personal hygiene, dressing, eating and living alone; 4) getting along with people; 5) life activities; 6) participation in society. There are five options to answer for each question: none, mild, moderate, severe, and extreme or cannot do [1]. The analysis process is divided into three steps: the first one is the sum of the scores recoded within each domain; the second is the sum of all the scores of the six domains; and the third is the conversion of the score summary into a metric ranging from 0 to 100 (0 = no disability, 100 = complete disability) [2].
Although the WHODAS has been demonstrated as a valid tool to assess the functioning and disability in several settings and health conditions, the way to present and analyse the final score varies [3]. Some studies use the variable in its continuous form (ranging from 0 to 100) [4–6]. Others use the categorized scores: dichotomized score (WHODAS 0 to 1: no disability; WHODAS > 1: with disability) [7] or (WHODAS 0 to 24% - no disability; WHODAS > 24% - with disability) [8]; and codified into 5 categories (no disability: 0–4%; mild: 5–24%; moderate: 25–49%; severe: 50–95%; extreme disability: 96–100%) [9].
The use of categorical variables is usual in epidemiological studies because it makes data interpretation easier. Researchers are more familiar with synthetic groups instead of linear variables or outcomes. However, the categorisation may present problems such as a loss of information, or even induce errors in data interpretations. Despite the recommendations to maintain the variable in its original continuous form, it is perceived that this does not ever occur, making categorisation common [10]. This study aims to compare different ways of expressing the WHODAS score and enable researchers to understand and select the best treatment for the variable resulting from the WHODAS in statistical analyses.
Methods
This is a methodological study which discusses strategies for appropriate statistical analysis and clinical use of WHODAS scores.
Ethical approval
The research protocol was registered and approved by the local Research Ethics Committee (registration number 49237315.9.0000.5568). All the research stages were conducted following the Declaration of Helsinki.
Study design
The present study is a secondary analysis of the descriptive, cross-sectional study entitled “Evaluation of the functioning of women at reproductive age in the city of Santa Cruz, RN”. The aim was to assess the functioning of adult women in a community sample of women aged 19–49 years and was carried out in the city of Santa Cruz, located in the northeast of Brazil, with 38,538 inhabitants and an area of 624.356 km². The municipality has health coverage of 97.83% by six primary care services [11].
The sample size was determined considering a prevalence of 44.4% of negative self-perception of health in women based on a previous national study [12], a 7% error factor and considering a 95% confidence interval, resulting in 194 women. Due to the lack of epidemiological data on the functioning of women, the measure of poor self-rated health (SRH) was used. SRH is a predictor of mortality and morbidity in several populations [13], and it is an outcome variable which is closest to the health context and presents clinical and epidemiological relevance [14].
We assessed 211 women from primary healthcare services and included women aged 19–49 years old with menstruation in the last three months, preserved cognition, and who agreed to participate in the study by signing the Informed Consent Form. Pregnant women (n = 9) and women with previous pelvic surgery (n = 7) were excluded. The final sample was comprised of 195 adult women and all participants were included in this study.
Data collection
The participants were recruited by convenience and the sampling covered all six primary healthcare services in the city. Women who were waiting for a routine medical appointment with a family physician or who were accompanying family members in the consultation were recruited. Trained interviewers conducted the interviews in a silent, private place of the healthcare service. The average interview time was 40 minutes.
The protocol for data collection involved questions on social and demographic aspects (age, race, civil status, family income, religion), self-rated health issues (body satisfaction, physical activity, alcohol consumption, previous diagnosis of chronic diseases, SHR and chronic pain), obstetrics and gynaecological history (parity, type of delivery, number of children, menarche age, sexual function and menstrual characteristics), and disability as measured by the 36-item versions of the World Health Organization Assessment Schedule 2.0 (WHODAS 2.0) applied by interview [15].
Study variables
We included data on disability, SHR and chronic diseases in this study. Disability was defined as the alteration in functioning indicated by the total WHODAS 2.0 score. The validated version of WHODAS 2.0 assessed disability [15]. Complex scoring was used to determine the final WHODAS score ranging from zero to 100 [2]. Four variations of this variable were tested in the statistical analysis: continuous, dichotomous, polytomous, and quartiles. The first one was disability (dichotomous): No (variation in the WHODAS score from 0 to 4), and Yes (> 4). The second was disability categorised ordinally: 1 (0 to 4), 2 (5 to 24), 3 (25 to 49), and 4 (> 49). The disability by quartile was created through the quartiles of the continuous disability variable: quartile 1 (0 to 5.43), quartile 2 (6.52 to 13.04), quartile 3 (14.13 to 25.0), and quartile 4 (26.08 to 64.13).
SHR is a measure of general health. It is easy to administer, and it is a valid and reliable measurement instrument. The question: “In general, would you say that your health is excellent, very good, good, poor or very poor?” measured the SHR [16]. The SHR was categorised into Good/Excellent, Normal, and Poor/Very poor due to having a low frequency of individuals in the extreme categories (excellent and very poor) [13, 14] for the analysis.
The presence of chronic disease was also measured, being collected by the confirmatory self-report for the medical diagnosis of at least one chronic disease. The history of systemic arterial hypertension, diabetes, osteoarthrosis, depression, and urinary incontinence was investigated. Chronic pain was measured by self-report of the presence of pain in any region of the body for at least six months [17].
Development of models
The Poisson regression model was chosen for this study because it is the most indicated model for estimating prevalence in cross-sectional studies. [18, 19].
Comparison of models
The following parameters were used to compare the models: confidence intervals (95% CI) for the adjusted Prevalence Ratio (aPR) in the multivariate model, area under the Receiver Operating Characteristic(ROC) curve, and Akaike Information Criterion (AIC).
The confidence interval refers to the range of values within which the true value is likely to be, and the sample size and effect size influence it. Larger samples decrease the confidence interval, increasing the accuracy of study results [20]. The confidence interval is used in regression models to evaluate if the estimated value is adequate to the values observed in the variables.
The ROC curve illustrates the relationship of sensitivity and specificity of a model for different cut-off points. The model is more accurate to classify the data correctly when the line is closer to the upper left corner of the graph; similarly, the larger the area under a curve, the better the sensitivity and specificity ratio [21].
The Akaike Information Criterion (AIC) is an indicator used to select statistical models adjusted by the same estimation model. The criterion is based on a goodness-of-fit statistic and the number of estimated parameters. The lower the value found, the better the model fits the data used [22].
Data processing and analysis
The Kolmogorov-Smirnov test assessed the distribution of continuous data. Absolute and relative frequencies were calculated for the categorical variables, while the median and quartile were calculated for the continuous variables. The Chi-squared or Fisher’s exact tests were performed to verify the relationship of dependency between chronic disease and categorical variables. The relation between the disability and continuous variables was performed using the Mann-Whitney test. A significance level of 5% was considered. After the association analysis, the significant variables were again compared by a Poisson regression model with a robust variation. The variables with a p-value under 0.05 were considered significant. The main results were presented with confidence intervals, and the ROC curve and the AIC compared the models.
Results
The database is composed of information extracted from data collected from 195 women according to the description mentioned in the methods section. Table 1 shows the study variables according to the presence of chronic disease. The adjustment variables (pain and self-perception of health) and the four variations of the disability variable (dichotomous, ordinal categorical, categorical by quartiles, and continuous) showed statistical significance in the univariate analysis. The age average was 33.15 years old (SD: 9.06), ranging from 19 to 49 years old.
Distribution of the study variables according to the presence of chronic diseases
Distribution of the study variables according to the presence of chronic diseases
¹Chi-Square test; ²Fisher’s exact test; ³ Mann-Whitney test (p < 0.001).
Table 2 shows the distribution of the aPR and the AIC of each of the four models. Model 03 shows a more elevated AIC and no statistical significance; Model 02 reveals an intermediary AIC and statistical significance only for the “severe disability” category; Model 04 shows lower AIC and statistical significance. The analysis under the ROC curve in Fig. 1 shows that Model 04 presents the largest area under the curve.
Distribution of adjusted prevalence ratios (aPR) and of the Akaike Information Criterion (AIC) according to models and type of change treatment in the functioning variable.
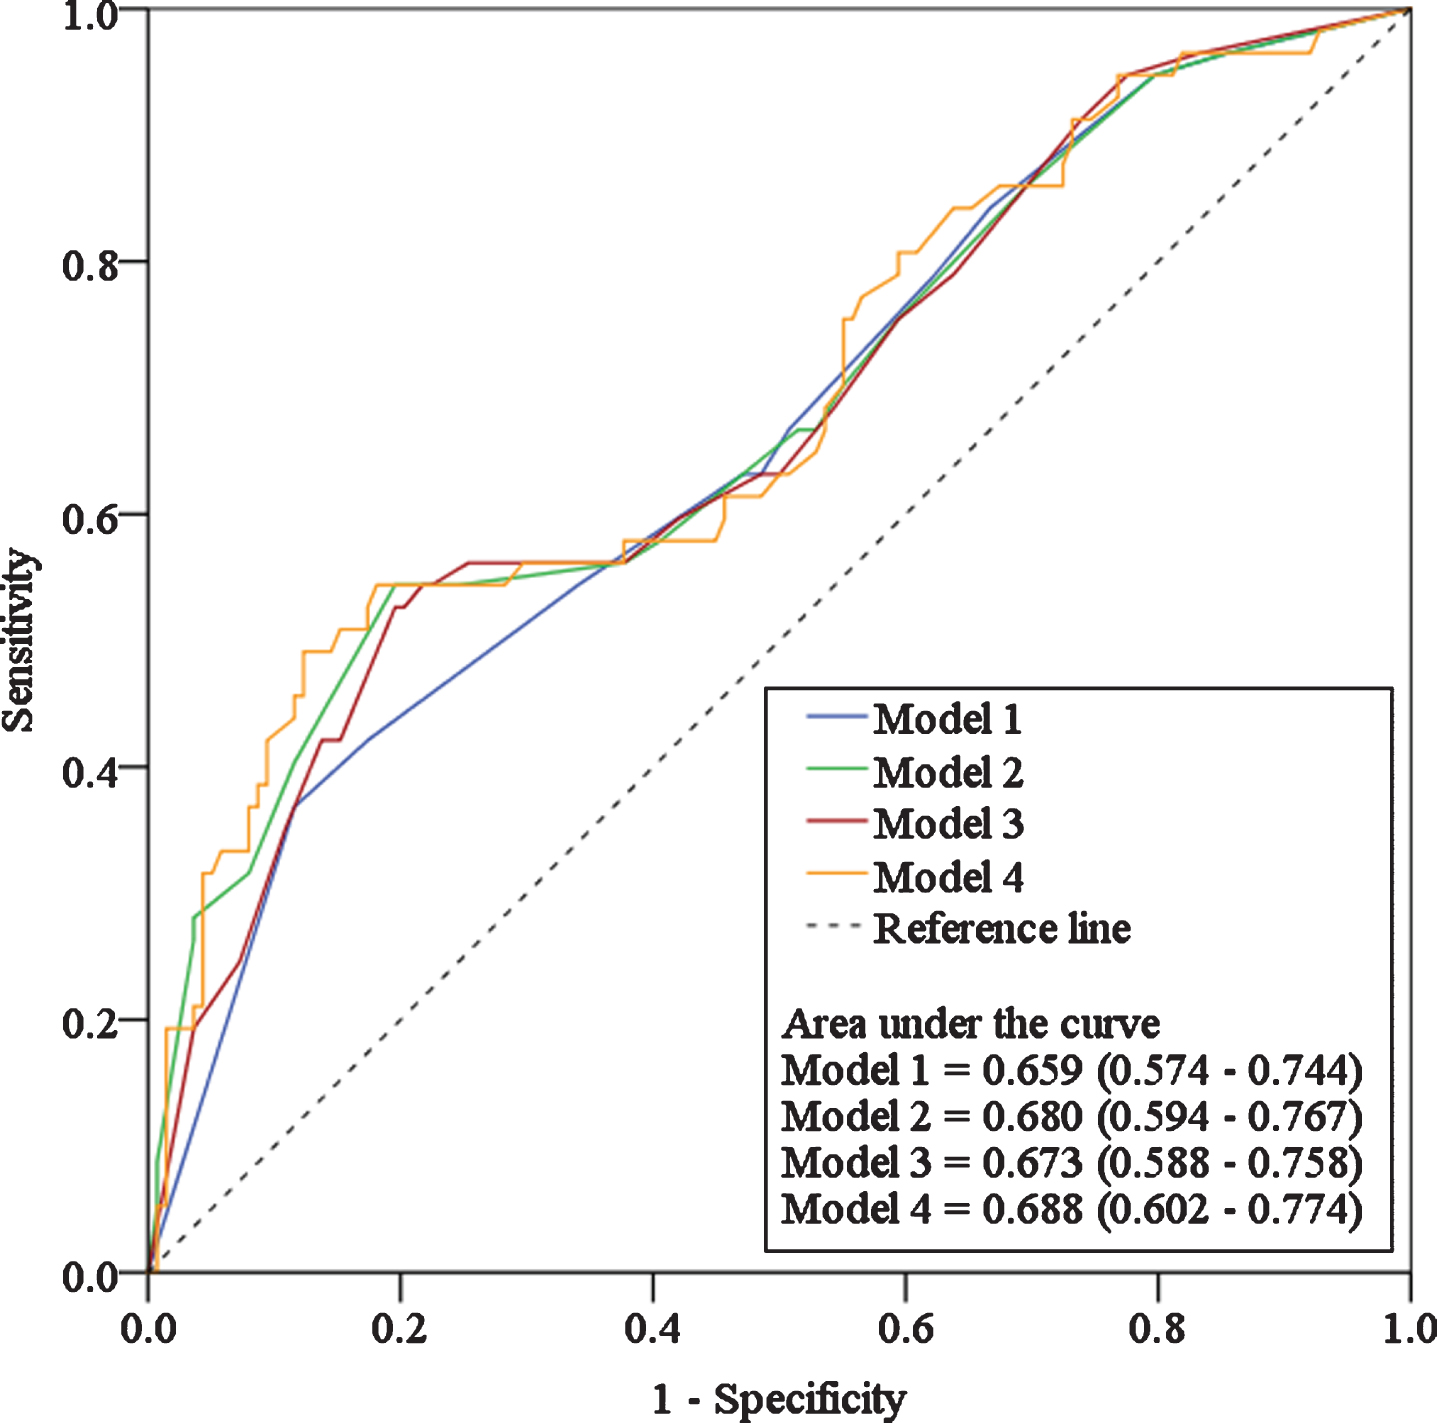
ROC curves of the dichotomous logistic regression models for the variable “chronic disease.”.
The treatment or categorisation of continuous variables is a recurrent theme in the literature [23]. However, there is already evidence that this process can be conducive to problems such as a loss of analysis power [24], differences in prevalence measures [25], and even alterations to the statistical significance of variable associations [26]. Even in showing these weaknesses and being contraindicated in the literature [10, 27], categorisation is still a common strategy for interpreting variables, and this statement is also applied in the study of functioning using the WHODAS scores. In short, this study aimed to check the best way to use the WHODAS scores in clinical and research settings.
Therefore, two approaches were used for discussing the data presented herein; the first one deals with the discussion of the statistical parameters selected for comparison, while the second will deals with the clinical meaning of using the categorised or continuous variable.
An initial analysis of Table 2 shows that statistical significance was recorded by the p-value in models 1, 2, and 4. However, this significance in models 1 and 2 was only for the worst category of the variable of each model. This can have some relationship with the frequency of each category in the study, as the category “no” (model 1, dichotomized) was only registered eight times among people with chronic diseases. The category “severe” (model 2, categorized in an ordinal form) was only perceived in 6 people with chronic diseases.
Furthermore, it is possible to verify that model 4 (continuous variable) presented the best parameters in comparison with the models of categorised variables. The AIC and 95% CI were the lowest among the models with some significance. Although there was a numeric difference in the ROC curve analysis, there was no difference between the models in this aspect of the assessment, as shown by the respective 95% CI.
In addition to the statistical aspects, there are the semantic and clinical aspects which must be considered before proceeding with the categorisation of the WHODAS score. It is known that functioning is a context-dependent construct [28]. Thus, two people with the same health condition can present different functioning profiles, depending on the context. In this sense, the variation exhibited by the WHODAS score will be determinant in the more exact delineation of each person’s functioning profile. This analysis refinement can be lost by categorising the total WHODAS 2.0 score, since two persons with different but closer scores can be allocated in the same category. In addition, the available evidence is against the presentation of continuous variables by quartiles and warns of the risk of losing precision. Whenever possible, the use of data in the continuous form is still preferable because it allows analyses of clinical sensitivity and comparison between different studies [29]. Thus, one of the advantages of the WHODAS is the quantification of the disability. However, this advantage may be lost if categorisation is chosen.
Although this study was conducted with a validated instrument with a community-based sample, the inferences presented herein must be analysed sparingly due to the sample size used. We need to highlight that a sample calculation was carried out and that the number of participants involved met all the mathematical conditions for conducting a statistical analysis. Other studies that assess the clinical impacts of different forms of analysing the WHODAS score should be encouraged.
In conclusion, this study shows that the use of the variable in its continuous form is the most indicated for analysing the WHODAS score by regression models. Although frequently done in the literature, treatment and categorisation of the WHODAS score variable should not be stimulated. The physiotherapist should use the WHODAS score as a continuous variable in clinical practice or research field to enable higher sensitivity in the analyses and better comparison between patients and different clinical situations.
Conflict of interest
The authors have no conflict of interest to report.
Ethical considerations
The research protocol was registered and approved by the local Research Ethics Committee (registration number 49237315.9.0000.5568). All the research stages were conducted following the Declaration of Helsinki.