
Abstract
INTRODUCTION:
More than one in three older adults (≥65 years) fall within a two-year period. Over one third of cancer diagnoses are among people aged ≥75 years. Falls research in the UK cancer population is limited and contradictory. The aim of this study was to explore the association between a cancer diagnosis and incidence of falls in older adults in England.
METHODS:
Data were extracted from the English Longitudinal Study of Ageing (an ongoing panel study) collected between 2002 and 2014, consisting of a representative cohort of older adults living in England. Baseline data were collected within two-years of a cancer diagnosis. Falls data were extracted from the subsequent two-year period. The unexposed group included those with no chronic conditions. The fully adjusted logistic regression analysis model included age, sex, wealth, and education level as covariates. We defined odds ratios between 0.67 and 1.5 as the region of practical equivalence.
RESULTS:
A total of 139 people had a type of cancer (exposed group) (Breast = 18.7%, Colon, Rectum or Bowel = 14.4%, Melanoma or Skin = 7.2%, Lung = 4.3%, Somewhere else = 51.8%) (70.6±7.1 years; 58.3% male) with 3,899 in the unexposed group (69.5±7.3 years; 54.6% male). The fully-adjusted odds ratio was 1.21 (95% CI: 0.81 to 1.82; P = 0.348). The probability of falling among the exposed group was 22.7% versus 19.5% for the unexposed group.
CONCLUSION:
The cancer and control groups were not statistically equivalent for falls incidence, and a meaningful positive association between cancer and falls cannot be ruled out. Further research is required to elucidate this relationship.
List of abbreviations
Body mass index
English Longitudinal Study of Ageing
Health Survey for England
Introduction
Globally, cancer is a major burden of disease. In the UK, around 450 deaths per day are attributed to some form of cancer [1], resulting in it being the leading cause of deaths [2]. Almost 990 people were newly diagnosed with some form of cancer every day in the UK between 2013 and 2015 [3].
Locations, types, and stages of cancer contribute to the type and severity of symptoms an individual may experience; therefore, it is difficult to identify common cancer symptoms in general. That said, the most common symptoms include fatigue, breathlessness, a change in bowel habits, loss of appetite, unusual lumps, coughing and unexpected aches and pains [4, 5]. Cancer surgery has been shown to cause symptoms such as dyspnoea, decreased functionality and decreased postural stability, resulting in decreased physical activity levels [6–8]. Adjuvant therapy, such as chemotherapy, has also been shown to affect motor and sensory function [9, 10].
It is well-known that incidence of falls is greater among older adults than a younger population [11, 12], with 18% of young adults (20–45 years old), 21% of middle-aged adults (46–65 years old) and 35% of older aged adults (> 65 years old) falling within a two-year period [13]. People diagnosed with cancer are often older adults, with around one third of cancer diagnoses among those aged 75 years or older [1]. There are contradictory findings with regards to incidence of falls between those with and without cancer. Numerous studies have shown an increase in fall incidence among people with cancer (up to 50%) [14–16], whilst others report a greater incidence of falls among those without cancer or no difference between groups (No cancer: 27.6–42.2%; Cancer with treatment: 30.3–33.0%; Cancer without treatment: 22.0–24.7%) [17, 18]. These findings might be due to the variation that exists in types of cancer (e.g. breast, lung and prostate), the symptoms of these, and the side-effects (e.g. dyspnoea, fatigue and pain) of associated treatments (e.g. surgery and chemotherapy). For example, people with lung cancer might be at a greater risk of falling due to the side-effects of thoracic surgery, including dyspnoea due to reduced lung capacity, and an altered centre of gravity due to anatomical changes.
It is estimated that falls among older adults cost the National Health Service in the UK more than £2.3 billion per year [19]. Falls result in functional decline, decreased quality of life and in some cases death, in older adults and people with cancer [12, 20]. One in 10 falls among older adults, with and without cancer, will result in a serious injury, such as fractures, dislocation, brain injury or soft tissue damage [21–23]. Hip fractures are a major cause of mortality in older adults [24, 25]. Psychological distress is another factor that is a result of a fall among an older population, which includes fear, loss of confidence, activity avoidance, loss of independence, disability, insecurity, altered body image and anxiety [26, 27].
The English Longitudinal Study of Ageing (ELSA) is an ongoing longitudinal panel study, consisting of a representative cohort of older adults living in England [28]. Details of the ELSA methodology have been published previously [29]. The ELSA sample (n = 18,489) was derived from respondents to the Health Survey for England (HSE), who are re-interviewed at biennial intervals (waves) to assess changes in their health, economic and social circumstances. The first wave consisted of those aged 50 or older on March 1st 2002, and their partners, with the final wave commencing on June 1st 2014 (Table 1). Respondents were given a self-completion questionnaire containing details such as smoking history, alcohol history and physical activity levels. At waves 3, 4, 6 and 7, new samples were obtained from the HSE to replenish the database [30]. At waves 2, 4 and 6, a nurse assessment took place in addition to the interviews, which assessed anthropometric measures and biological samples (e.g. cholesterol, glucose, cortisol), along with some tests of function, such as balance and strength measurements.
ELSA wave information
ELSA wave information
The overall aim of this study was to assess the prospective association between receiving a diagnosis of cancer and experiencing a fall within two years, among older adults in England, using the ELSA database. A secondary aim was to compare the probability of falling among different cancer types to determine which cancers are associated with greater odds of falling.
Study design and sample selection
This study was a secondary analysis of data obtained from the ELSA database using a prospective observational design. ELSA was approved by the London Multi-Centre Research Ethics Committee. All participants gave full informed consent to participate. Participants entered the dataset at different waves (every two years). For the current study, data for each participant was taken from the wave containing details of their initial assessment or the wave in which they received a diagnosis of cancer. Prospective falls data were used; therefore, falls data were recorded if a person partook in the wave following their initial assessment (two years later) to ensure a fall succeeded the cancer diagnosis (e.g. if someone entered the study at wave 3, follow-up data would be derived from the wave 4 assessment two years later).
Eligibility criteria
Data were extracted from waves 1–7 (2002–2014). Only participants aged 60 years or older were eligible, due to falls information being collected from this age onwards. Participants were divided into two groups: 1) Exposed group: Individuals who had received a diagnosis of cancer; and 2) Unexposed group: Those who had not received a diagnosis of cancer.
The exposed group included those who were diagnosed with cancer at waves 1–6. Those who were diagnosed at wave 7 were not included as no follow-up data could be obtained. Those diagnosed more than two years prior to entering the study were excluded from all analysis. The cancer site was also collected. It was not possible to determine whether treatment provided included surgery, chemotherapy, radiotherapy, or a combination of these.
The unexposed group included those who had not been diagnosed with cancer, chronic lung disease, asthma, arthritis, osteoporosis, Parkinson’s disease, Alzheimer’s disease, dementia, emotional, nervous or psychiatric problems, post-stroke, or congestive heart disease. Whilst there is no consensus on the definition of healthy older adults, previous literature has excluded similar conditions [31–33].
Outcome measure
The outcome for this analysis was whether a fall had occurred in the two years after the baseline data collection wave (following a recent diagnosis of cancer for the exposed group). Self-reported data on falls were collected. Participants were asked ‘Have you fallen down in the last two years (for any reason)?’. In the current study, falls were treated as a binary (yes or no) outcome, irrespective of frequency or whether medical treatment was required, due to the medical treatment option being open to interpretation.
Covariates
Age, sex, wealth, and education level were considered to be causes of exposure (cancer) and outcome (falls) and were included in the analysis as covariates to reduce confounding and bias [34, 35]. Wealth was derived using the total net financial wealth variable extracted from the wave in which the participants with cancer were diagnosed, or at inception for those in the unexposed group. Education level was classified using the highest educational qualification attained, which was categorised into lower (No qualifications), intermediate (Qualifications below college degree) and higher (College degree or above) education [36–38]. Wealth and education have both been reported as valid proxies of socio-economic status [37–39].
Statistical analysis
Unadjusted, partially adjusted (age and sex) and fully adjusted (age, sex, education, and wealth) logistic regression analyses were conducted. The results from all three models are presented, with emphasis on the full model. The odds ratio was derived for the association between recent cancer diagnosis and falls incidence, together with its 2-sided 95% confidence interval. The confidence interval reveals the range of associations compatible with the data and model. A priori, an odds ratio of 1.5 (or its reciprocal of 0.67 for an effect in the opposite direction) was identified as the smallest association of interest. Therefore, the interval bounded by these values was considered as the region of practical equivalence of the exposed and unexposed groups; effect sizes within these limits are considered trivial. At the expected fall incidence in the current analysis, an odds ratio of 1.5 represents a difference in the probability of falling between exposed and unexposed groups of approximately ten percentage points: one more person in every ten experiencing a fall with cancer versus without cancer. An odds ratio of 1.5 is equivalent to a standardised mean difference of around 0.2 –a small effect size. The disposition of the derived 95% confidence interval to the region of practical equivalence may be used to rule out meaningful effects in either direction (greater fall incidence in exposed or unexposed), equivalent to two 1-sided tests each at the 0.025 alpha level. In brief, if the entire 95% confidence interval for the odds ratio lies between 0.67 and 1.5, then the groups may be considered statistically equivalent.
Data were analysed using Stata (StataCorp. 2015. Stata Statistical Software: Release 14. College Station, TX: StataCorp LP). Under a plausible missing at random assumption, multiple imputation with chained equations was used to impute missing data such that these cases could be included appropriately in the analysis. The education data were imputed using ordinal logistic regression from age, sex, wealth, and the outcome variable and wealth data were imputed using predictive mean matching (random selection from 10 nearest neighbours) from age, sex, education, and the outcome variable. Twenty-five imputations were conducted, and the logistic regression analysis model was then applied to the 25 imputed data sets, with results combined conventionally using Rubin’s rules [40]. For the full analysis model, odds were converted to probabilities of falling in exposed and unexposed groups. These probabilities were derived at the mean value of continuous covariates, with factor variables treated as balanced.
Data were analysed without accounting for survey design, as sampling fractions are not relevant when the objective is to explore ‘causal’ relationships between exposure and outcome [41].
Results
Those in the exposed group (n = 139) had a mean (standard deviation (SD)) age of 70.6 (7.1) years, with 58.3% male. The unexposed group (n = 3,899) consisted of individuals aged 69.5 (7.3) years, with 54.6% male. The flow diagram of participants in the current secondary analysis is shown in Fig. 1. Sample characteristics for the exposed and unexposed groups are shown in Table 2. There were no substantial differences in age, sex distribution, wealth, or education level between the two groups. Nineteen participants had missing data for wealth, whilst 414 were missing a value for education, with 431 having at least one of these two variables missing.
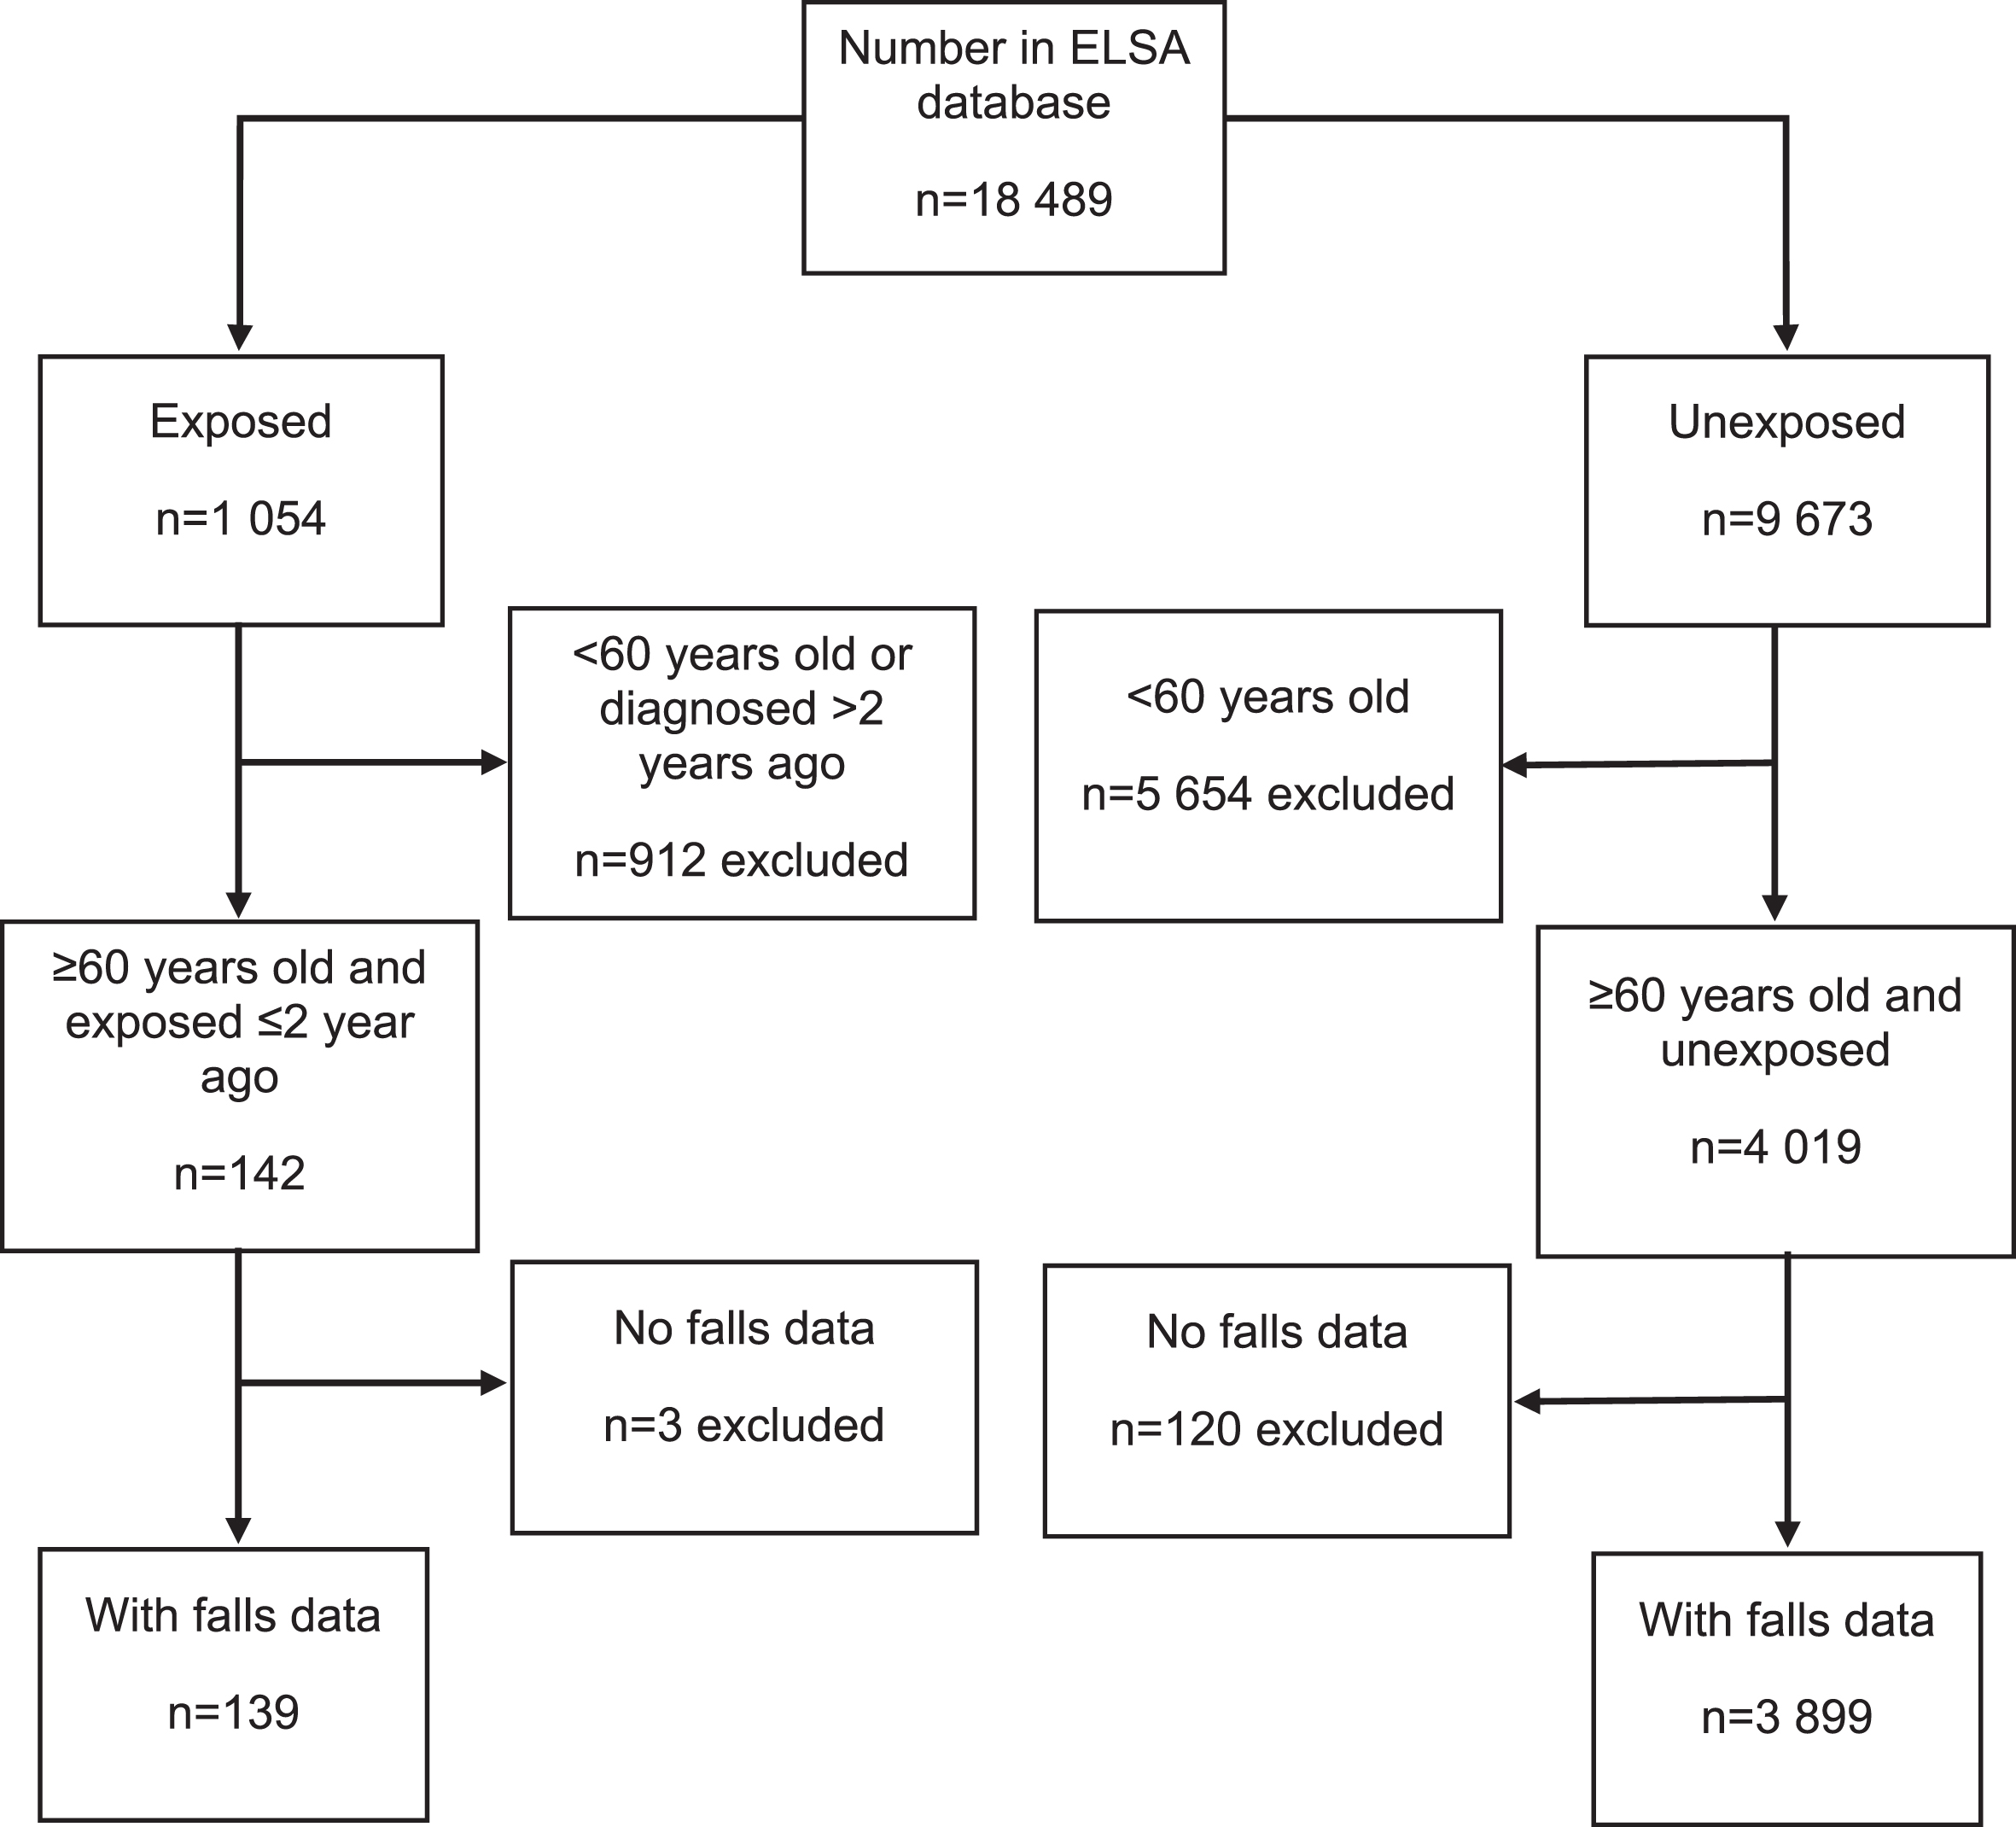
Flow diagram of participant numbers included within the study. Exposed = Received a diagnosis of cancer; Unexposed = No diagnosis of cancer.
Participant characteristics
The odds ratios are displayed in Table 3 and are similar for all three models. The confidence interval includes the smallest odds ratio of interest of 1.5, and therefore a meaningful association between cancer diagnosis and increased odds of falling cannot be ruled out –the groups are not statistically equivalent. A meaningful association in the opposite direction (substantially higher fall incidence in the unexposed group) can be ruled out at the 2.5% alpha level, as the lower limit of the 95% confidence interval was > 0.67. The point estimate, however, is a trivial effect size, and the confidence interval shows that associations ranging from trivial negative (greater odds of falling in the unexposed group) to small positive are compatible with the data and model. From the fully adjusted model, the predicted probability of a fall (derived directly from the odds) in the exposed group is 22.7% (95% CI: 16 to 30%) versus 19.5% (18 to 21%) in the unexposed group.
The association between recent cancer diagnosis and falling: odds ratio (95% confidence interval (CI)) for experiencing a fall during follow up in the exposed versus unexposed group
Part-adjusted model (age and sex); Fully adjusted model (age, sex, education, wealth).
Our secondary aim was to explore the probability of falling across different cancer types. This, however, was not possible due to the low total number of people in the exposed group (n = 139). Furthermore, limited information was available on the site of the cancer, with over 50% classified as ‘somewhere else’.
The primary study aim was to assess the association between receiving a diagnosis of cancer and experiencing a fall within a two-year period. The point estimate for the odds ratio was a trivial effect size, but the confidence interval revealed that a meaningful small positive association was compatible with the data; therefore, the groups were not statistically equivalent. A secondary aim was to compare the probability of falling among different cancer types; however, this could not be explored due to the small number of people diagnosed with cancer.
The probability of the exposed and unexposed group in this sample experiencing a fall is only around one in five. Previous research has shown a substantially higher probability of falling in older adults of the same age without cancer [13, 43]. This discrepancy might be due to the unexposed group in the current study consisting of those with no chronic conditions; arguably our sample is healthier than those in other research which includes participants with a variety of conditions or comorbidities. By excluding these individuals from the analysis, we can then explore the incidence of falls between people with cancer and healthy controls, reducing confounding and bias in the study. Furthermore, our exposed group includes those with cancers associated with lower risks of falls and unspecified cancers. Hence, the falls incidence in the cancer group might have been higher if our sample had consisted of more people with cervical, uterine, breast, prostate, or lung cancer, as previous studies have shown these individuals are more likely to fall than those with other cancer diagnoses [44–47]. It is unclear, however, what causes falls in these populations, although balance and gait impairments due to cancer symptoms and side-effects of surgery and associated treatments might be implicated. The nature and timing of cancer treatment is also unclear from the ELSA database. Cancer treatments, such as chemotherapy, can increase risk of falls by having a negative effect on postural control [48, 49]. Chemotherapy-induced peripheral neuropathy can cause impaired motor and sensory function through the neurotoxic effects of chemotherapy drugs [50, 51]. Sensory symptoms include loss of sensation, ataxia and pain, whilst motor symptoms include weakness and balance disturbances [50–52], which in turn may contribute to an increased fall risk.
Other covariates were considered in this analysis, such as body mass index (BMI), balance, strength, pain, ethnicity, smoking and alcohol consumption. Although balance, strength and pain are causes of falls, they do not cause cancer; therefore, they were not adjusted for in the analysis. BMI was not included as anthropometric data were only collected at nurse waves or fed-forward from the HSE, which means BMI could not be calculated at a true baseline [40]. Ethnicity was also considered as this has been shown to influence fall and cancer risk. In the ELSA database, however, ethnicity was classified as ‘white’ or ‘non-white’ which has been reported as being a limitation due to the lack of variability and sub-classification of ethnicity [41]. Smoking habits were not included in the analysis as this exposure is not causally related to falls; however, it does cause osteoporosis [42] which is associated with an increased fall risk [43]. It was also not possible to quantify the amount smoked as no date for stopping smoking is reported in the database, and thus pack years could not be calculated. Smoking status was also self-reported, potentially biasing any analysis [44]. Alcohol consumption was not included due to the way this was reported. In wave 1, these variables noted the frequency that an individual drinks alcohol within the last 12 months and current drinking habits. However, there is no report on the quantity of alcohol consumed.
Limitations
This is the first study to perform an analysis of this kind to explore the incidence of falling in people in England with a diagnosis of cancer versus a sample with no chronic conditions. We must acknowledge several limitations. The sample size for the exposed group is small, precluding exploration of the association between individual cancer types and fall incidence. With the number eligible for inclusion and the small proportion of exposed cases, our study had only around 50% power to detect an odds ratio of 1.5 –the smallest association of interest. However, our study is explicitly labelled as exploratory, and further research is required to define the association more precisely. The falls data in the ELSA database were self-reported, which might mean that falls are under-reported due to recall issues in older adults [53, 54]. Although cognitive impairment was not considered in this study, the issue of recall bias is important to consider when interpreting results of this nature, especially among older adult populations. Additionally, what constitutes a fall was not defined explicitly in the ELSA questionnaire, leading to potential misinterpretation and reporting errors [55]. These issues with the reporting of falls might also contribute to the discrepancy between the fall incidence observed in our analysis compared with the higher incidence reported in previous literature.
With respect to cancer diagnoses, the timeframe of two years might also be a limitation. One individual may have been diagnosed with a minor cancer almost two years prior to entering the study and be back to full health, whilst another may have had a diagnosis of a more aggressive cancer a couple of months prior to inclusion. We were also unable to assess what treatment individuals had undergone, which could affect the incidence of falls due to the side-effects of surgery and adjuvant therapy. The medication that individuals were taking was also not adjusted for in this analysis due to this only being collected at nurse waves (every four years).
This study was a secondary analysis; therefore, we had no control over the variables which were collected or the way in which they were collected. People with cancer in this analysis might also have had other comorbidities, therefore, it is possible that one or more of these comorbidities might have contributed to fall risk. However, cancer is the one condition that all participants had in common.
Recommendations
Our exploratory analysis contributes to the current knowledge base within this area by adding to the scarce literature investigating falls among people with cancer. A meaningful small positive association between cancer diagnosis and fall incidence could not be ruled out statistically, suggesting that further research is warranted. Our work also helps to guide research on falls among people with cancer in England by highlighting the limitations of the current study that should be considered in future research, including recall bias and the inability to include covariates such as BMI and polypharmacy. A larger sample size (more exposed cases) with more information on people with cancer is needed to reduce bias and more precisely define the association between recent cancer diagnoses and fall incidence. It is also essential to know more about the cancer, such as stage, mode of treatment, and timing, to examine the influence of these factors on falls.
Conclusion
In this secondary analysis, the confidence interval for the odds ratio for experiencing a fall revealed that the range of effect sizes compatible with the data and model ranged from trivially negative (higher incidence of falling in controls) to a meaningful positive association between cancer diagnosis and fall incidence. The two groups were not statistically equivalent, as the upper confidence limit for the odds ratio was beyond the smallest effect size of interest of 1.5, indicating that a greater incidence of falls in the cancer group could not be ruled out. Further research is required to elucidate this relationship.
Author contributions
DT and SH conceived and designed the study. DT and KL organised the database. All authors were involved in the interpretation of the data. DT, AB and SH analysed the data, while AB provided the statistical input. DT drafted the manuscript, while all authors critically revised the manuscript for content. All authors read and approved the final manuscript.
Footnotes
Acknowledgments
The authors have no acknowledgments.
Conflict of interest
The authors have no conflicts of interest to report.
Ethical considerations
Ethical approval for ELSA was obtained from the London Multi-Centre Research Ethics Committee. All participants gave full informed consent to participate and to report individual patient data. No additional ethics approval was required.
Funding
The authors report no funding.