
Abstract
BACKGROUND:
Clinical gait analysis of sagittal plane lower-limb kinematics using video images is a quantitative tool for clinicians. However, the reliability and validity of limb kinematics after stroke using video images has not been fully investigated.
OBJECTIVE:
This study aimed to examine the within-session inter-rater reliability and criterion-related validity of lower limb angles measured in sagittal plane images captured using a smartphone for assessing post-stroke gait and to determine which asymmetric parameters are associated with faster gait velocity.
METHODS:
Thirty-two patients with stroke were included; video images were recorded as they walked at their preferred pace for 1–3 cycles. Lower limb angles (contact, push-off, and excursion angles) and degree of asymmetry were determined based on video images using markers of acromion, greater trochanter, and fifth metatarsal head. Measurement reliability was calculated using the two-way random effects model of intraclass correlation coefficients and minimal detectable change. The criterion validity investigated Pearson’s correlation between lower limb angles and their asymmetry and gait velocity.
RESULTS:
The lower value of the 95% confidence interval of intraclass correlation coefficients (2.3) of the lower limb was 0.891, and the maximum minimal detectable change was 9.6 degrees. Push-off angle showed a moderate-to-strong correlation with gait velocity, whereas the asymmetry of the push-off angle showed a weak correlation with gait velocity.
CONCLUSIONS:
Assessing post-stroke gait utilizing video images using a smartphone is feasible. The push-off angle, in particular, may provide insight into the clinical assessment of post-stroke gait.
Introduction
A typical feature of gait in patients with stroke is the asymmetrical pattern of step movement between the affected and unaffected limbs. The asymmetric gait may be an indicator of underlying impairments, recovery, and compensation strategies of post-stroke gait. In this regard, step length asymmetry is associated with propulsion asymmetry [1]. A shorter step length of the unaffected limb compared to that of the affected limb decreases the propulsive forces in the affected lower limb and/or increases the propulsive forces in the unaffected leg [2].
In a clinical environment, an asymmetrical gait pattern is described as a “larger stride length of the affected limb” or a “limited range of motion in the affected hip.” However, real-time gait observation is considerably subjective and depends on the therapist’s experience, knowledge, and interests [3]. Therefore, this method of describing gait asymmetry remains somewhat questionable regarding objectivity and quantitative evaluation. Moreover, it is difficult to evaluate the slight changes induced by therapeutic approaches using qualitative assessment.
Gait velocity is frequently used in clinical settings as an objective and quantitative measure of gait function. It can be calculated by measuring the time required to travel a known distance using a stopwatch and includes combined information of spatial and temporal parameters of gait. It is crucial to know the gait velocity because it is a good indicator of the ability to live independently, especially in patients with stroke [4]. However, it does not directly indicate an asymmetric gait pattern; hence, it does not describe how gait interventions in patients with stroke can lead to improvement in gait. Further, gait velocity does not allow discrimination between recovery and compensation, as patients with different stroke severities may achieve the same gait velocity [5].
Forward propulsion force is essential to walk faster [6]. The trailing limb angle, which is the angle between the vertical line and the line connecting the hip and ankle at the time of toe-off, would be associated with propulsion force [7–9]. The video image itself does not provide kinetic information; however, the forward force can be predicted by measuring the trailing limb angle from the video image. Similarly, peak hip flexion angle at initial contact would be associated with a faster gait due to increased step length [10]. One possible way to compensate for insufficient propulsion due to ankle plantar flexor weakness in patients with stroke is increased use of hip flexors to swing the lower limb forward [11]. However, because gait is bipedal, the trailing limb and peak hip flexion angles are achieved with both legs. A typical feature of post-stroke gait is asymmetry [12]. A gait speed of≥0.8 m/s can be achieved regardless of symmetrical or asymmetrical gait; the strategy used to achieve this depends on the individual [13]. Therefore, clinical gait analysis should evaluate not only the degrees of the trailing limb angle and peak hip flexion angle but also their asymmetry. To our knowledge, the reliability and validity of using video imaging to assess gait after stroke have not been investigated.
The primary aim of this study was to examine the reliability and validity of lower limb angles measured in the sagittal plane images captured using a smartphone for assessing gait asymmetry in patients with stroke. The secondary aim was to examine which asymmetric parameters were associated with faster gait velocity and establish their clinical utility. We hypothesized that although the push-off angle is associated with forward propulsion, which influences gait velocity, asymmetry of the push-off angle itself may not be a prerequisite for increasing gait velocity, considering that stroke patients tend to acquire asymmetric gait patterns to increase gait velocity strategically.
Methods
Participants
Patients with stroke who were admitted in the convalescence rehabilitation wards of a general hospital for post-stroke rehabilitation were invited to participate in the study. The sample size requirement for relative measurement reliability (i.e., intraclass correlation coefficient) was determined as 13, the power was set to 80.0%, the significance level was set to 0.05, and the acceptable and expected reliabilities were set to 0.7 and 0.9, respectively [14]. Similarly, for measurement validity (i.e., correlation coefficient), a minimum sample of 29 was calculated using an expected correlation coefficient of 0.5 [15]. The inclusion criteria were participants who had experienced a first-ever or recurrent stroke (i.e., clinically-evident hemiplegia) and who were able to walk independently for at least 10 meters without assistive devices or orthoses. The exclusion criteria were severe heart failure or respiratory illnesses and cognitive or neuropsychological impairments, such as aphasia. This study was approved by the local Ethics Committee and was conducted in accordance with the principles of the Declaration of Helsinki. Written informed consent was obtained from all the participants.
Data collection and lower limb angle processing
In this cross-sectional observational study, a two-dimensional video image was recorded using a smartphone (iPhone 7, Apple Inc.). We selected this type of device due to its user-friendly and low-cost nature compared with costly and demanding apparatus, such as three-dimensional gait analysis systems. The sampling frequency was set at 30 frames per second. The smartphone was fixed using a tripod equipped with a level gauge. The camera was set to a height of 110 cm. The camera was placed approximately 5 m from the participants, perpendicular to the walking direction of the participants. At least 1–3 gait cycles in the sagittal plane were recorded.
Then, the researcher (Y. K.) attached 10 reflective markers to each participant at the following locations: both sides of the acromion (shoulders), greater trochanter (hips), lateral epicondyle of the femur (knees), calcaneus just below the lateral malleolus (ankles), and head of the 5th metatarsal (toes). Each participant was then asked to walk twice in the hospital corridor (approximately 16 m) at their preferred speed. Bilateral data were recorded for each participant. At 10-m distance, the time was recorded using a stopwatch. Next, we converted the walking time into gait velocity (m/s).
To determine the lower limb angle during walking, the video image file (QuickTime movie file) was converted to an image sequence file, and the positions of the markers were then measured using image processing software (ImageJ, National Institutes of Health). We used at least one gait cycle for further analysis.
After smoothening the measured positions of the markers with a second-order low-pass Butterworth filter, we calculated the lower limb angle between the line connecting the shoulder marker and the hip marker and the line connecting the hip marker and the toe marker. The positive peak value of the lower limb angle was defined as the contact angle, and the negative peak value was defined as the push-off angle. The excursion angle is the range of the lower limb angle. The push-off angle resembles the trailing limb angle [7–9, 16–18], which does not have a standard definition [16]. The present study used a line connecting the shoulder marker and hip marker, unlike previous studies that used a vertical line. Figure 1 illustrates the definition of lower limb angles.
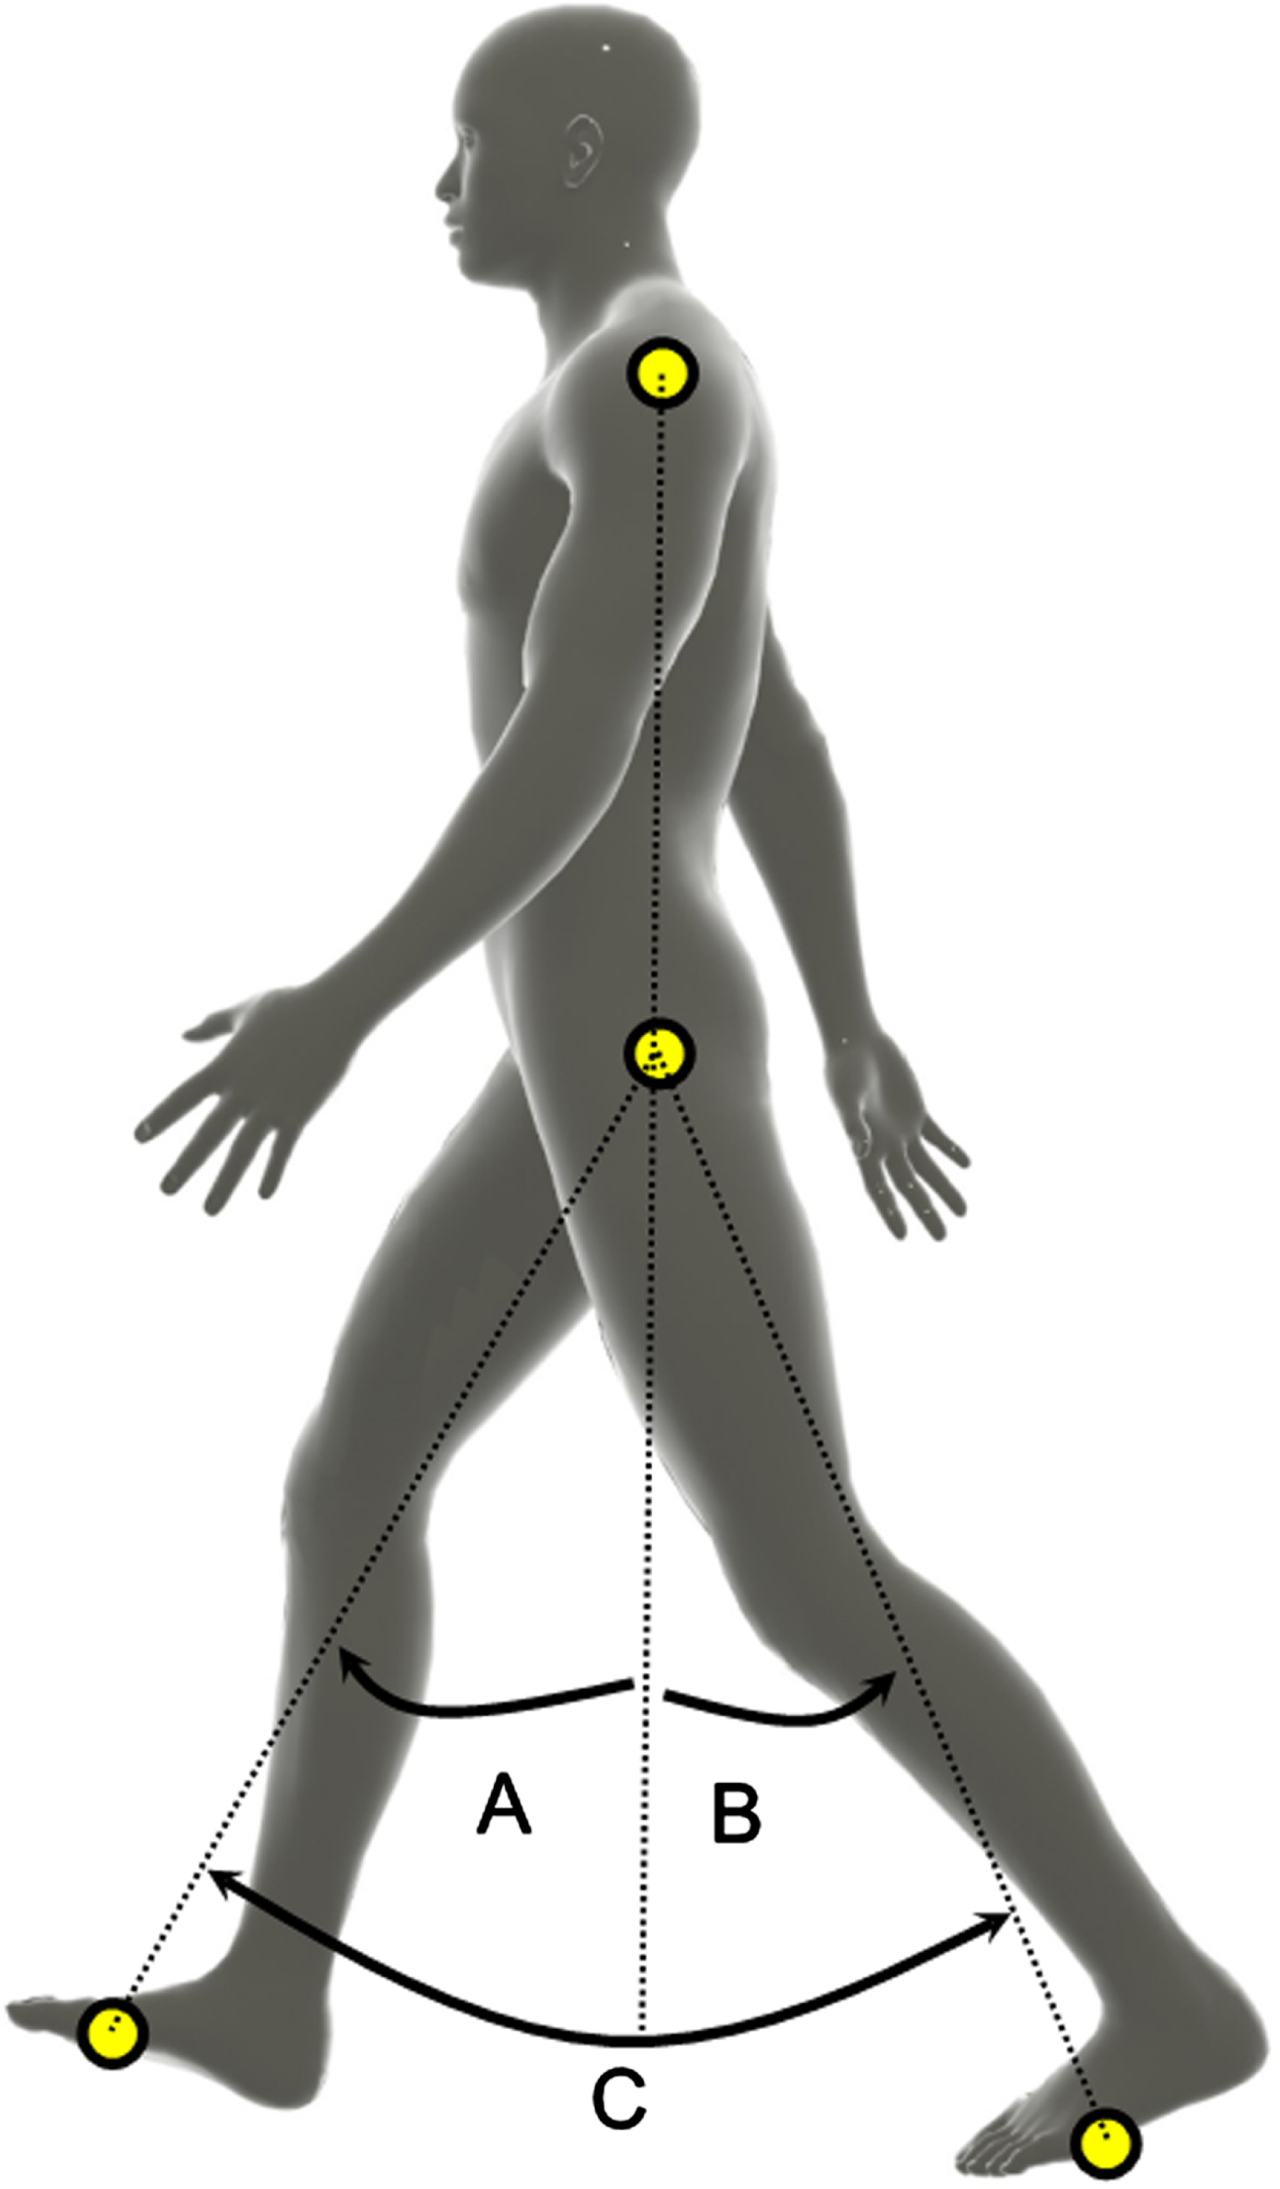
Illustrated definition of lower limb angles. Lower limb angle measured as the angle between the extended line connecting the shoulder and hip markers and the line connecting the hip and toe markers. Because the extended line connecting the shoulder and the hip markers were defined as zero, the positive peak value of the lower limb angle was defined as the contact angle, and the negative peak value was defined as the push-off angle. The excursion angle is the range of the lower limb angle. Note that the excursion angle in this figure represents the range of motion of each leg. A: contact angle; B: push-off angle; C: excursion angle.
The calculation of spatial asymmetry, including step length asymmetry, has not been standardized [19, 20]. A previous study found no differences among the calculation formulae of several asymmetry indices [20]. In this study, the asymmetry angle was simply defined as the difference between the affected and unaffected sides. This is because clinicians may not prefer to adopt troublesome and complicated formulas.
The push-off angle was changed from a positive value to a negative one and vice versa to unify the formulas. A perfect symmetry has a value of 0. A negative value implies that the angle in the affected limb is larger than that in the unaffected limb. We calculated the asymmetry index for the contact, push-off, and excursion angles.
The within-session inter-rater reliability of the lower limb angle parameters, which were calculated based on the manually digitized marker positions, was analysed using the two-way random-effects model of intraclass correlation coefficients (i.e., ICC agreement) [21]. The number of recorded gait cycles available for statistical analysis on the affected side was one gait cycle for three participants, two gait cycles for eight participants, and three gait cycles for 21 participants. For the unaffected side, there was one gait cycle for three participants, two gait cycles for nine participants, and three gait cycles for 20 participants. Therefore, the ICC was calculated for 21 participants for the affected side and 20 participants for the unaffected side. In addition, one author (S.I.) measured the middle second gait cycle for 16 participants, and all other cycles were measured by the other author (Y.K.). We also calculated standard error of measurement (SEM) and minimal detectable change (MDC) for these parameters for absolute reliability [22].
We used the Pearson correlation coefficients to investigate the criterion-related validity over lower limb angle parameters and gait velocity. In this analysis, we used the average values of recorded gait cycles. Statistical analyses were performed using R version 3.6.3 for reliability analysis and SPSS statistics version 25.0 (IBM Corp, Japan) for correlation analysis, and the significance level was set at 0.05.
Results
Thirty-two patients with stroke admitted to the convalescence rehabilitation wards of a general hospital for post-stroke rehabilitation were included in the study. The characteristics of the participants in this study are shown as mean (standard deviation) for continues variables and median (minimum– maximum) for categorical variables. The time from stroke onset to gait assessment was 76.9 (47.5) days, age was 60.7 (11.7) years, Brunnstrom stage was 5 (3–6), and gait velocity was 0.81 (0.35) m/s. Cerebral infarction was noted in 15 participants, cerebral haemorrhage in 15 participants, epidural hematoma in 2 participants, first-ever stroke in 29 participants, and recurrent stroke in 3 participants. The participants’ characteristics and lower limb angles are summarized in Table 1 and the Supplementary Table. The lower limb angles showed a monophasic curve similar to the hip joint angle (Fig. 2). Overall, the contact, push-off, and excursion angles were greater on the unaffected side than on the affected side (Table 1 and Supplementary Table).
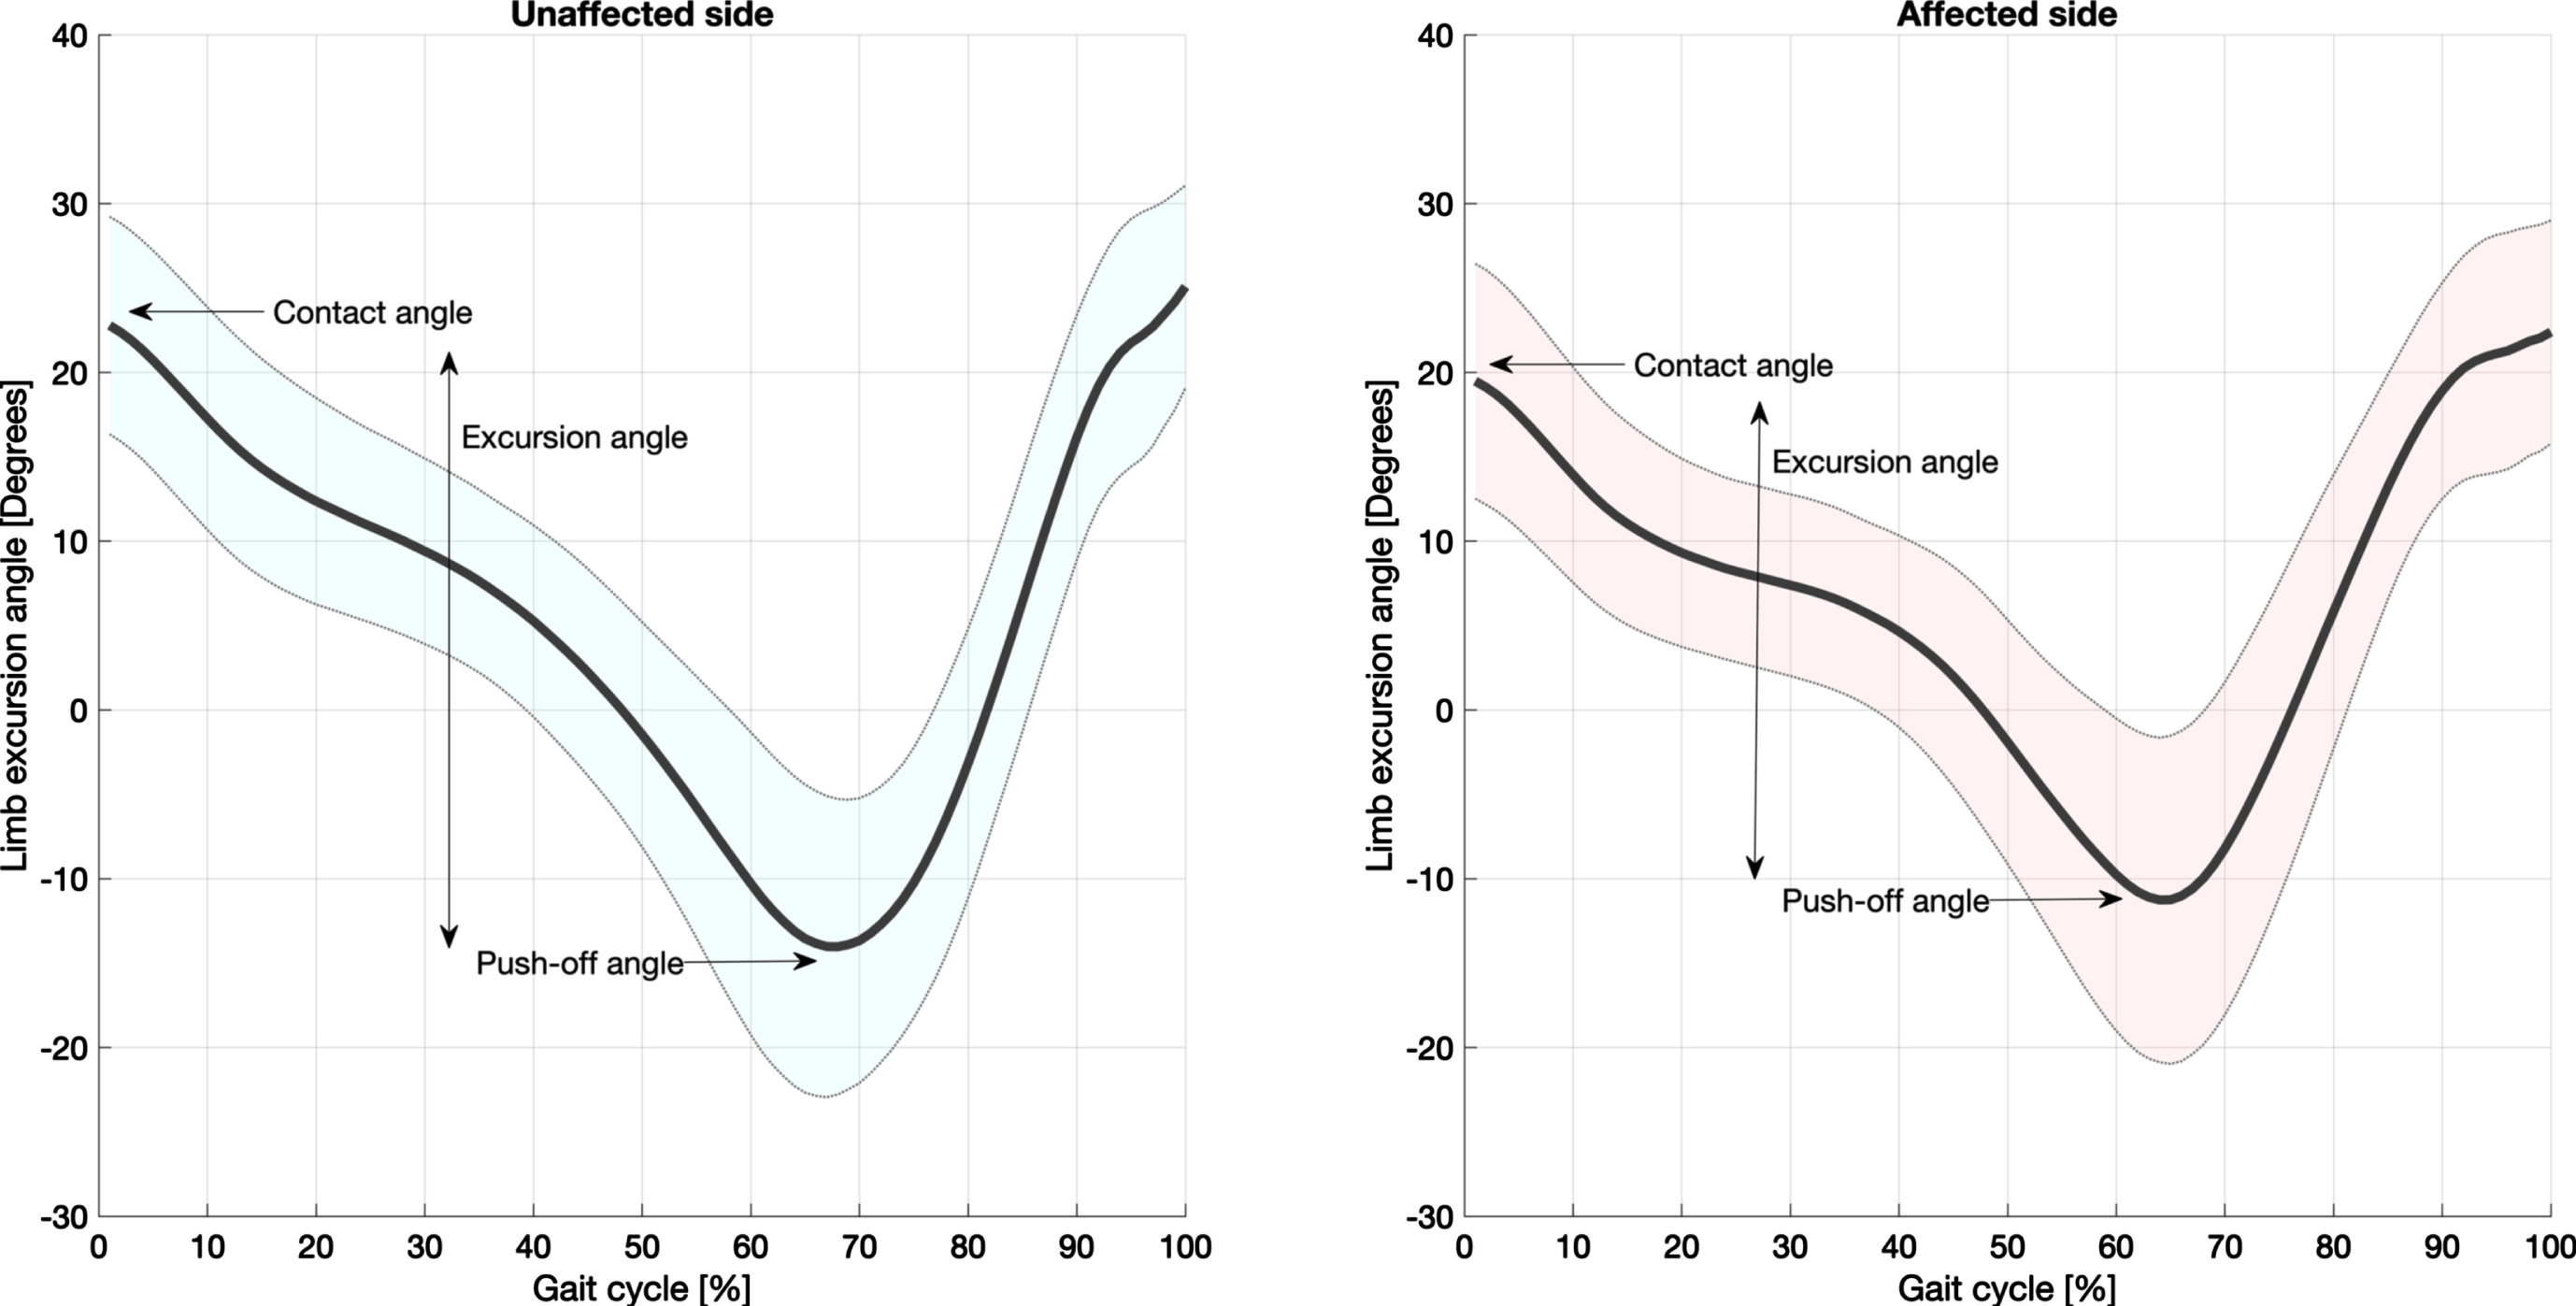
Comparison of the affected and unaffected pattern of lower limb angle across participants. The thick line shows the mean value, and the shaded area shows the standard deviation. Maximum positive values represent the contact angle. Maximum negative values represent the push-off angle. The amplitude of the y-axis represents the excursion angle.
Lower limb angles and asymmetry index of participants
Lower limb angles and asymmetry indices indicate the mean (standard deviation).
The two-way random effects model of ICC 2.1 (95% confidence interval [CI]: lower– upper value) revealed a reliability of 0.908 (0.823–0.958) for the affected contact angle, 0.863 (0.732–0.939) for the unaffected contact angle, 0.918 (0.836–0.964) for the affected push-off angle, 0.954 (0.876–0.982) for the unaffected push-off angle, 0.879 (0.772–0.944) for the affected excursion angle, and 0.933 (0.866–0.971) for the unaffected excursion angle. Using an average of three strides (i.e., ICC 2.3), the lowest 95% CI lower value was 0.891 for the unaffected contact angle (Table 2 and Supplementary Figure). The SEM showed 2.0, 2.5, 2.5, 1.7, 3.5, and 2.9 degrees, in the same order as the ICC analysis above. Similarly, the MDC was 5.5, 6.9, 6.9, 4.7, 9.6, and 7.9 degrees (Table 2).
Intra-rater reliability of lower limb angle measurements
Intra-rater reliability of lower limb angle measurements
The ICC values indicate single measure (2,1). ICC: Intraclass correlation coefficients. SEM: Standard error of measurement. MDC: Minimal detectable change.
Most parameters related to lower limb angles were associated with gait velocity (Table 3). Strong association was found between the excursion angles and gait velocity and between the push-off angles and gait velocity. Twenty-two of the 32 participants showed a greater push-off angle for the unaffected side than for the affected side (Supplementary table); however, the correlation between the asymmetry of the push-off angle and gait velocity was weak (Table 3 and Fig. 3).
Correlation coefficients between gait speed and lower limb angles during gait
Correlation coefficients between gait speed and lower limb angles during gait
Bold indicates a significant correlation coefficient.
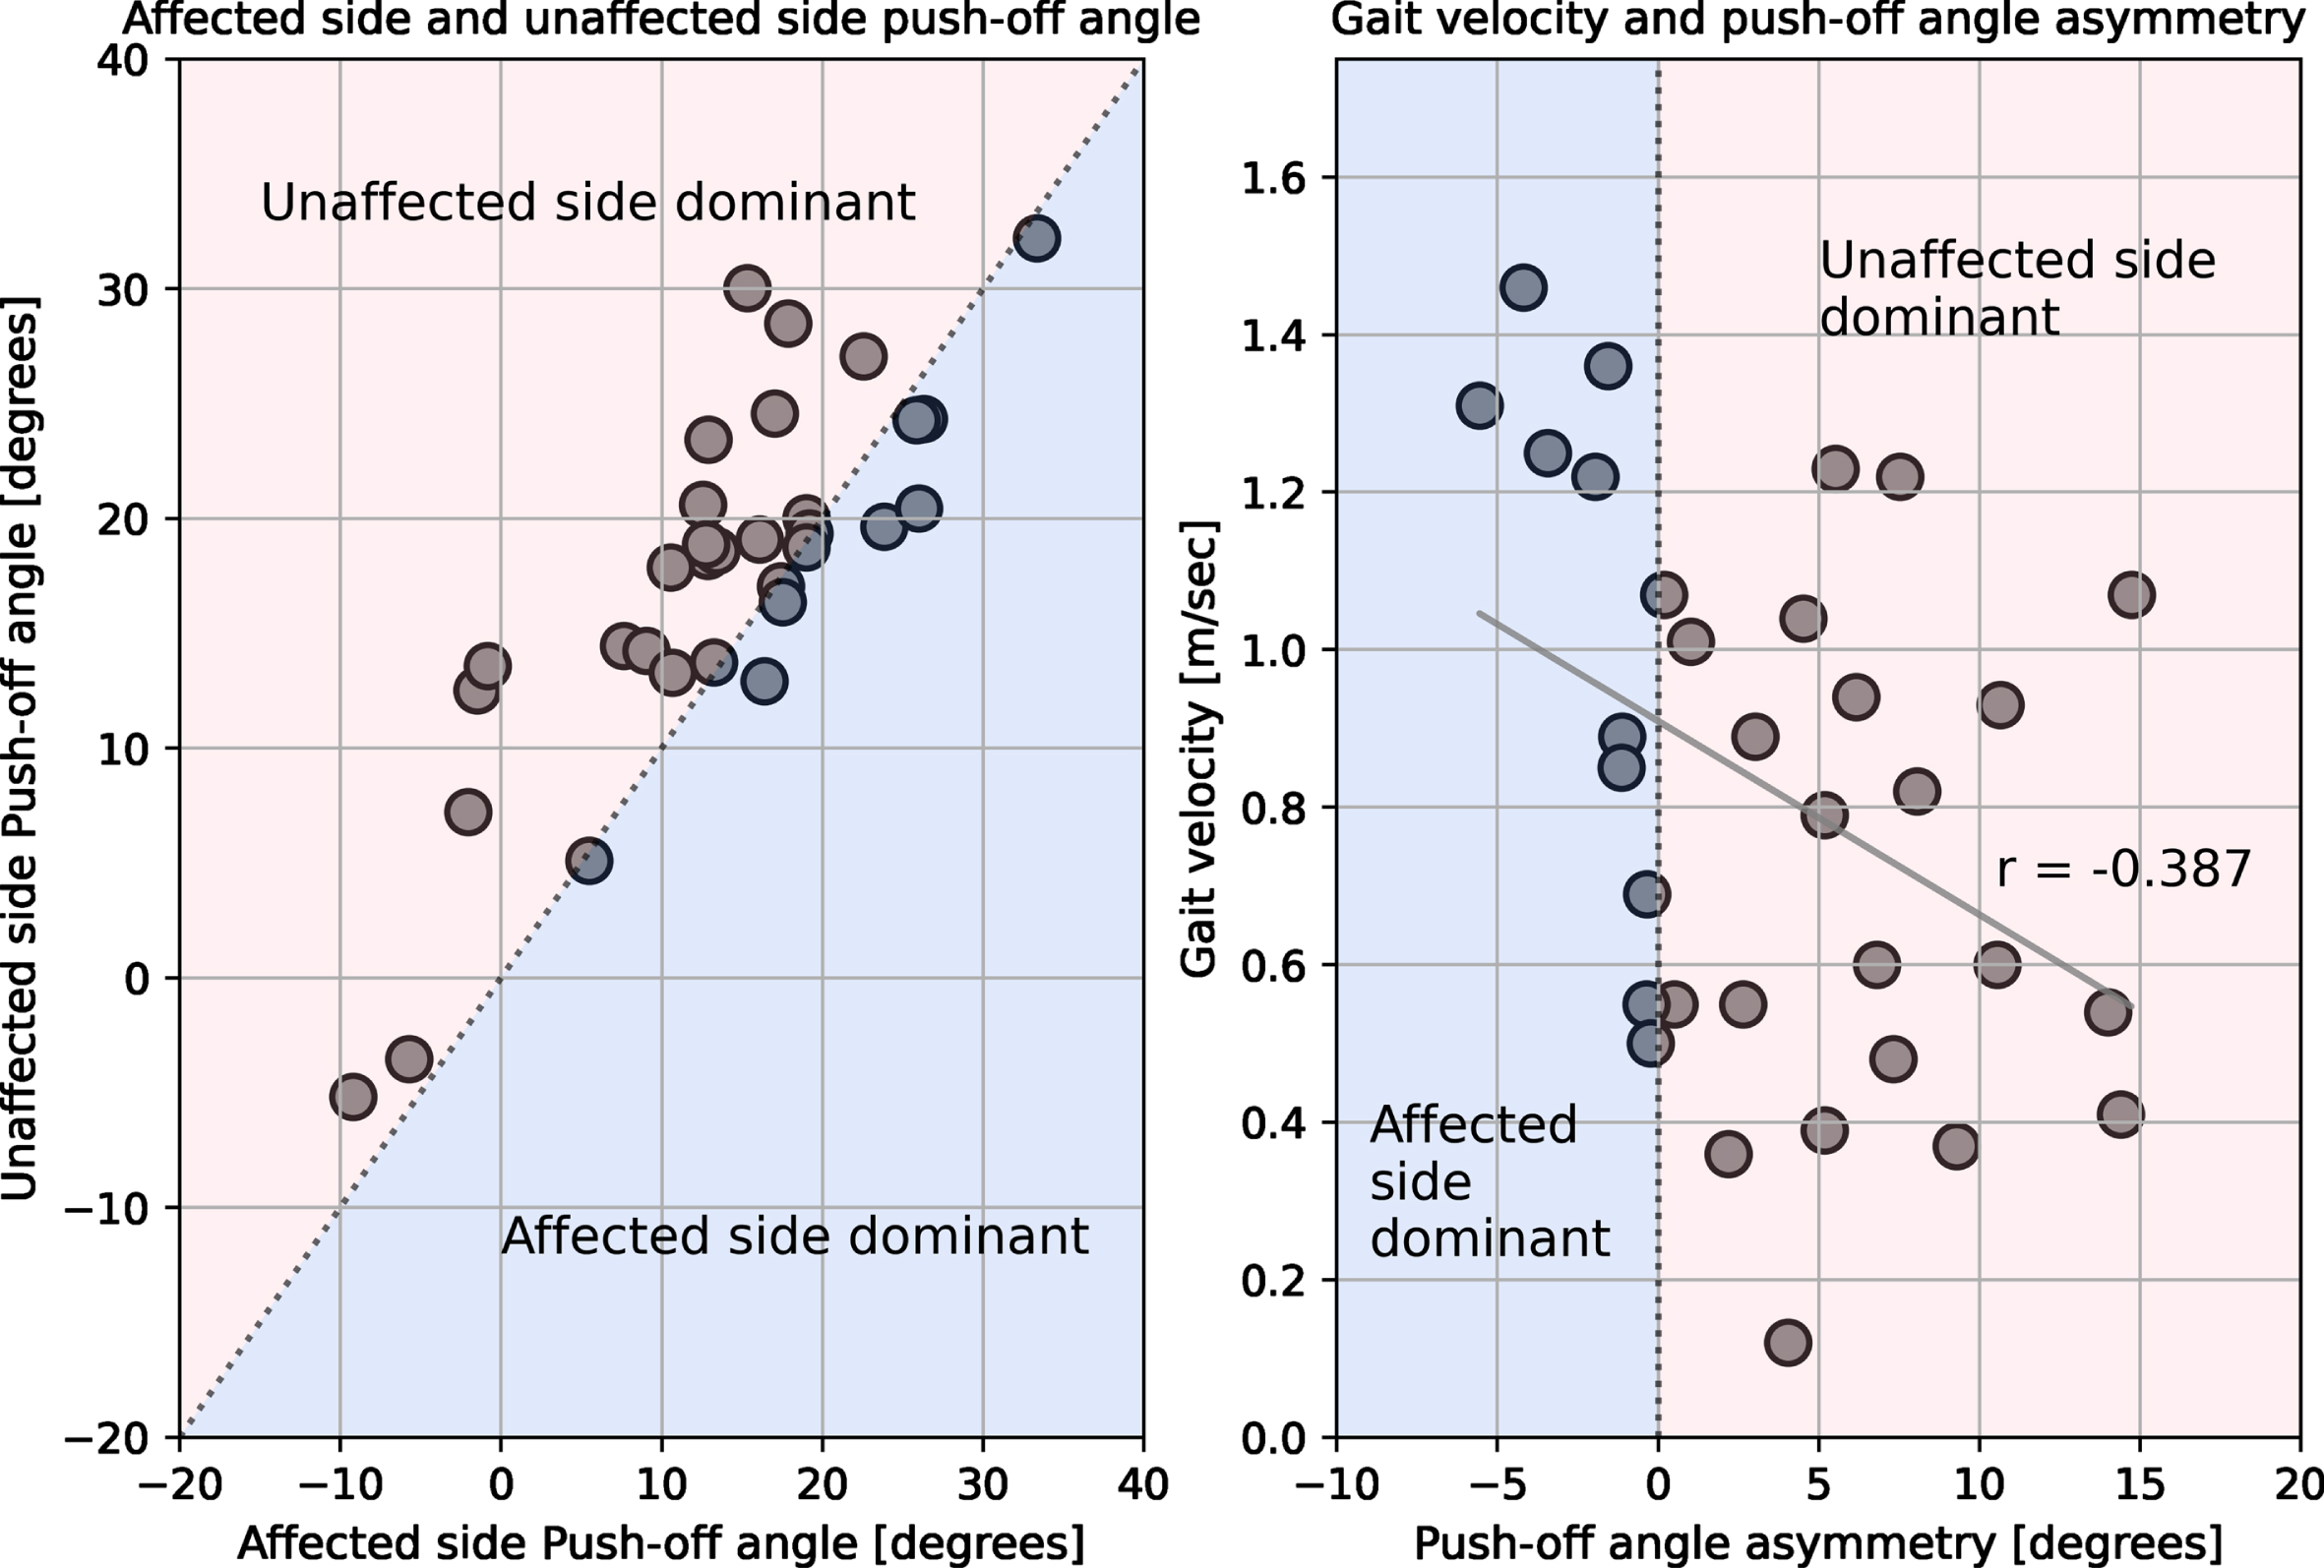
Scatter plot of the push-off angle, as well as its asymmetry and gait velocity. The left shows a scatter plot of the push-off angle on the affected side versus the push-off angle on the unaffected side, whereas the right shows a scatter plot of push-off angle asymmetry and gait velocity. The light red fill indicates a larger push-off angle on the unaffected side than on the affected side, whereas the light blue fill indicates a larger push-off angle on the affected side than on the unaffected side.
In this study, we found a moderate-to-perfect ICC, and a maximum of about 10 degrees of MDC of lower limb angles was measured in the sagittal plane images captured using a smartphone in patients with stroke. As expected, the push-off angle showed a moderate-to-strong correlation, and the push-off angle asymmetry showed a weak correlation with gait velocity. On the other hand, the contact and excursion asymmetry were not correlated with gait velocity. These results could provide insight into clinical gait assessment for post-stroke gait and its asymmetric patterns. The strength and novelty of this study are that it clarifies the reliability and validity of gait kinematics using video images captured with a smartphone camera, which can be easily applied to the clinical practice of stroke gait rehabilitation.
Two-dimensional video images of lower limb angles revealed a monophasic curve similar to the hip joint angle (Fig. 2). The contact angle was similar to the hip joint flexion angle reported in a previous study [23]. The push-off angle was similar to the previously reported trailing limb angle [17, 18, 24]. Asymmetry indices of each lower limb angle varied across participants; however, more than half were unaffected side dependent (Supplementary Table). This asymmetry pattern of post-stroke gait is consistent with the opinion of Roerdink [25]. Thus, the lower limb angle and its asymmetry were approximately the same as in these previous studies [17, 18, 23–25].
To date, the reliability of two-dimensional video gait analysis in the sagittal view after a stroke has not been investigated. In this study, because we adopted the average value of multiple strides, the ICC (2.3) of the lower limb angles was almost perfect [26]. Based on current results, if we want a within-session inter-rater ICC of 0.9 or higher, it is sufficient to measure two gait cycles. These results suggest that the lower limb angles measured in patients with stroke who can walk independently had almost the same reliability as those measured in healthy participants [27]. Furthermore, absolute reliability, such as MDC, is almost equal to that reported in previous studies, which is up to about 5 to 10 degrees [28–30]. Notably, the sampling frequency in this study is 30 frames per second; therefore, the measurement reliability might be significantly reduced due to blurry effects during faster gait velocity and during the swing phase. Furthermore, gait parameters of contact and excursion angles have not been studied, and the definition of push-off angle differs across studies of trailing limb angles [6, 7, 9, 16–18, 24, 31]. Future studies must establish concurrent validity with three-dimensional gait analysis and investigate the inter-session reliability with more participants and at various gait velocities.
In criterion-related validity, affected- and unaffected-side push-off and excursion angles showed a moderate-to-strong correlation. Push-off angle asymmetry showed a weak correlation with gait velocity (Table 3). Gait velocity is the product of step length and cadence; therefore, the strong positive correlation between gait velocity and excursion angle, which reflects a distance of approximately one step, is quite natural. Furthermore, leg length (i.e., trochantomalleolus distance) associated with step length did not correlate with gait velocity. Similar to aging [32], the impact of leg length on gait speed can be compromised by pathological conditions due to weak physical function. These results support that the gait speed does not have to be adjusted according to height or leg length.
Although the definition of the push-off angle in this study differs from that of previous three-dimensional trailing limb angles, the relationship between the push-off angle and gait velocity in the present study is consistent with the results of previous studies on trailing limb angle [9, 24, 33]. This shows that a larger push-off angle is associated with a faster gait velocity. The push-off angle in this study can offset the flexed postural displacement characteristics of patients with stroke with slower gait velocity [34]. Therefore, the push-off angle considering the flexed trunk is a reasonable assessment of post-stroke gait using two-dimensional video analysis. As further expected, the asymmetry of the push-off angle was weakly associated with slower gait velocity (Fig. 3). Kinematic strategies, especially asymmetrical gait patterns for walking faster, have been inconsistent across studies [13, 35]. Thus, the asymmetry of lower limb angles might not be an essential requisite to increase gait velocity. However, most stroke patients have shorter non-paretic step lengths [25], which are associated with weaker paretic propulsion compared to the unaffected limb [1] and reduced paretic hip extension compared to that on the unaffected side [36]. To assess underlying impairments, recovery, and compensation strategies of post-stroke gait, it is necessary to evaluate the amplitude of the push-off angle and its asymmetry.
The contact angle and contact/excursion angle asymmetry were not associated with gait velocity (Table 3). The contact angle, which is affected by the knee joint angle, is different from the hip flexion angle. Similarly, the contact angle affected by the trunk flexion angle differs from the foot placement relative to the trunk. Therefore, it cannot be compared directly with these previous studies [10, 11, 25, 37–39]. However, these kinematic parameters are less relevant to gait velocity [40]. Furthermore, leg swing is more variable among individuals [25]. Therefore, it may be reasonable that the result of the contact angle did not correlate with gait velocity. Concerning contact angle, it is an advantage to be affected by the knee joint angle; however, it is a disadvantage to be affected by the trunk flexion angle. This is because foot placement during the initial contact is affected by the knee flexion angle, and if the knee is flexed, the step length will be shorter and vice versa. However, even if the legs cannot be swung forward, the contact angle will increase if the trunk is bent. The effect of leg swing on the gait velocity may be extracted by calculating the angle between the vertical line from the centre of mass to the floor and the line connecting the foot from the greater trochanter, as in the foot placement relative to the trunk [25].
Spatial parameters of asymmetry such as step length are not consistently associated with gait velocity [25]. The excursion angle is similar to stride length, and this kinematic parameter is a spatial parameter of walking. Therefore, the excursion asymmetry not correlating with gait velocity is a reasonable result. Similarly, leg swing is more variable among individuals, and leg swing asymmetry does not correlate with gait velocity [25]. Therefore, the relationship between the contact angle asymmetry and gait velocity is also a natural result. To summarize the criterion-related validity, a greater push-off angle is associated with faster gait velocity irrespective of the affected side. On the other hand, asymmetrical gait patterns may not be a requisite for faster gait velocity.
The present study had some limitations. First, the reliability revealed by this study is within sessions. Future studies need to clarify the inter-session inter-rater reliability. Second, the concurrent validity with three-dimensional kinematic gait analysis, which is the gold standard of kinematic gait analysis, was not examined. Third, the sample size for verifying the criterion-related validity of this study assumed a moderate correlation. Therefore, the sample size is too small to detect weak or noncorrelations. Fourth, the relationship between lower limb angles and their asymmetry index with biomechanical measurements has not been investigated. Finally, but most importantly, acquiring two-dimensional coordinates manually can be very time-consuming. Further development of technologies, such as the DeepLabCut, that use deep learning iswarranted.
In conclusion, this study showed that measuring lower limb angles using video images captured using a smartphone is feasible. In particular, the push-off angle can be used within an error range of less than 10 degrees; further, it revealed a moderate-to-strong correlation with gait velocity. However, asymmetry in gait patterns may not be a requisite for faster gait velocity. These results could provide us a quantitative variable for clinical gait analysis in the evaluation of hemiplegic gait.
Footnotes
Acknowledgments
We would like to thank the rehabilitation therapists of Tokyo General Hospital for assisting us with the study.
Conflict of interest
The authors have no conflict of interest to report.
CRediT authorship contribution statement
Yu Kitaji: Conceptualization, methodology; software; formal analysis; investigation; resources; data curation; writing – original draft; visualization, and project administration. Haruhiko Sato: methodology; software; and writing – review and editing. Shinnosuke Ishida: conceptualization; investigation; resources; data curation; and writing – review and editing. Hiroaki Harashima: writing – review and editing. Satoshi Miyano: supervision and writing – review and editing.
Data availability statement
Research data are stored in the Mendeley data repository (Kitaji, Yu (2021), “Assessing gait asymmetry in patient with stroke by a smartphone”, Mendeley Data, V1, doi: 10.17632/p9rkcyd3cz.1). Datasets are available from the corresponding author upon reasonable request.