
Abstract
The article addresses theoretical issues, applied instruments and practical implementation of the behavioral valuation methodology. It formulates the range of specific correction parameters for beta coefficient, used in calculating CAPM-based discount rate in order to find behavioral discount rate and calculate stock’s market value, with regard to behavioral factors and risks associated with them.
The hypothesis that emotions influence the deviation of the beta coefficient used by irrational investors in the market from the beta coefficient used in the CAPM model was tested and confirmed. The range of deviations of the beta coefficient used by irrational investors in the market from the beta coefficient used in the CAPM model is presented. It can be used for specific practical applications in calculating the market value of shares.
The results of the studies described in the article are used in valuation, in corporate finance, in the stock market. It is especially important to use the tools of behavioral valuation in conditions of instability and crisis, a change in the market paradigm, market shifts, changes in the parameters of profitability and volatility of financial instruments. The use of behavioral valuation tools complements and expands the classic tools of traditional finance, improves the quality of value management solutions in modern markets.
Keywords
Behavioral pricing theory
Behavioral valuation is a core element of behavioral finance. Hersh Shefrin and Meir Statman created the basics of behavioral stock’s valuation in 1994 in their article “Behavioral Capital Asset Pricing Theory” [1]. A classic situation of irrational behavior in behavioral finances is illustrated by noise traders’ actions at the market [2]. While presenting their behavioral capital asset pricing theory, the authors analyze the influence of noise traders’ irrational behavior on price efficiency, volatility, abnormal return [3], volumes and survival of noise traders. Noise traders here are a generalized figure of the irrational player at the market [4].
Noise traders are opposed to information traders. Information traders are being instructed through Bayesian framework that allows reevaluating probability of hypotheses after learning the results of the tests that had led to a certain occurrence – in this case, to capital asset return of a certain level.
The authors stress no need in the behavioral pricing theory if the market consisted only of information, rational traders. On the other hand, as it would be appropriate to call them here, rational investors.
A market with only information traders acting as its participants, is based on price efficiency, with CAPM (Capital Asset Pricing Model) actively implemented. Another model, similarly named and opposed to CAPM, is BAPM – Behavioral Asset Pricing Model. It is validated by the behavioral capital asset valuation theory.
The authors of the behavioral capital asset pricing theory conduct a thorough and profound research of previous experience and provide evidences of CAPM-based asset pricing inefficiency, such as historical gaps between returns and value, with multipliers, of shares with various returns (January effect).
Other examples of inefficiency are related to excessive liquidity, excessive reaction reflected in option prices. The authors of the theory also associate them to the market premium puzzle, the puzzle of closed-end funds, inability to calculate risks by beta coefficient.
The authors of the behavioral pricing theory answer the question about the differences between efficient and inefficient market in the following way. At the efficient market, a single driver has influence on changes in mean-variance efficient frontier, portfolio return diversification, risk premium, temporal structure and option prices. This driver is the minimal portion of information, sufficient to conduct changes in portfolio return diversifications. What noise traders do is introduce a second driver into the market commotion. This noise traders’ driver is what diverts prices from efficiency.
In Shefrin and Statman’s theory, noise traders weaken the mean-variance efficient frontier; create excessive abnormal returns on particular securities. They create a link between the slope of the yield curve and the risk premium on the market portfolio. They create a gap between the subjective volatility implied in option prices and its analogues.
The authors of the theory stress that noise traders are important not as an isolated occurrence but as a manifestation of the behavioral factor at the market. They reflect general cognitive errors.
The authors of the behavioral pricing theory use several theorems to prove their theory. The central, eleventh theorem is the foundation for calculation techniques used in behavioral valuation.
The formulation of this theorem is preceded by a chart that illustrates the basics of the behavioral pricing theory (Pic. 1).
It is an eloquent and profound presentation of behavioral asset valuation model that was formulated almost at the same time as the Prospect Theory. Both theories create a theoretical foundation for empiric financial behavioral researches.
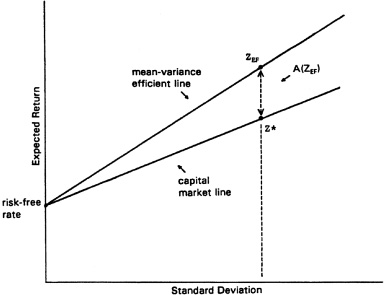
Graphic presentation of CAPM and BAPM.Source: H. Shefrin and M. Statman, Behavioral capital asset pricing theory, Journal of Financial and Quantitative Analysis
The theorem 11 notated with the formula (1): A(Z) = ([Beta(Z)/Beta(p*)]-Beta*(Z))*(E 𝛱(p*) - 1 - iI ), where A (Z) is the expected abnormal return of portfolio Z; p* is the mismeasured risk factor for market return at efficient prices, i.e. when probabilities (expectations) of occurrences belong to the state matrix constructed for the market; Beta (Z) is the “true beta”, beta coefficient calculated for the existing market premium; Beta (p*) is the beta coefficient calculated by p* and market return; Beta* (Z) is the market beta to evaluate risk share from p* in portfolio Z; E 𝛱(p*) is the expected market return given by p*; i I is the information trader’s risk-free rate.
The key point with Shefrin and Statman is the CAPM model calculates that one beta as usual, while the other depends on the straying variable virtual return with asterisk (in formula).
The theorem 11 claims: If prices reflect efficiency than the expected abnormal portfolio, return equals to zero.
So, if the portfolio return is perfectly correlated with p*, the expected abnormal return on the portfolio equals to zero.
The theory, the part of it referred to risk premium analysis, creates a correlation between abnormal returns and betas. It creates the basics for constructing the behavioral discount rate (BAPM — Behavioral Asset Pricing Model). In accordance with the theory, irrational actions at the market weaken the link between securities return and its beta. They create positive conditions for interconnection between abnormal return and beta.
The behavioral asset pricing theory created by Shefrin and Statman is an analogue to CAPM (capital asset pricing model), the foundation for traditional finances. Two trader groups are engaged in BAPM (behavioral asset pricing model): information traders and noise traders. Information traders are CAPM users. They are free of cognitive errors and have mean deviations. Noise traders are out of CAPM influence. They make cognitive errors and have no standard deviation limitations.
In BAPM, expected return on securities is defined by the behavioral beta coefficient, calculated on the basis of mean deviation on efficient portfolio. But this base is not equal to the CAPM portfolio, as noise traders distort market prices, influence on them. So, if there are blind spots and imperfections in defining and creating portfolios for CAPM-processed beta calculations, the problem of defining the base to BAPM-calculate beta is even greater. Depending on investors’ preferences, portfolios with standard deviation efficiency can change every month, influenced by noise traders – investors’ preferences.
This part represents the methodology of behavioral beta calculations in accordance with the Hersh Shefrin and Meyr Statman’s behavioral pricing theory. This methodology is based on the link between behavioral valuation instruments and classic pricing valuation instruments, as well as new valuation models.
The quintessential part of analytic instruments is measuring the emotional background of news. Emotional valuation of news background is built on processing all news related to valuated companies on a scale of seven levels. All news related to behaviorally valuated companies, are distributed in seven levels, as shown in Table 1.
Emotional valuation of news background
Emotional valuation of news background
Source: Author’s research.
Calculations and analytical actions within the discounting cash flow method are effected as follows. First, indices and news are downloaded from an analytic system within the explored retrospective. Researches were conducted in two international systems: Bloomberg and Thomson Reuters. Commands mentioned further are taken from the Bloomberg system [5]. They are similar to the ones in the Thomson Reuters. It should also be taken in consideration that Russian e-commerce and informational platforms, such as Prime, currently show rapid growth in the same area and can be used with proper subscriptions.
Not only stock quotes and actual asset trading characteristics at the stock exchange market are downloaded, but also the analytics for investment strategy decision-making about this asset.
While creating a set of Bloomberg-related analytical instruments, the following factors are downloaded:
BEST_EST_LONG_TERM_GROWTH – expected long-term growth required for calculating profit increment or cash flow.
Last Price – market price quotes of a stock at the end of the day.
Stock’s quotes are compared to its market value. The market value is represented in the Bloomberg by “BEst Target Price” function (or field). Translated directly, it means, “best target price”, while in fact BEst goes for “Bloomberg estimate”, in that case – estimated market price. The fields that contain this information from Bloomberg, contain lots of analytical information related to various aspects of corporate finances and pricing: discount rates, profit increment rates, cash flow rates, the amount of cash flow per share, and so on.
The next important component of pricing instruments applied in the behavioral analysis, is the BETA coefficient. In Bloomberg it is the Applied Beta for EQRP – the beta applied to calculate discount rates on equity. In accordance with the descriptions or requests within the info system, it reflects information on percentage of stock price variance with regard to the reference index variance by 1%. Therewith, both current and historic values are available for analysts to use it for building an informational retrospective.
The major importance in calculations has the data used by the analysts that have planned a certain value of equity at the moment of stock prices being quoted. For the Bloomberg info system, this index is shown in the “WACC Cost of Equity” field. The weighted average cost of capital includes the cost of equity.
The next major index used in calculations of behavioral valuation-linked indices is market premium. This index is named differently in different info systems and, what is more important, in the literature on valuations. So, we are talking about the market premium – the difference between the market return and the risk-free rate [6,7]. In Bloomberg this index is called ‘Country Risk – Premium’. COUNTRY_RISK_PREMIUM.
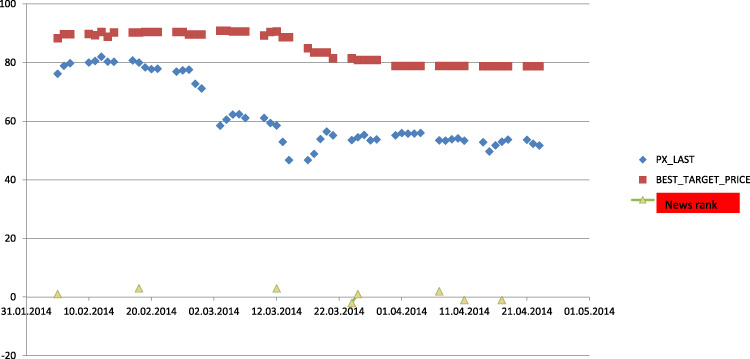
Graphic interpretation of results of behavioral analysis for PX_LAST quotes and BEST_TARGET_PRICE for aeroflot shares.Source: Author’s calculations.
The index of risk-free return in Bloomberg is named ‘Country Risk - Risk Free Rate’. The code for this command in Bloomberg is VM103. Risk-free rate. Abbreviation - COUNTRY_RISK_RFR.
So, the calculating method is the following. The market value of stocks with quotes specified for every given date is calculated by the Gordon formula – formula (2): Vo = FCFE / (r - g) , where FCFE is the free cash flow for equity; r is the cost of equity; g is the increment in cash flow (if absent in the system, considered equal to increment in profit).
For data downloaded from the system for every given date and every stock quote, there is a return on equity rate, the cost of securities calculated by analysts, and the rate of growth. The only unknown number is the cash flow to equity. It is expressed in the above-mentioned equation through its visible components, and calculated accordingly.
The next step is to add stock quotes to the equation above instead of their value, and behavioral discount rate (BAPM) – instead of return rate to equity, i.e. the behavioral discount rate that corresponds market realities and trends. It is unknown. Yet, all other components of the formula, including the recently calculated cash flow to equity, are already defined. The equation is solved with regards to BAPM.
Then, empiric calculations are conducted, based on the following statement that corresponds the Statman and Shefrin’s theory. BAPM – behavioral discount rate – is different from the discount rate calculated by the capital asset pricing model (CAPM) with the beta coefficient. Upon downloading analytic data on valuations depicting all companies, analysts get all the components for the CAPM-linked discount rate notation.
In order to find the irrational, behavioral beta – the beta used in value calculations by irrational market players, the invariable summands, such as the risk-free rate and the market premium, are substituted in the discount rate formula. Beta irrational is notated with the formula. It is calculated and compared with the current beta of the formula for the discount rate on equity.
The beta coefficient used by irrational market players – formula (3): Beta irrational = ( Rbapm - Rf ) / Rm, where Beta irrational is the beta coefficient used by irrational market players, Rbapm is the discount rate that equalizes market stock quotes with estimations of the market value by Gordon’s model, Rf is the risk-free rate, Rm is the market premium (the difference between market return and risk-free rate).
All calculations by the procedure mentioned above were performed, to start with, for blue chip companies at the Russian stock exchange market. The results confirmed that the information about them doesn’t allow the behavioral pricing theory to be applied. First, because their shares were underestimated by the market in a long-term perspective. The process is illustrated by the Pic. 2. It shows the progress of Aeroflot stock quotes and market values of shares. Emotional measures are shown at the bottom of the picture. The graphs show that emotional ups and downs are aligned with the stock quotes. But, as the price and market value graphs do not meet, it is impossible to detect deviations in beta irrational and beta rational.
The graphic interpretation of results, achieved from behavioral analysis of Aeroflot stock quotes and market values of shares, proves that in this case the behavioral pricing theory is not based on anything. Stock quotes consistently stay below the market value.
So, the theory is not applicable for undeveloped stock exchange markets, with limited liquidity. There is no sufficient trade value for the effects of excessive and insufficient reaction to be manifested – the effects that come with negative or positive news, leading to undervaluation or overvaluation of assets.
In that case, thoroughly analyzing the graphs, we can see that positive news push the stock quote line towards the market value. To the contrary, negative news decrease it even more; take it away from the value benchmark.
So, the focus of the research was shifted to foreign stock exchange market. The most prominent and visual example of a behavioral analysis that doesn’t arise any doubts is the Tesla company. In 2017, the guru of all valuators in the world, Aswath Damodaran, published his famous article [8] where he justified a considerable overvaluation of Tesla stock quotes over their market value-based valuation, calculated traditionally.
All collected analytical tools along with the newsfeed grouped through the mood scale, are used for analysis.
Let’s execute a behavioral analysis of the influence that the negative and the positive background has on the difference between this company’s market value and its traditionally calculated market value-based valuation.
A fragment of this analysis is represented in the Table 2.
Fragment of behavioral value analysis for Tesla shares
Fragment of behavioral value analysis for Tesla shares
Source: Author’s calculations.
In order to understand the non-applicability of residual income valuation [9] and impossibility to calculate the irrational and rational beta coefficients, we can look at the net assets per share, presented after the column with the main result of behavioral pricing calculations, i.e. the difference between two betas. As they are negative, the method is not applicable. Its non-applicability is also confirmed by the earning per share ratio, given by the info system. It is interesting to note the difference in the return on equity indices offered by the system – the normalized ROE and Bloomberg-calculated ROE.
So, the calculations show that the Tesla behavioral analysis is completely in line with the behavioral pricing theory, and the variability of indices can be explained by its analytical instruments.
The graph at the Pic. 3 represents the shift of the company’s share prices and market values of share over the entire length of data collected from info systems. As shown at the graph, the left part of occurrences represented there fits the outline of the behavioral value analysis.
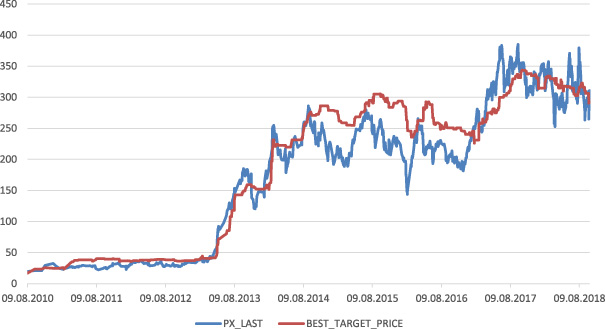
Shifts in price and market value of Tesla shares. Legend – PX_LAST – stock quote, BEST_TARGET_PRICE – market value.Source: Author’s calculations.
The next company is the United States Steel Corporation. This company was chosen to illustrate the practical implementation of the behavioral pricing theory and the empirically based estimation of its key parameters by the following reasons.
First, it is an investment-friendly, historic American company with good liquidity and interesting price shifts.
Second, the analyzed period was followed by a string of emotionally loaded events in the US steel industry, such as drastic decline in US steel sector caused by the growth of steel industry in other countries and huge competition with its dumping prices at the local market. The situation turned to the positive after the US government issued sanctions. It can be seen at the Pic. 3.
The Pic. 4 shows the influence of news on the difference between stock quotes and market prices. The most prominent divergence points are pinpointed.
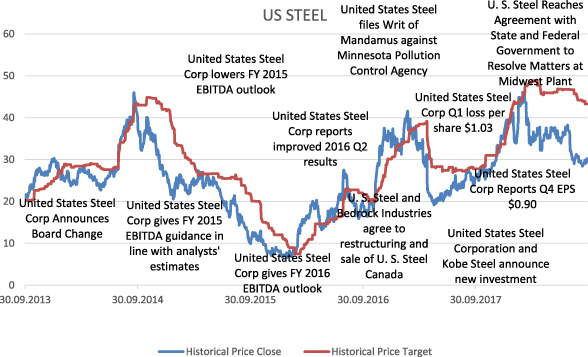
News and their influence on variance of stock quotes and market value for the US steel company. Historical Price Close – historical stock quotes, Historical Price Target – historical market value.Source: Author’s calculations.
Third, a US steel company is a classic example of a capital-intensive large successful company with a long history. Its example is great to regards the shift in beta rational and beta irrational not only in the cash flow discount valuation but also in the residual return valuation.
Just like for the previous cases, we create a news table in the Thomson info system and use the VLOOKUP command in Excel to combine it with the data structure downloaded at the Bloomberg info system. The indices are calculated using the same method as in the Tesla case.
Similar analysis was conducted for the Embraer company, interesting to be behaviorally analyzed and rich in emotional news background.
While creating any new valuation methods, implementing new indices, it is always very important to provide reference tables to the community of analysts and valuators, in order to help them navigate through various market situations and use certain ranges of estimated coefficients while applying those methods. Such reference material can be particularly valuable for implementing such new valuation mechanism as behavioral valuation.
Although after processing dozens of companies, both Russian and foreign, we haven’t collected enough final data that would totally fit the conditions for the behavioral pricing theory, a statistically sufficient database has been collected. Sufficient to make certain conclusions about the intervals where the analyzed indices are located.
Fragment of initial data used to define calculated deviations of irrational beta and CAPM Beta at the western stock exchange markets in the context of the market emotional sentiment
Fragment of initial data used to define calculated deviations of irrational beta and CAPM Beta at the western stock exchange markets in the context of the market emotional sentiment
Source: Author’s calculations.
A fragment of original database on Tesla, US Steel and Embraer is represented in the Table 3.
The interval limits are allotted to the scale of sentiment in accordance with the Table 1. For each division of this scale, applied to the whole collected and arranged database, we can identify the deviation of real, irrational, behavioral beta – a component of the capital asset pricing model – from the one used by analysts while calculating discount rate in theory, based in the classic pricing theory. The one where the risks, connected to investments in the valuated company, are identified “correctly” from the point of view of statistics and classic finances. This final data for Western market companies is represented in the Table 4.
So, now, using the behavioral pricing theory and the results of empirically calculated standard for the particular, actual market data, we can define the most credible share price, considering the market sentiment, measured through the technique represented in calculations.
Deviation of the irrational investors’ beta coefficient from the CAPM- Beta at the western stock exchange markets in the context of various emotional sentiments in investors
Source: Author’s calculations.
Use the table of news background emotional valuation to define the beta deviation index compared to the classic beta. Correct the classic beta. Recalculate the discount rate using the capital asset pricing model. Calculate share value, using the modernized, or so-called behavioral discount rate given by the irrational beta. The beta used by real, or irrational investors, regardless of whether they have a certain share at the market or take the whole market for themselves, as it is their historical stock quotes that prevail in the expectations of market players.
In order to test the hypothesis about the variability of beta coefficient in accordance with the various emotional backgrounds at the market and investors’ various emotional sentiments, corresponding calculations were made.
Those calculations tested the statement that irrational beta is different from rational beta due to emotional factors existing at the very moment of valuation. This hypothesis is tested separately for each deviation range of two beta coefficients for each division of emotional scale specified in the Table 1. Each scale division (from pessimism to optimism) shows a certain deviation variance, a selective standard deviation. As deviation can be positive or negative, the two-sided test is used.
Zero hypothesis is that the betas of irrational and rational investors are identical. The data processed with the Excel statistic package, showed that the hypothesis about the influence of the market emotional background and investors’ sentiments to the beta coefficient of CAPM - calculated discount rate, is true.
The article offers a pilot study on aligning valuation instruments in the context of the behavioral pricing theory. The more profound and extensive are the abnormalities at the financial markets, the more obvious and vital the necessity to use new instruments for value-defining financial decisions is for all market players. Despite the fact that the foundational studies in behavioral valuation were conducted a quarter of a century ago, yet a sustainable, simple, tested practical implementation of this theory has been delayed. With this research, the author attempts to make up a lost ground, to offer a new valuation instrument to fundamental analysts, value experts and valuators.
As seen from hypothesis test results, conducted calculations and tables of deviation ratios, this attempt has led to certain results. How to enhance and strengthen them? How to make possible a stable application of this method in the future? Provide consistency of current and past results? The answer is in the rightmost column, more specifically in the emotional scale. It requires updating the general range of market indicators with the emotional sentiment indicator, similarly interpreted by all market players, reasonably identified, widely published and accessible. Yet, this is a topic for further studies in behavioral finances.
Footnotes
Conflict of interest
None to report.