
Abstract
Wireless sensor technologies open up new possibilities for optimizing product quality and spoilage in the perishables supply chain. In particular, the processing of sensor data such as temperature information allows for the construction of novel issuing policies in retail distribution centres for fresh or frozen goods (e.g., meat, fish, fruits, vegetables, flowers). The objective of the present study is to investigate the potential of sensor-based issuing policies in comparison to classical policies based on identity and expiry information. In a simulation study, we consider a three-echelon supply chain model, including a manufacturer, a distribution centre, and a retail store. We investigate the impact of different combinations of issuing policies and customer withdrawal behaviours on the quality of sold goods and total spoilage. Our results show that sensor-based issuing policies may pose an effective complement to conventional issuing policies. However, they also indicate that wireless sensors are no one-size-fits-all solution and that important trade-offs must be taken into account in the selection of a specific policy.
Introduction
In order to uphold their competitive position, retailers worldwide depend on innovative tools for the management of their supply chains. The handling of perishable goods in cold chains provides a typical example, where the combination of new technology and appropriate management concepts can help to avoid shipments becoming damaged or otherwise compromised. Herein, the term ‘cold chain’ refers to a temperature-controlled supply chain in which specialized packaging (e.g., all-insulated shipping containers) and transportation means (e.g., refrigerator trucks) are used to maintain the quality and value of a shipped good (Bogataj, Bogataj, & Vodopivec, 2005). The monitoring of temperature is of utmost importance as it determines product quality due to its direct influence on microbial growth (Jedermann, Ruiz-Garcia, & Lang, 2009; Nunes, Emond, Rauth, Dea, & Chau, 2009).
It is, hence, imperative for a retail company to establish a comprehensive logistical process through the integration of traceability with operations management functions to avoid temperature anomalies causing both food safety issues and economic losses (Wang, Li, & O’Brien, 2009). Nevertheless, critical temperature deviations from optimal conditions in cold chains are a widespread phenomenon in practice to date (Laguerre, Hoang, & Flick, 2013), and grocery retailers have a keen interest in reducing the amount of spoilage as it constitutes a major determinant of the total turnover and profit margin (Rodríguez-Bermejo, Barreiro, Robla, & Ruiz-Garcia, 2007). In a study of global food waste, Gustavsson et al. (2011) found that approximately one third of food produced for human consumption is lost or wasted globally, which amounts to about 1.3 billion tons per year. A high proportion of the food spoilage already happens before products arrive at the customer (Parfitt, Barthel, & Macnaughton, 2010), which is why there is an evident potential for further efficiency gains in today’s cold chain operations. In addition, spoilage poses a financial loss including not only the value of the goods in question, but also the associated costs for transportation and storage in the supply chain. Besides its food safety and economic impacts, spoilage also attracts increasing attention in society as it constitutes an ethical and environmental concern (Kummu et al., 2012).
The hope and expectation among several practitioners is that the emergence of inexpensive wireless sensors may become a suitable technological means to guarantee seamless and fine-grained product quality control from the manufacturer to the point-of-sale (Amador, Emond, & Nunes, 2009; Ruiz-Garcia, Lunadei, Barreiro, & Robla, 2009). However, to leverage the data quality offered by a sensor infrastructure, additional changes on a process level are necessary (Luo, Fan, & Zhang, 2012). This holds particularly for the design of issuing – also known as picking, withdrawal, or dispatching – policies, which determine the order in which products are removed from inventory and shipped downstream along the supply chain (Haijema, 2014). It is against this backdrop that the present study considers the use of wireless sensors in combination with novel issuing policies in a retail distribution centre, where products are selected to fulfil an incoming order from a store. Our objective is to compare the performance of novel policies based on sensor data with conventional policies (e.g., ‘First In First Out’). For this purpose, we present and discuss results from a simulation study relating to performance metrics, such as product quality and spoilage.
The remainder of the paper is organized as follows. Section 2 provides the conceptual background with the technological foundation and related work. In Section 3, we develop a simulation model of a multi-echelon supply chain followed by the experimental design, the simulation results, and a sensitivity analysis in Section 4. The summary and conclusions are presented in Section 5.
Related work
Supply chain technologies
The quality of perishable products can deteriorate in many different ways depending on environmental factors such as humidity and brightness or product mishandling. Among all possible factors, the exposure to an out-of-the-optimum temperature range during transportation and storage has the highest negative influence on product quality (Hafliðason, Ólafsdóttir, Bogason, & Stefánsson, 2012; Montanari, 2008). Hence, data concerning the temperature that a perishable good was exposed to provides the most important information for estimating its quality. For this purpose, a variety of solutions for temperature monitoring in supply chains is available on the market (Raab, Petersen, & Kreyenschmidt, 2011). Electromechanical chart recorders, for instance, record the temperature in a room or vehicle over time resulting in a graph or chart of the data printed on paper, which must be processed and interpreted manually (Ruiz-Garcia & Lunadei, 2011). Temperature data loggers are smaller and cheaper compared to chart recorders and are able to store digital or analogue data in a built-in memory (Raab et al., 2011). However, a cable connection (e.g., via USB) is usually required to obtain the data from the device. Time Temperature Indicators (TTI) are small, inexpensive labels used during shipment, storage, or processing to ensure cold-chain compliance (Smolander, Alakomi, Ritvanen, Vainionpää, & Ahvenainen, 2004). The underlying functional principle is an incorporated dye that diffuses or a colour-changing chemical substance that begins to flow along the quality-indicating range (Heising, Dekker, Bartels, & Van Boekel, 2014), indicating a significant difference between nominal and out-of-range temperature by the rate of flow of a chemical substance. While a TTI can visually indicate if a temperature limit overrun has occurred, it only monitors the cumulative deviation from optimal temperature exposure but not the estimated present quality level (Jedermann, Nicometo, Uysal, & Lang, 2014; Urien & Piramuthu, 2013). Moreover, TTI labels have no means to communicate with a reading device to automatically transfer data to an information system (Piramuthu & Zhou, 2013; Qi, Xu, Fu, Mira, & Zhang, 2014).
In recent years, significant technological progress can be observed in the area of wireless technologies (Liu, Bolic, Nayak, & Stojmenović, 2008; Miorandi, Sicari, De Pellegrini, & Chlamtac, 2012). So-called ‘smart sensors’ or ‘smart tags’ – a combination of integrated sensors equipped with RFID technology – are being researched as prototypes (Abad et al., 2009; Abarca, de la Fuente, Abril, García, & Pérez-Ocón, 2009; Frank, 2013) as well as being available as off-the-shelf systems from various technology suppliers (Grunow and Piramuthu 2013; Badia-Melis et al., 2014). Smart sensors have a number of advantages over today’s widely used technologies in cold chains. For example, the connection between sensor technology and wireless data transmission allows for fully automatic data collection. In addition, sensor measurements are stored in memory, which allow for the inspection of temperature changes along the time axis. These features, taken together with the small size and low cost of sensor tags, make it possible to monitor logistical units on their way from the manufacturer to the store.
Issuing policies for perishable goods
Inventory management for perishable goods has been studied extensively in the operations management literature since the 1960 s (Bakker, Riezebos, & Teunter, 2012; Li, Lan, & Mawhinney, 2010). However, comparatively little or no field applications take the factor of perishability of products into account affecting the issuing of goods. In early studies, the focus was on traditional issuing policies such as FIFO and/or LIFO examining how to manage perishable and aging inventories (Karaesmen, Scheller– Wolf, & Deniz, 2011; Nahmias, 1982). Further heuristics based on an item’s production data or delivery date were proposed, for example, by Huq et al. (2005) and Thron et al. (2007).
Among the first to examine the practical use of temperature monitoring technologies for the construction of novel policies was the study by Labuza and Taoukis (1990). The authors introduce the quality-based issuing policy ‘Least Shelf-life, First Out’ (LSFO) for which a TTI is considered. They suggest a transition from FIFO to LSFO by providing a consumer indicator (i.e., a TTI) which reveals products’ proper handling and reduces customer dissatisfaction. On this basis, Giannakourou and Taoukis (2003) assess the applicability of the TTI technology for the cold chain in a field study. After providing evidence of TTI effectiveness, they conduct a numerical simulation to investigate the potential of a LSFO system facilitated by TTI. They conclude that the application of LSFO provides acceptable quality and minimization of rejected products at the consumer end.
It was only recently that the potential of smart sensors in supply chains became a research issue in the management literature. The studies by Grunow and Piramuthu (2013) and Ketzenberg et al. (2015) consider an item’s shelf life estimated via smart sensors to show the economic value of sensor information in the management of the perishables supply chain. However, a limitation of both studies may be seen in the fact product quality is modelled as a function of time (i.e., quality is not measured but rather estimated from timestamp information). As a consequence, products of the same age class perish at the same time, which poses an assumption that does not hold in many real-world settings. In contrast, only few researchers take temperature sensors into account in the issuing of perishable goods. To our knowledge, Dada and Thiesse (2008) were the first to study sensor-based issuing policies in a supply chain of perishables. The authors examine the impact of sensor data usage on the average quality of sold items, stock-outs, and low quality sales. Their results indicate that the issuing policy ‘Lowest Quality First Out’ (LQFO) proves to be a reasonable compromise between a retailer’s different objectives, followed by a policy based on expiry date information. The concept of the ‘dynamic FEFO’ issuing policy in the context of a sensor-equipped container was presented by Lang et al. (2011) on the foundation an online monitoring and decision support system. Similarly, Qi et al. (2014) present a ‘Cold Chain Shelf Life Decision Support System’ based on wireless sensor nodes. Though the study describes the advantages of LSFO over FIFO provided by their system, the authors do not substantiate their assertion by conducting a performance comparison.
Model development
Conceptual background
In this paper, we aim to fill a gap in the literature regarding policies for the issuing of perishable goods enabled by wireless sensor technologies. Our literature review revealed that issuing policies for perishables are subject of research, but in most cases it is limited to traditional issuing policies (e.g. FIFO and LIFO) and, if at all, to only one technology (e.g. TTI or smart sensors). We take the work in the area of issuing policies for perishables one step further in that we draw on the work of Dada and Thiesse (2008) but take additional issuing policies and combinations thereof with different customer withdrawal behaviors into consideration. Our primary objective is to gain a better understanding of the specific characteristics of these policies in comparison to policies that rely on established technologies, for example, the barcode. In contrast to prior research, our study is not limited to a comparison of FIFO/LIFO vs. a single issuing policy using sensor data; in fact, we analyse a broader spectrum of issuing policies that rely on different forms of product quality measuring. Moreover, we consider both, quality of sold products and spoilage, as the performance criteria of interest. In order to circumvent some of the simplifications that become necessary in analytical modelling to achieve mathematical tractability, we make use of the simulation method as our means of investigation.
We examine a three-echelon supply chain model including a manufacturer of perishable goods, a distribution centre (DC), and a retail store (RS) as depicted in Fig. 1. An overview of the notation used in the following is given in Table 1. Despite its limited complexity, the supply chain model captures the essential elements of a cold chain and allows us to conduct meaningful experiments with a broad variety of issuing policies. We distinguish between different conventional issuing policies with and without TTI based on the time of arrival at the DC and those based on product age (see Section 3.2). Furthermore, we consider novel sensor-based issuing policies for which the product quality is the primary criterion. The purpose of our model is to enable a rigorous comparison between the performances of different issuing policies at the DC in combination with different customer withdrawal behaviours at the RS. To this end, the performance characteristics product quality and total spoilage are reported to identify the strengths and weaknesses of each issuing policy.

Supply chain model for simulation.
Notation overview
We make the following assumptions regarding the simulated supply chain: We consider a single perishable product, which in most of the inventory control studies is common practice due to the high complexity of a multi-item model (Bakker et al., 2012). The product has a fixed shelf life, which is indicated by an expiry date associated with each item by the manufacturer (Broekmeulen & van Donselaar, 2009). Product deterioration is not merely function of time, but characterized by a daily calculated deterioration rate. This modelling choice sets time (pa) apart from quality (pq), which are usually correlated, but might differ in certain scenarios (e.g. cooling system failure or careless storage). A given quality threshold defines the minimum quality level below which it is considered as spoiled. The retailer operates the supply chain under a service level constraint to reduce the occurrence of stock-outs. The manufacturer has sufficient production capacity to fulfil any incoming order from the DC. The DC and the RS use the (Q,r) inventory control policy, which is commonly used in practice for perishable goods (Kouki, Sahin, Jemaï, & Dallery, 2013; Olsson, 2014). When the inventory position drops below the reorder point r, a replenishment order of size Q is placed. Q is exogenously given (e.g. by long-term contracts between the retailer and the manufacturer) and is not subject to optimization. The lead time between the manufacturer and the DC (LMD) is a uniformly distributed random variable because the distance between the two supply chain nodes is usually longer and vary more in length than between a DC and RS. The lead time between the DC and the RS (LDR) is constant, which reflects the fact that the delivery frequency of perishables is usually about one day (Broekmeulen & van Donselaar, 2009). In the case an order cannot be completely fulfilled, the available items at the DC are shipped to the RS. All incoming goods at the DC and the RS are inspected for sufficient product quality if technically feasible by means of a TTI or smart sensor. In addition, we assume periodic reviews of all stored items within the DC and the RS once a day as this procedure is most common in the grocery industry (M. Ferguson & Ketzenberg, 2006). The daily customer demand rate at the RS is probabilistic. In case of stock-outs, demand is not backlogged, that is, sales are lost.
An issuing policy corresponds to a selected order of goods issuance in the inventory in case of an incoming demand (Haijema, 2014). We draw on the work from Dada and Thiesse (2008) and extend the set of proposed issuing policies each based on one of the item withdrawal criteria ‘arrival time,’ ‘product age,’ or ‘product quality’ at the DC. The considered issuing policies are characterized as follows: Service In Random Order (SIRO) provides the benchmark to which all other issuing policies are compared. Under this policy, the DC selects products to be shipped to the RS randomly and completely independent of their product age or quality. First In, First Out (FIFO) issues products according to their arrival time, that is, the items which arrived first in the DC are shipped first to the RS. Last In, First Out (LIFO) issues products according to their arrival time, that is, the items which arrived last in the DC are shipped first to the RS. First Expired, First Out (FEFO) follows an age-based issuing strategy with the items which were manufactured earlier being the first to be shipped to the RS. Last Expired, First Out (LEFO) follows an age-based issuing strategy with the items which were manufactured later being the first to be shipped to the RS. Highest Quality, First Out (HQFO) relies on the estimated quality of items with the highest quality being shipped before any other items. Lowest Quality, First Out (LQFO) relies on the estimated quality of items with the lowest quality being shipped before any other items. In addition, we consider enhanced variants of FIFO, LIFO, FEFO and LEFO using a TTI label that allows for a simple form of item-level quality inspection. It indicates whether a particular item should be disposed of when its quality level is below the acceptable minimum. Thus, the four policies (FIFO_TTI, LIFO_TTI, FEFO_TTI, LEFO_TTI) include quality inspections for both the incoming goods and the periodic review at the DC and the RS.
Altogether, we consider eleven issuing policies in our simulation study. With the exception of SIRO, all considered policies depend on some kind of identification technology. In the case of FIFO/LIFO, the retailer must be able to identify items by a unique identification number, which is associated with the item’s arrival time at the DC. FEFO/LEFO depend on the existence of a database that stores the items’ expiry dates and links this information to a unique identification number. Both types of policies require that shipments are labelled with any kind of auto-id technology, such as RFID. In contrast, HQFO/LQFO make use of information gathered by sensor technology (e.g. ‘smart sensor’), which allows an item’s time-temperature history to be determined during storage and transportation, and to calculate a sufficiently precise estimate of its current product quality (Wang & Li, 2012). FIFO_TTI/LIFO_TTI and FEFO_TTI/LEFO_TTI provide a compromise of the aforementioned issuing policies. On the one hand, they combine the ability of product identification through an auto-id technology and the detection of spoiled goods based on product quality. On the other hand, they lack a temperature history, so that the actual issuing decision-making is according to either arrival time or product age as for the same policies without TTI.
Note that in our scenario neither SIRO nor FIFO/LIFO have means to evaluate the product age or product quality, which implies that spoiled products remain in the cold chain when they are expired.
Customer withdrawal behaviour
Customers follow different strategies in their product withdrawal behaviour. Ishii and Nose (1996) consider two types of customers (high and low priority) in their study, whereby high customers choose always the newest products in terms of remaining shelf life while low customers not only buy the newest but also old ones. In some cases, the quality of perishable goods may be judged easily by their visual appearance; in other cases, customers may only have the expiry date at their disposal. However, the latter information might be misleading when product quality decreases faster than if a product was stored under the right conditions (e.g. cooling system failure). To reflect this situation, we consider three different types of customer withdrawal behaviours: Random. This behaviour describes a customer who is unable or unwilling to judge an item’s product quality. Consequently, items are taken arbitrarily off the shelf, no matter whether their product quality is satisfactory or not. Expiry-based. This behaviour describes a customer who withdraws a product depending on its age as given by the expiry date (e.g., printed on the product packaging). In this case, the customer always chooses the ‘youngest’ item. Quality-based. This behaviour describes a customer who withdraws a product depending on its product quality (e.g., optical appearance). Hereby, the customer needs to be able to take the item’s product quality estimation into account and always chooses the item that shows the best quality.
Simulation study
Experimental design
For the base case of our simulation experiment, we consider a perishable product with a shelf life of 15 days (e.g. tomatoes). Once a product exceeds its shelf life, it is regarded as spoiled. The customer demand rate at the RS follows a truncated normal distribution with a mean of λ= 50 items and SD = 10. The order quantity of the DC is qD = 600 items per order, while the order quantity of the RS is qR = 150 items. Small to medium size grocery stores usually do not receive daily deliveries (M. M. E. Ferguson & Koenigsberg, 2007), so that we assume the store to receive an order quantity to supply customer demand for several days. In contrast to these given values, the reorder points rD and rR may be optimized freely. The lead time from the manufacturer to the DC (LMD) is uniformly distributed with lower bound = 1 and upper bound = 3 days, while the lead time from the DC to the RS is fixed with LDR = 1 day. The product age upon leaving the manufacturer is normally distributed with a mean of pa = 2 days and a standard deviation = 0.5, and the product quality is normally distributed with a mean of pq = 90% and a standard deviation = 1, which approximates a common initial product quality level (Rong, Akkerman, & Grunow, 2011). Product deterioration is determined by both the time spent on transportation (LMD and LDR) or in storage affecting pa and the quality deterioration rate affecting pq, which follows a normal distribution with a mean of 4% and a standard deviation of 1. The minimum quality level below which products are regarded as spoiled is 40%. The simulation horizon of T = 500 days splits up into an initial simulation warm-up period of 50 days to reduce the initialization bias, and a period of 450 days for the effective performance measures. Each parameter setting was simulated in an individual simulation run, which consisted of an adequate number of 30 independent replications for meaningful conclusions at the 95% confidence level.
In total, we compared 33 different combinations of (i) the eleven issuing policies and (ii) the three customer withdrawal behaviours. The two reorder points rD and rR were optimized under a service level constraint of at least 95%, which is in the range of observed service levels in practice (Broekmeulen & van Donselaar, 2009; Ketzenberg & Ferguson, 2008). Hereby, the RS service level β is defined as the fraction of served customers as compared to the total annual customer demand:
Optimizations were conducted with two different objective functions: (i) maximising product quality and (ii) minimising spoilage. The results of these optimizations are presented in the following Section.
We first consider the performance of the eleven issuing policies that can be achieved when we seek to maximize the average quality of sold products for the base case. In the following we refer to low-quality sales with a quality below 40%, average-quality sales with a quality of 40–69%, and high-quality sales with a quality of 70% and above. The quality category 90–100% does not appear as no sales were recorded for this category.
Figure 2 shows the results for the distribution of product quality categories for each combination of issuing policy and random customer withdrawal behaviour (scenario 1). It can be observed that SIRO and FIFO as well as LIFO and FEFO perform similarly and inferior to the other issuing policies. We also see that except for LEFO, all issuing policies not using quality monitoring solutions have a remarkably high share of low-quality sales, even though the spoilage threshold is set to 40% of product quality. This can be explained by the missing technological means to determine the product quality. In contrast, this does not apply to the other issuing policies, which is why they show no or only a comparatively small amount of low-quality sales. LQFO sets its focus on average quality sales, while FIFO_TTI and FEFO_TTI perform similarly but have a higher share of high-quality sales. Among all issuing policies, LIFO_TTI, LEFO_TTI, and HQFO perform best with HQFO outperforming the others.
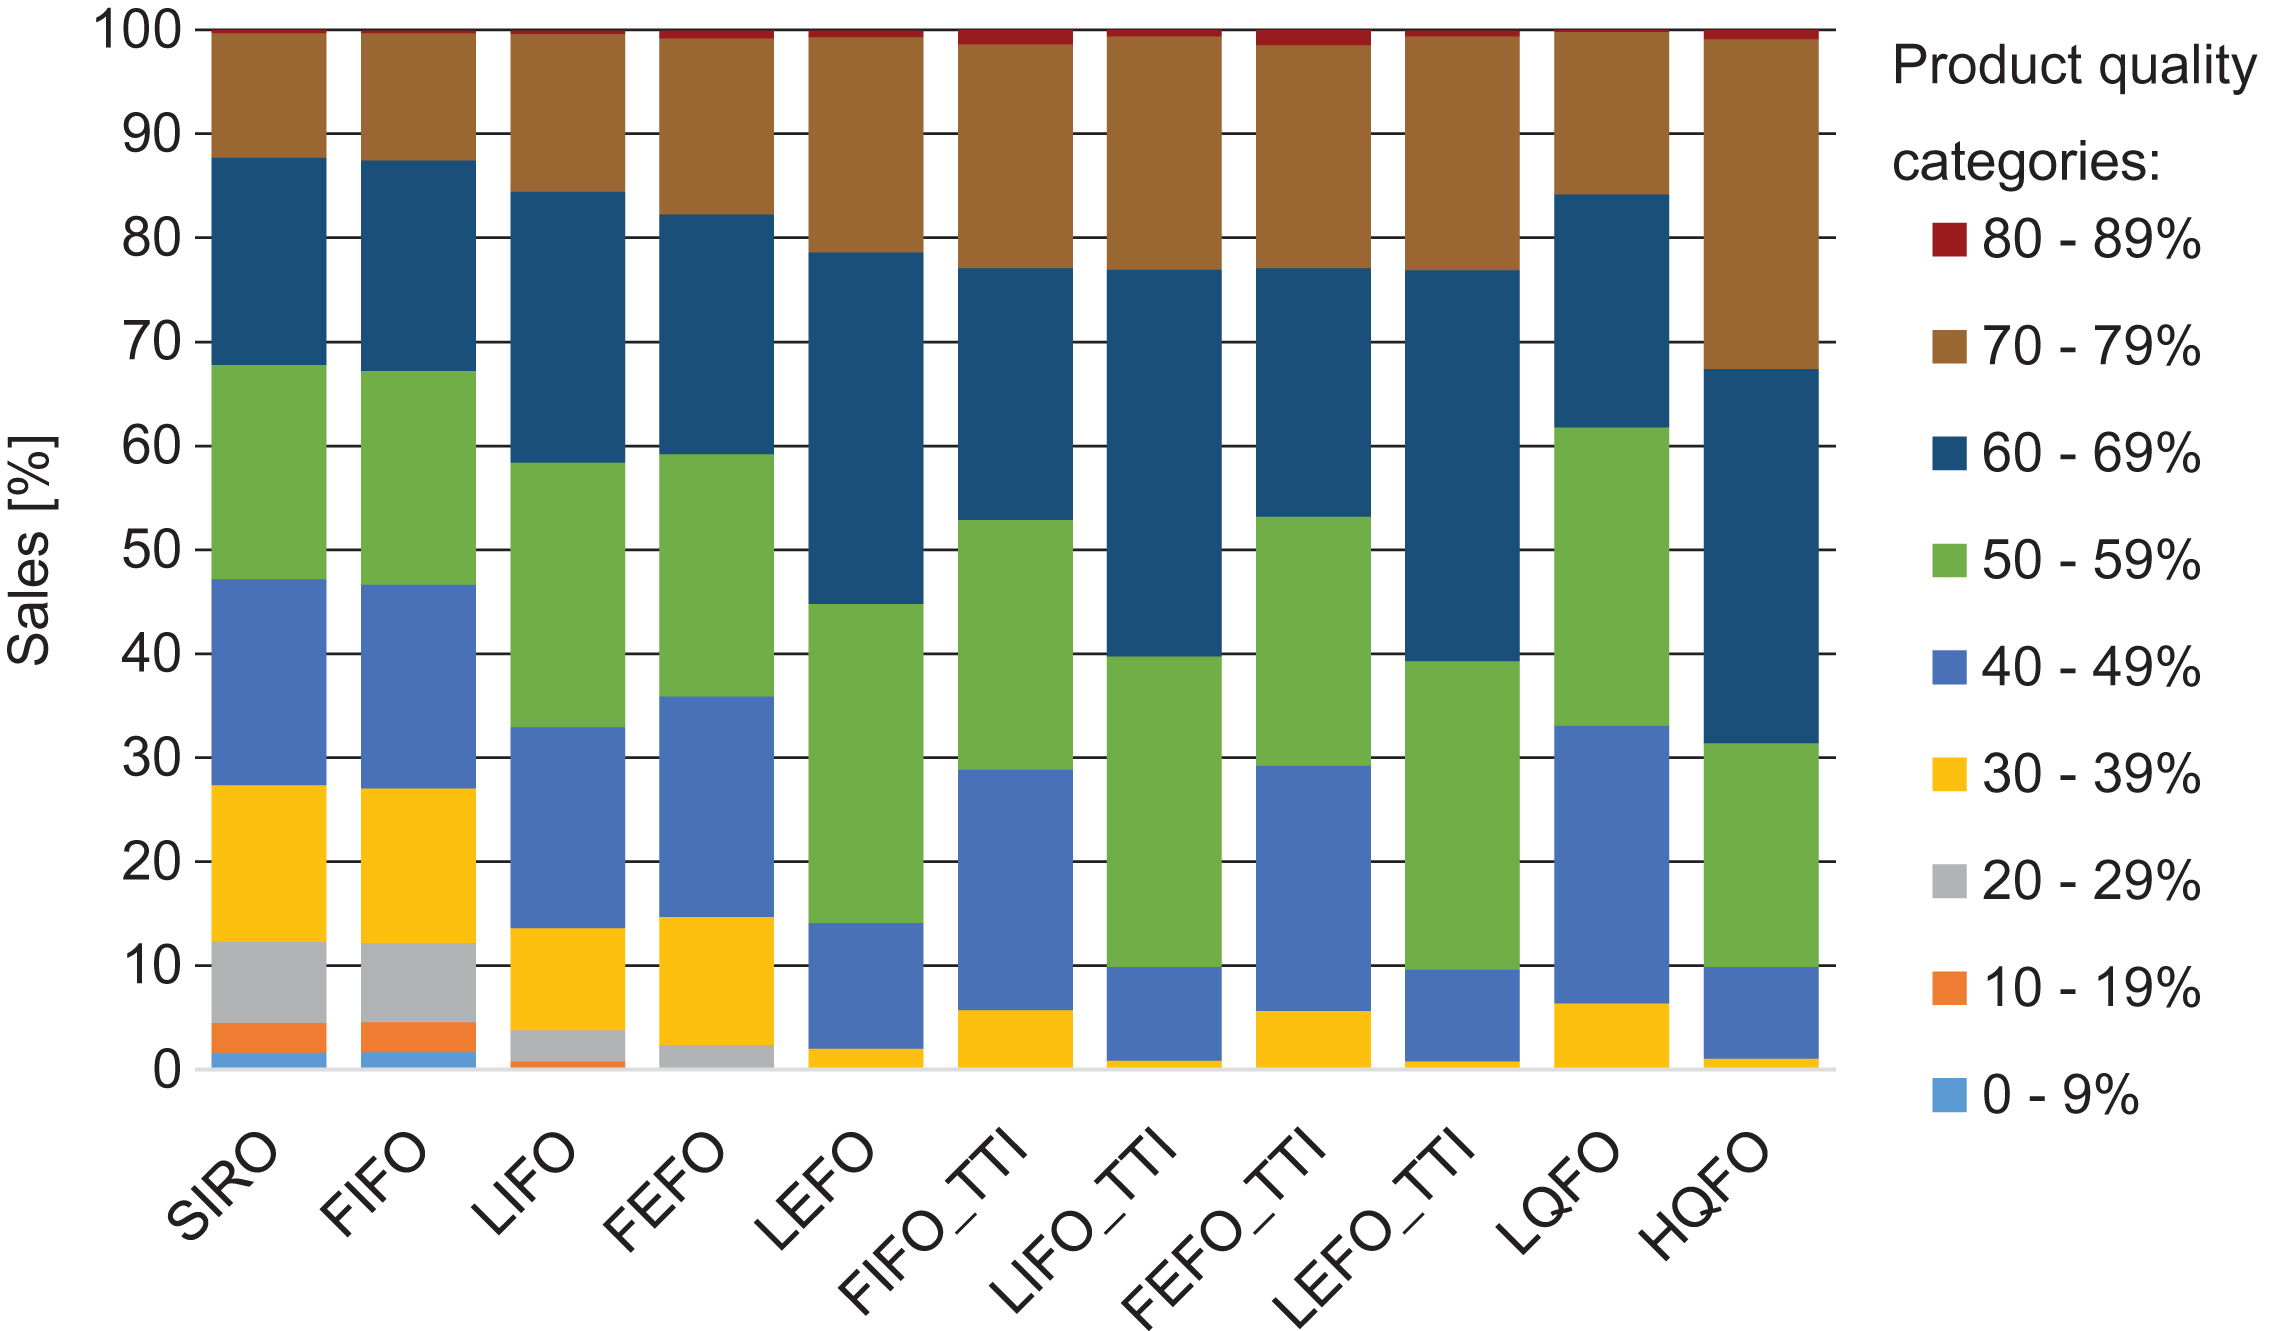
Distribution of product quality for random customer withdrawal behaviour.
Figure 3 shows the results of the distributions of product quality categories for a customer withdrawal behaviour based on expiry date (scenario 2). As can be seen, a shift towards higher quality sales becomes obvious across all issuing policies. Particularly for the policies SIRO, FIFO, LIFO, and FEFO, the low-quality sales decrease significantly as compared to scenario 1. Also, FIFO_TTI, FEFO_TTI, and LQFO show less low-quality sales to the benefit of average-quality sales. LEFO, LIFO_TTI, LEFO_TTI, and HQFO gain substantially in high-quality sales whilst low-quality sales disappear completely, making them again the policies performing best.

Distribution of product quality for customer withdrawal behaviour based on expiry date.
Figure 4 depicts the results for a customer withdrawal behaviour based on product quality (scenario 3). Again, a general shift towards higher quality sales becomes apparent, with increases across all policies in the highest quality category 80–89%. In particular, LEFO and the issuing policies using quality monitoring means show an increase in high-quality sales. Issuing policies that exhibited low-quality sales in scenario 2 could reduce them marginally. Finally, it should be pointed out that a ‘controlled’ customer withdrawal behaviour either by using an expiry date or product quality for decision-making signifies a remarkable improvement in terms of average product quality compared to a random withdrawal behaviour quality.
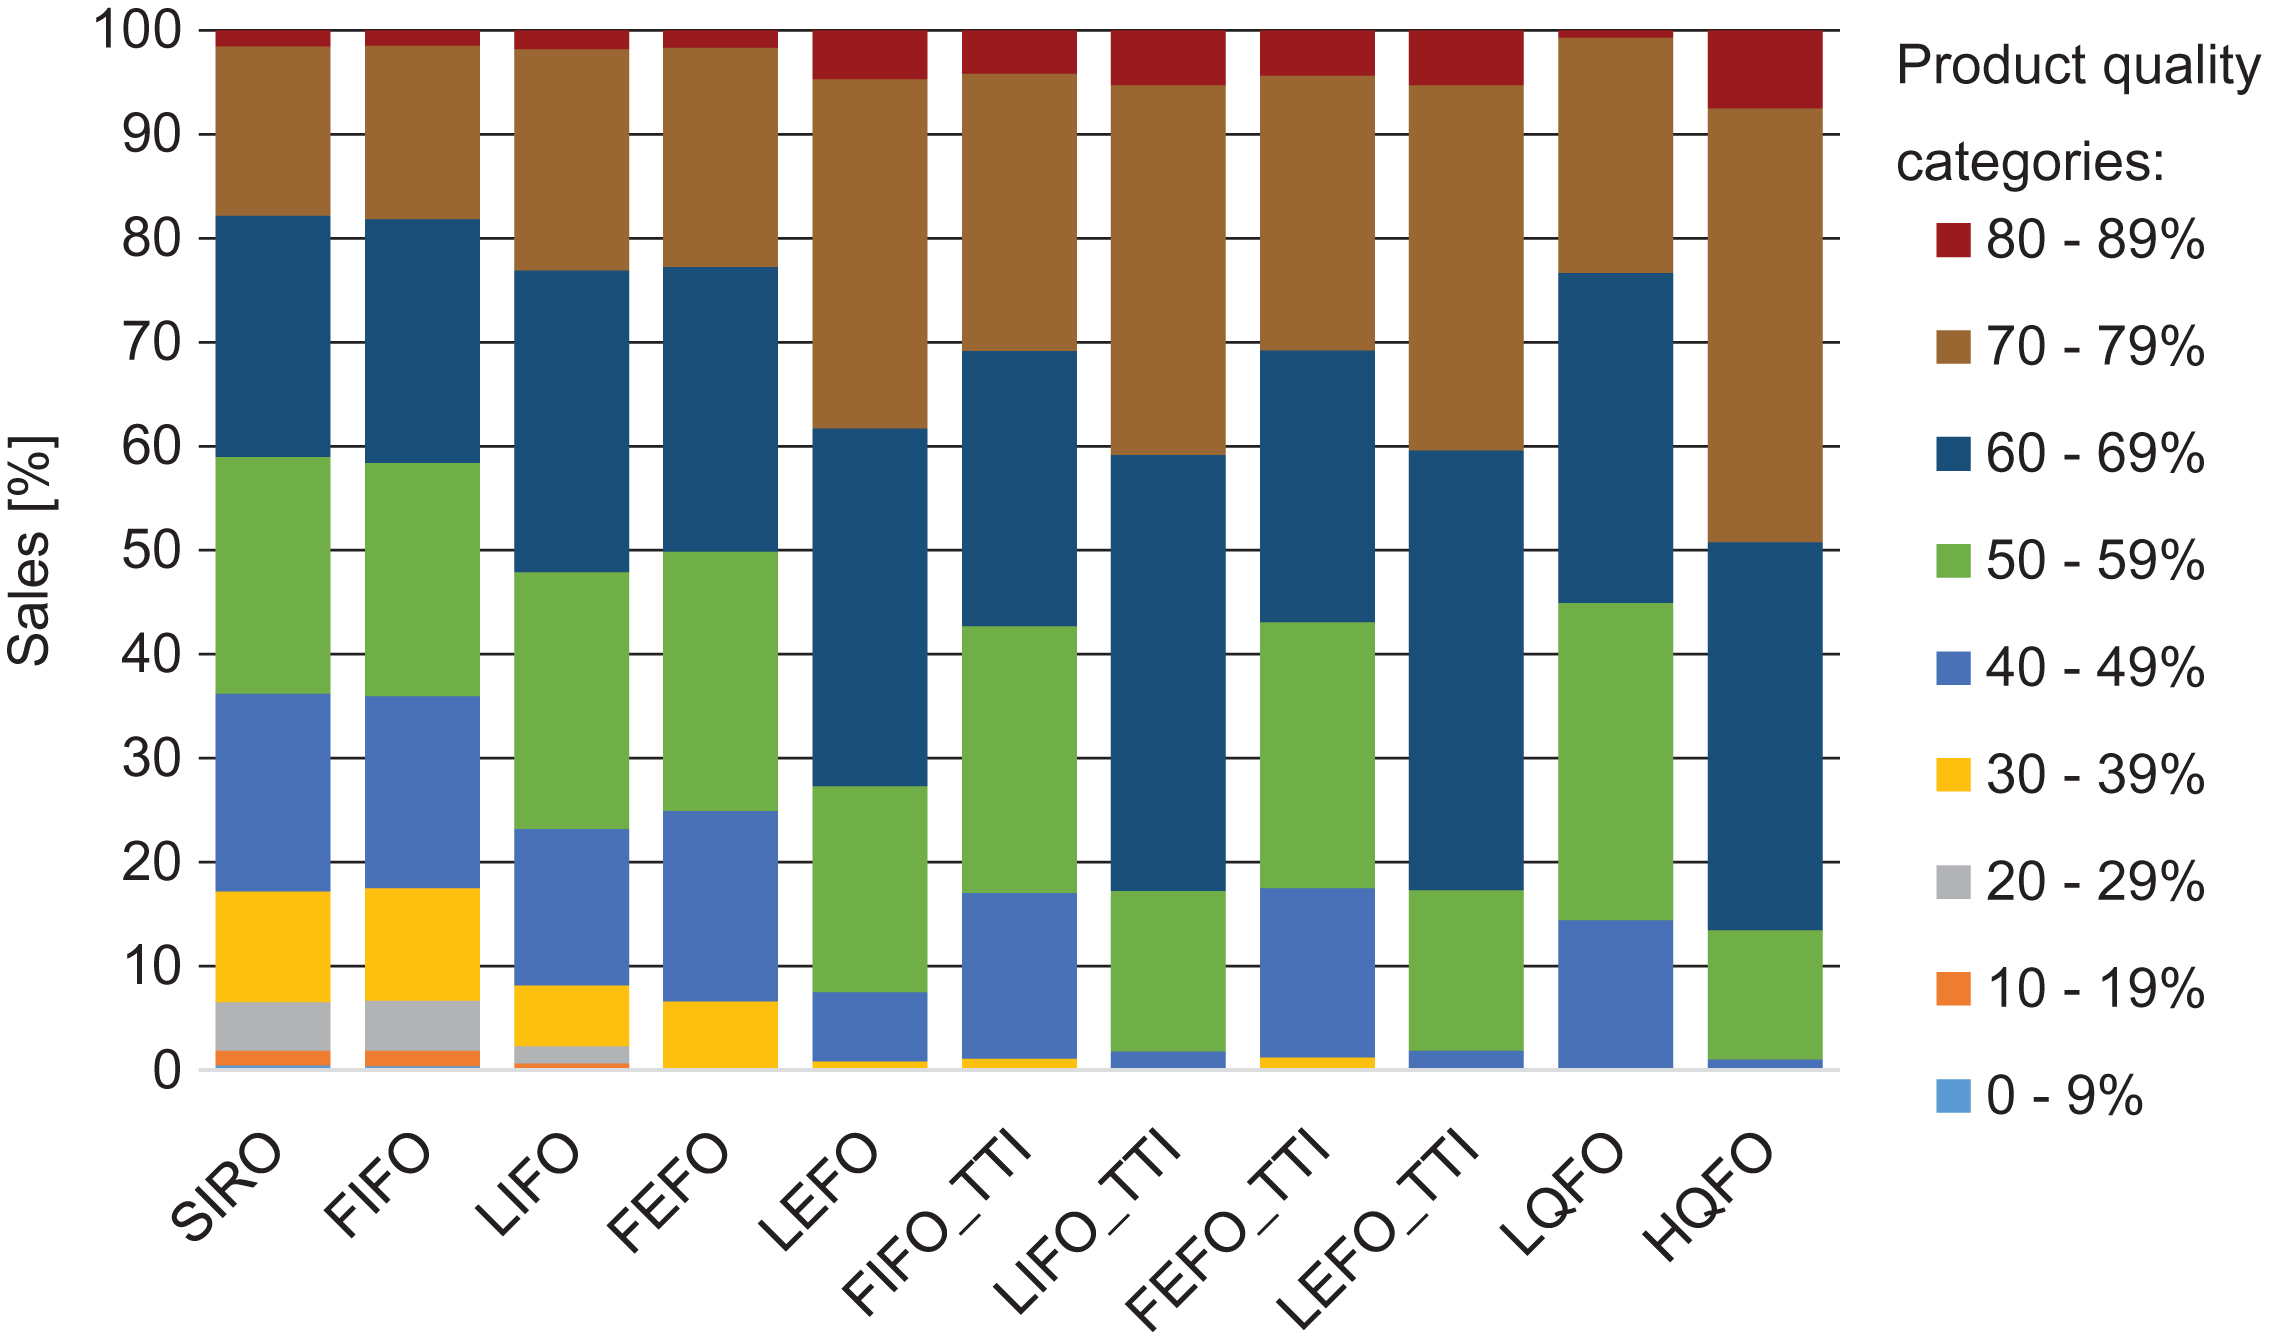
Distribution of product quality for customer withdrawal based on product quality.
Table 2 outlines the numerical simulation results for all combinations of customer withdrawal behaviour and issuing policy and for each objective function. We provide the mean values from 30 replications and the corresponding confidence intervals at 95% significance level in brackets. In addition to quality and spoilage information, we also include order and inventory level data for both, DC and RS. Spoilage information is missing for SIRO, FIFO, and LIFO as these issuing policies are conceptually not able to detect spoilage neither by product age nor by product quality.
Numerical simulation results for quality maximization
When optimizing for maximum product quality, the afore-mentioned improvements of product quality levels across the customer withdrawal behaviours become evident. With regard to product quality, LIFO_TTI, LEFO_TTI, and HQFO perform better than the other policies with HQFO showing the best performance. The results also indicate only marginal differences between FIFO_TTI/FEFO_TTI and LIFO_TTI/LEFO_TTI, respectively. The issuing policies without quality monitoring means show the lowest mean quality values except for LEFO. A further important insight can be derived from the spoilage values. LEFO, LIFO_TTI, LEFO_TTI, and HQFO show the worst performance as they prioritize either young or high-quality items, whereas old items or those with lower quality are sold late or spoil before they ever reach the customer. This phenomenon is also reflected by extensive reordering from the manufacturer and the DC as well as high inventory levels at the DC and the RS. In contrast, SIRO, FIFO, and LIFO show no spoilage at all, however, this is also the determining factor for the worst product quality. In summary, the result reveals that despite the use of quality monitoring means, a trade-off exists between superior product quality on the one hand and low spoilage on the other hand.
After analysing results for the optimization of product quality, we continue with the optimization of spoilage for all combinations of issuing policy and customer withdrawal behaviour. The spoilage on the part of the DC and RS that we consider for optimization purposes in our simulation is the total spoilage rate, which is given as:
The corresponding simulation output is reported in Table 3. The results indicate that, in terms of spoilage minimization, FEFO performs best followed by LQFO across all customer withdrawal behaviour. As a drawback, FEFO and LQFO have a lower product quality compared to the best-performing policy HQFO. In contrast, HQFO shows the best value for product quality, however, once more at the expense of the highest values for spoilage. In sum, LQFO appears to be the best compromise across all customer withdrawal behaviours. It shows the second best for spoilage in combination with reasonable product quality.
Numerical simulation results for spoilage minimization
To better understand the impacts of variations in the different input parameters, we conducted a sensitivity analysis. For this purpose, we varied the parameters shelf life, customer demand rate, and service level to observe their effects on product quality and spoilage (see Table 4). For reasons of simplicity, we solely focused on the expiry-based customer withdrawal behaviour.
Parameter variations
Parameter variations
Figure 5 sets the focus on the impact on product quality when the different parameters are varied. First, the shelf life is varied, according to which all policies show sensitivities (see Fig. 5a). In general, a lower/higher shelf life means a lower/higher average quality at the DC, respectively, because of the same initial product age and product quality at the manufacturer but the different quality deterioration rates. As a result, it can be concluded that issuing policies based on randomness (SIRO) and arrival time without quality monitoring means (FIFO/LIFO) are impacted the most when shelf life is varied. Second, the customer demand rate is varied leading to substantial impacts on SIRO, FIFO, and LIFO (see Fig. 5b). On the one hand, a decrease in demand leads to a loss in average product quality. In this case, the average time that an item spends in the supply chain increases, which causes a lower average quality of the sold goods. This has a strong effect on SIRO, FIFO, and LIFO, as these never filter spoiled products before they reach the customer. On the other hand, if demand increases, the average product quality increases up to 11%. Again, the root cause for this phenomenon is the lack of product quality inspection under the three policies, that is, any single item is shipped to the RS and sold to a customer regardless of its product quality. With the exception of the FIFO policy, we could not identify any impacts of a service level variation since the solutions already had service levels of 97% or higher when we optimized for product quality.
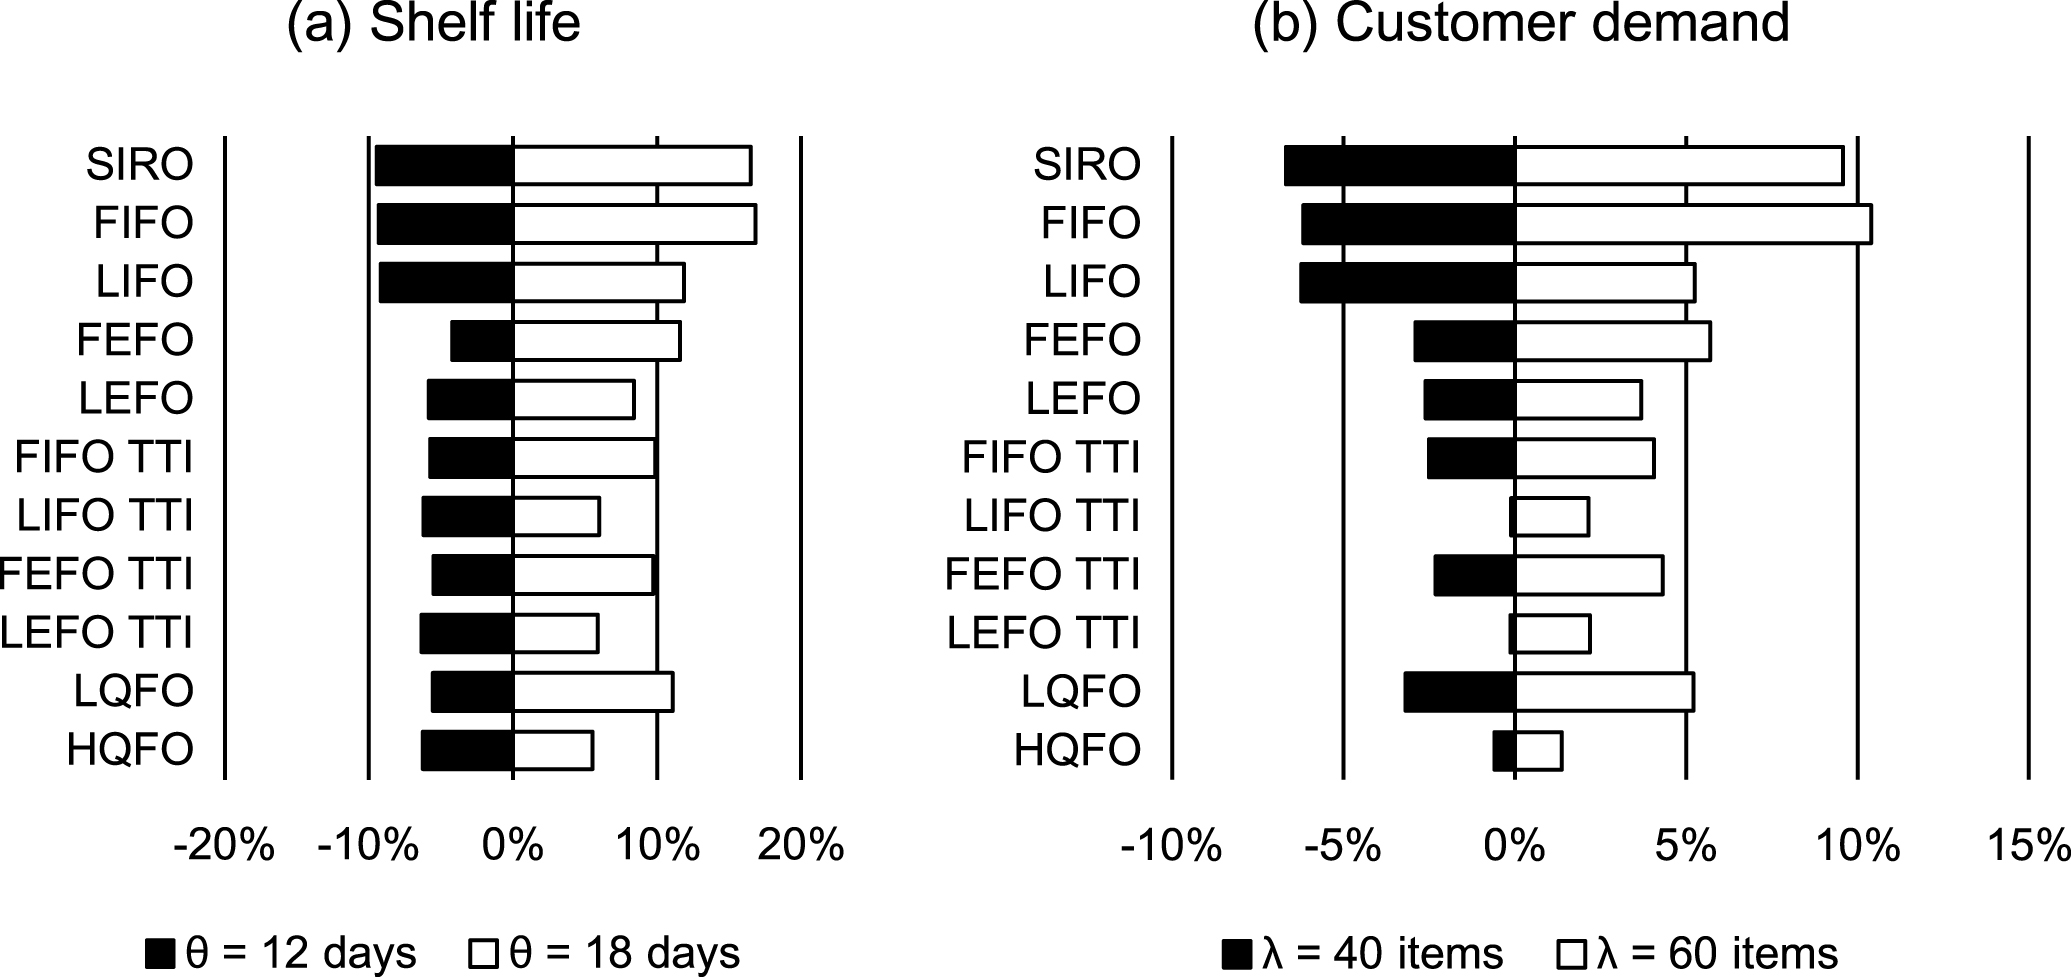
Impacts of parameter variations on product quality.
Figure 6 sets the focus on the impact on spoilage when the different parameters are varied. First, we observe that a longer shelf life leads to a significant reduction in spoilage for all issuing policies resulting in very low spoilage (see Fig. 6a). The reason is that products can stay longer in inventory before they are disposed of based on product age, whereas the other policies consider product quality for goods inspection. In contrast, a shorter shelf life has an overall high impact on all issuing policies with an increase of at least 100% except for HQFO. Second, in case of decreasing customer demand rate, all issuing policies suffer of higher spoilage compared to the base case (see Fig. 6b). An increase of customer demand rate causes an evenly decrease in spoilage of more than 50% for all issuing policies. Third, a lower service level has only a significant impact on LEFO, FIFO_TTI, LIFO_TTI, and LEFO_TTI with a decrease in spoilage of up to 7% (see Fig. 6c). The reason for this effect is that less inventory is needed in the supply chain to uphold the desired service level. Consequently, the average time products spend in the supply chain decreases before they are sold. In contrast, a higher service level affects those issuing policies using TTI labels and HQFO with an increase in spoilage of up to 8%. These issuing policies are sensitive to an increased number of products in the supply chain caused by a higher service level. Since the customer demand rate remains constant, a higher proportion of spoiled items occur.

Impacts of parameter variations on spoilage.
We studied the performance of eleven different issuing policies at the distribution centre based on either the issuing criterion ‘arrival date,’ ‘product age,’ or ‘product quality’ in a perishables supply chain. Our primary aim was to analyse under which conditions sensor-based issuing policies perform best and how their characteristics differ from other conventional policies with or without TTI technology. For this purpose, we conducted a computer-based simulation study. Our results indicate that LQFO and HQFO enable a retailer to pursue certain goals, however, the results also show that a sensor-based policy does not pose a silver bullet since a number of trade-offs regarding further performance metrics must be taken into account. Nevertheless, LQFO demonstrates to be a reasonable compromise among all issuing policies as it shows good performance for spoilage together with acceptable product quality levels. In sum, information gathered from sensors poses a powerful means to improve the economic performance throughout the perishables supply chain. At the same time, we conclude that sensor-based policies should rather be regarded as complements to existing issuing policies than as substitutes. They enlarge the retailer’s scope of action in a distribution centre if the objective is to increase the quality of products offered to the customer.
From a retailer’s perspective, the results support companies in selecting specific issuing strategies. Different retailers might have different priorities depending on their customer base. For example, a premium-quality retailer could employ HQFO for the purpose of a high average product quality, which comes at the expense of a high number of spoiled items. In fact, when the retailer’s focus is set on low spoilage, FEFO and LQFO are the best-performing issuing policies, while still providing a decent product quality level. Naturally, the well-known benefits of smart sensors must be balanced against the costs of a sensor infrastructure deployment, which might be a principal decision criterion whether or not to introduce sensor-based issuing policies.
From a research perspective, our study extends the number of issuing policies provided in the literature as a consequence of considering TTI technology. This is important as TTIs are widely used in food logistics for shelf life estimation and provide an alternative to the more advanced smart sensors. A striking observation we find across the experimental results is the good performance of the TTI-based relative to the sensor-based issuing policies. Unlike our initial assumption, the actual product quality estimation by smart sensors seems not to be a key advantage over the static shelf life information provided by an expiry date. Certainly, one reason might be our general assumptions regarding degradation rates that may differ from reality as each perishable good has its specific quality degradation (Zanoni & Zavanella, 2012). Nonetheless, for the vast majority of experiments, the general tendency of quality-based issuing policies being superior to the other issuing policies is significant.
Limitations of our study and opportunities for future research should not go unmentioned. The consideration of only a single product leaves a static view since a retailer usually deals with a number of perishable goods for which the issuing policies might perform differently. The omission of cost factors prevent the consideration of total costs which might better reflect the differences between the issuing policies from an economic perspective. Since we considered the customers’ product withdrawal behaviour as the only environmental condition in the retail store, other researchers may consider additional factors, such as the influence of product types with different shelf lives. Finally, we are convinced that empirical research will be necessary to better understand the reasons for the low diffusion rate of wireless sensors in practice. These empirical results could then be used to further refine models of the cold chain as the one presented in this study.