
Abstract
This paper describes a new methodology and an experimental setup to localize UHF RFID (Ultra-High Frequency Radio Frequency IDentification) tags with a linear antenna array connected to a RFID reader. The operation is effective in the array Near-Field (NF), i.e., for short range localization where both the distance and azimuth can be estimated. An estimation method much less complex and as performing as the two dimensional Multiple Signal Classification (2D-MUSIC) method and High-Order Propagator Method (HOP) is described. The proposed method is based on second order statistics and it has a good accuracy and low complexity without Eigen value decomposition (EVD) of the covariance matrix. We claim that it achieves good accuracy and low complexity. An array calibration technique is applied to take into account the phase variation of the received signal at each array element. The effectiveness of our method is proved analytically and experimentally for a 3-element array and 4-element array.
Introduction
UHF RFID effectiveness has been widely demonstrated in the supply chain management and the real-time inventory. In addition to its identification, the accurate localisation of a RFID tag is crucial to avoid logistics errors. A typical use case is retailing where hundreds of tagged items are spread over racks or stacked in cardboard boxes. Hand-held readers are often used but a general trend is to fully automate the localization process (Loussert 2014). Most Direction-of-Arrival (DOA) estimation techniques in RFID systems consider that the tag is located in the far-field of the reader antenna where the electromagnetic wave is regarded as a plane wave (Scherhaufl et al., 2015; Athalye et al., 2013). But when accuracy is needed, large arrays are required which moves away the far-field region. For a 8-element array and a λ/2 inter-element distance yielding a total array length ≈4λ, the far-field distance begins at 2L2/λ≈10 meters at 867 MHz (European RFID band). This means than numerous tags are located inside the array NF for the use-cases described above. Therefore, short-range localization techniques require a different formulation to cope with the spherical nature of the waves in NF.
To estimate sources in the near field, it is preferable to use the two-dimensional version of the music method as it is referenced in (Huang amp; Barkat, 1991), this method is based on the decomposition of the covariance matrix in two subspaces signal and noise, this decomposition requires a complex calculation which makes the method more complex. In (Zuo, Xin, Zheng, Akira, 2018) the author has developed a method LOFNS based on second-order statistics without EVD (Eigen value decomposition), this method has low computational complexity and good accuracy. Both of methods are based on second-order statistics.
Several methods based on higher-order statistics are developed, among them esprit-like method in (Challa & Shamsunder, 1995) which is based on the calculation of several matrixes of fourth-order cumulants to estimate the Doas and ranges of sources located in near field of an uniform linear array. In (Liang & Liu, 2010) the proposed high-order MUSIC method is used to estimate the Doas and ranges parameters for the mixed near field and far field sources, this method based on the construction of two cumulant matrixes and shows a high complexity. in (Wang, Zhao, Liu, 2013) mixed-order statistics MUSIC (MOS) is used to estimate the Doas and ranges parameters for the mixed of near and far field sources, this method based on the construction of a cumulant matrix and a covariance matrix shows a lower complexity than high-order MUSIC method and requires a large array to achieve good accuracy. All these methods are based on the construction of the matrix of fourth order cumulants and EVD or SVD (Singular value decomposition) which makes them more complex to implement in real system.
In (Li et al., 2017) a Simplified High-Order DOA and Range Estimation (SHO) is developed using a single cumulative matrix and a single EVD decomposition, this method has a better accuracy and less complexity compared to MOS. author in (Jianzhong Li et al., 2019) proposed a High-Order Propagator (HOP) method based on the construction of the cumulant matrix without applying EVD decomposition, this method has a better accuracy compared to LOFNS and has the SHO accuracy for higher SNR and low computational complexity compared to SHO.
In this paper we propose a method based on second-order statistics by the construction of the covariance matrix and without the application of EVD decomposition, the proposed method named two dimensional low complexity subspace projector (2D-LCSP) has a better accuracy compared to HOP and 2D-MUSIC and low computational complexity. Therefore, 2D- LCSP method is a way to reduce these intensive computationally without affecting the accuracy of the estimation of both DOA and range, in order to simplify the implementation on programmable circuits of a commercial RFID system. 2D- LCSP method was proved by using an experimentation and simulation validations.
After the above introduction, the rest of the paper is organized as follows. The next section is dealing with signal modeling; section 3 describes the related methods, the proposed estimation scheme is described in section 4. Section 5 and section 6 describes an array calibration and complexity analysis, Simulation and experimental results are provided in section 7 and 8 respectively. Section 9 reports concluding remarks.
Signal model
When a tag is located in the NF region of a reader antenna, the wave front of its backscattered signal must be considered spherical, i.e., the plane wave approximation valid in the far-field is not suitable. For a plane wave, the signal arrives at each element of the antenna array with the same angle and the same amplitude. The phase shift resulting from the path difference between the elements has no influence on the estimated DOA because a linear wave front is assumed. Conversely, in a NF scenario, each element receives the same signal with a different angle. The localization problem in NF can be represented geometrically as shown in Fig. 1 where the distance
Where

Geometry of the localisation setup.
With M = 2p or M = 2p + 1 number of array elements, i ∈ [- p, p], where r
j
and θ
j
are the distance and the angle between the jth tag and the array center, respectively. At the ith array element, the backscattered signal
Assuming that only the jth tag responds in the time slot, s
j
(t) is the complex signal generated by the jth tag, α
i
is the complex gain of the ith array element, n
i
(t) is an additive white Gaussian noise (AWGN) with σ2 variance and zero mean. The M received signals
Several high-resolution DOA and range estimation techniques such as 2D-MUSIC (Huang & Barkat, 1991) or least square Estimation via Rotational Invariance Technique (ESPRITlike) (Challa et al., 1995) can be used for the NF localization of sources. Once the data acquisition process is complete, 2D-MUSIC is based on the eigen-value decomposition of the covariance matrix R
X
defined as:
Where ()
H
denotes the Hermitian operator.
Under the condition that d ⩽λ/2, 2D-MUSIC is a spectral technique based on the orthogonality between the noise and signal subspaces, therefore, if (θ, r) are the Doa and range of one of k signals, so A (θ, r) is orthogonal to the noise subspace V e .
The estimated DOAs and ranges are associated with the calculated two dimensional spectrum peaks of
On the other hand, least square ESPRITlike is a method of estimating the azimuth and the range of near field sources, this method based on the exploitation of the three displaced sub arrays by distance d = λ/4, the fourth-order cumulant matrix are used to build the matrix of cumulants C, the eigenvectors of C are E
s
= [e1e2 … e
k
] = [E
X
E
Y
E
z
]
T
, where E
x
, E
y
and E
z
are signal subspaces. The eigenvalues of
A high-order propagator-based method (HOP) can achieve the sequential estimation of the DOA and range of near-field sources with only one matrix and without the application of EVD, HOP can be summarized as follows:
Where a2 (θ j , r j ) = [ej[(-p)ω j +(-p)2φ j ], …, ej[(p)ω j +(p)2φ j ]] T .
We apply step 5 until all ranges are estimated.
In this paper we propose a method with low complex projector to noise subspace based on a maximization function allowing not only the DOA estimation but also the range estimation. The estimated covariance matrix of the received signals is given by:
Where A1 is the first k rows and A2 is the last (M-k) rows. Under the basic assumptions i.e
A1 is nonsingular (its determinant is non zero and therefore its rank is k) and k < M, where
k is the sources number, we can find that there exist a linear projector between
A1 and A2 (Sanchez-Araujo et al., 1996):
Dividing X (t) into X (t) = [X1 (t) X2 (t)]
T
where X1 (t) and X2 (t) are the first k rows and the last M-k rows of X (t) respectively, the covariance matrix is given by:
In the case of higher SNR (signal to noise ratio), we obtain:
Combining (17), (18), it is straightforward that:
Using (19), we obtain a new orthogonal projector in the noise subspace without eigenvalue decomposition of the covariance matrix:
When a single tag is activated, (15) and (16) become:
Using (21), in (22), we introduce a new projector F into the noise subspace:
The 2D estimation of range and DOA can finally be extracted by maximizing the following function:
When applying the spectral search on C (r j , θ j ) and if (r j , θ j ) is DOA and range estimations of tag j, only if A (r j , θ j ) is orthogonal to F, therefore, the denominator is minimum because F is orthogonal projector into noise subspace and the objective function is maximum, like most subspace-based estimation methods which use the spectral search.
Unlike the proposed method, the 2D-MUSIC algorithm requires the eigen-value decomposition of the covariance matrix which in turn requires a large number of multiplications and additions, i.e., a major computation load. 2D-MUSIC computational complexity is described in Table 1 where N s is the number of samples, P θ is the number of grid points for θ ∈ [-90 (°) , 90 (°)] and P r is the number of grid points for a range ∈ [0 (m) , 1.5 (m)]. The computational complexity for the proposed method 2D-LCSP is given in Table 2 and the computational complexity for a HOP method is described in Table 3. A comparison between Tables demonstrates the lower computational complexity and the easier implementation of 2D-LCSP method compared to the 2D-MUSIC algorithm and HOP method.
Computational complexity of MUSIC algorithm
Computational complexity of MUSIC algorithm
Computational complexity of the proposed method
Computational complexity of HOP method
We apply the array calibration method proposed by N. Fistas and A. Manikas (Fistas et al., 1994) for each angle change. Using (4), A (r
pil
, θ
pil
) is the steering vector of the pilot tag. It can be modeled as:
Let
Where
Note that diag(matrix) denotes a column vector and diag(vector) denotes a diagonal matrix. By pre- and post-processing
Where
Taking the first element U (1, 1) as a reference with known gain γ1, the matrix U becomes:
Where the vector
Using (31) and (32) to calculate An array calibration is applied using a single pilot tag for each angle change with range of 1m. Nominal values are fixed for the gain The noiseless covariance matrix is calculated using (26) and (27), then (29) to calculate the matrix Θ. Using (31) and (32) to calculate U, then Finally, the complex gain is removed from the data noiseless covariance matrix.
In this section, the DOA-range estimation schemes are compared using a 5-element array of identical isotropic antennas with unit gain spaced by λ/4 at 867(MHz). Figure 2 shows the range estimation when the complex gain calibration described in section 6 is applied to each angle dependent phase shift. In the near field, the signal arrives at each antenna with a different angle whereas the presence of multipath may cause phase shifts at the receiving antennas. Figure 2 shows that additional phase shifts in the signal model can add errors in the range estimation compared to real range.
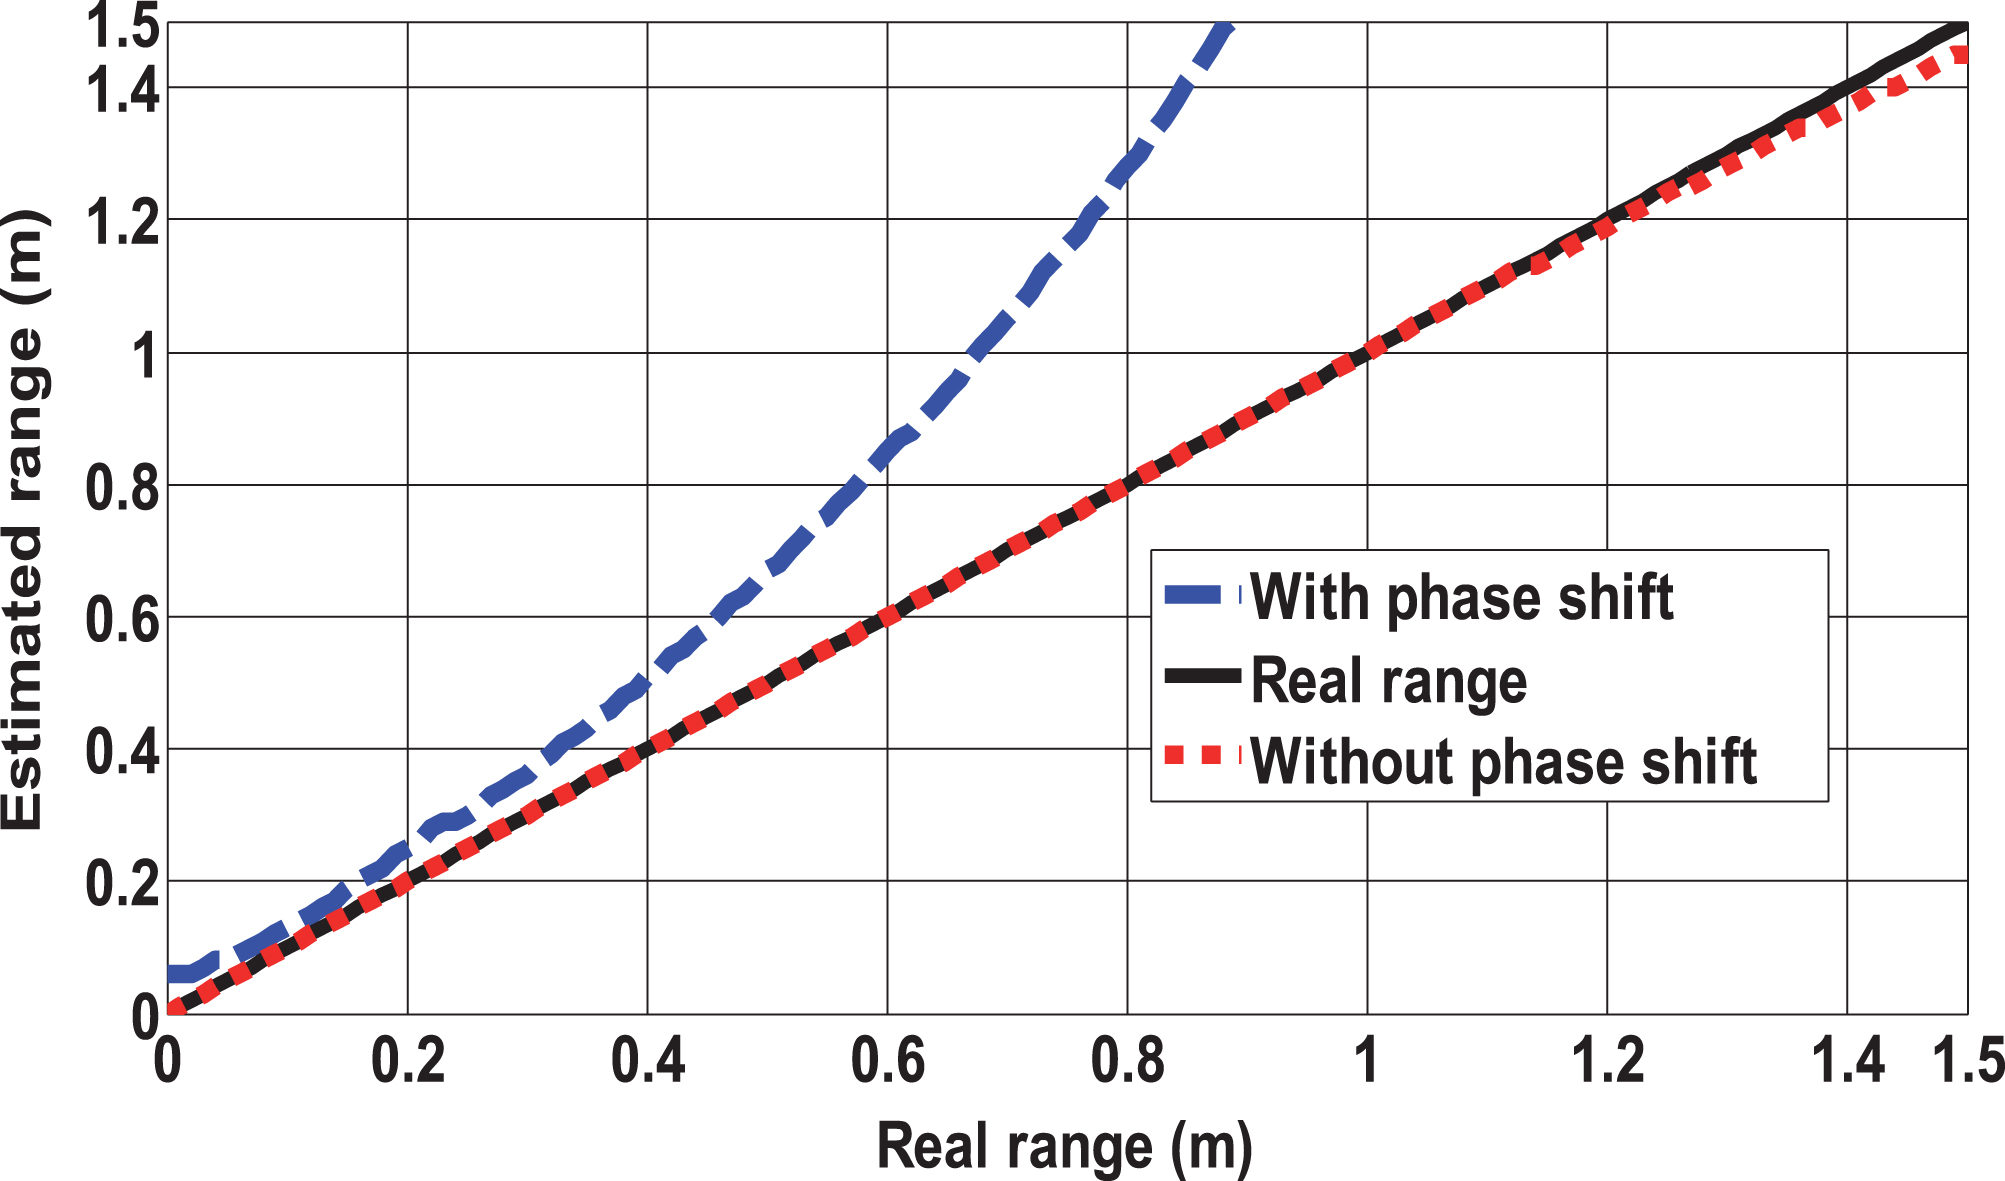
Simulation results: Phase shift influence on the estimated range at angle 10(°) for SNR = 22(dB).
The root mean square error (RMSE) is defined as:
Where β j either represents the DOA θ j or the range r j of the jth activated tag. Figures 3 and 4 show respectively the root-mean-square error (RMSE) variations for the estimation of the DOA and range with SNR varying from 0 (dB) to 30 (dB) when M c = 200 Monte-Carlo runs are performed. The number of samples used to calculate the RMSE is N s = 329. The proposed method achieves the accuracy of 2D-MUSIC method if we have an SNR greater than 10db which is valid for the real rfid system (Nikitin & Rao, 2008) and better than HOP method with a lower computational complexity.
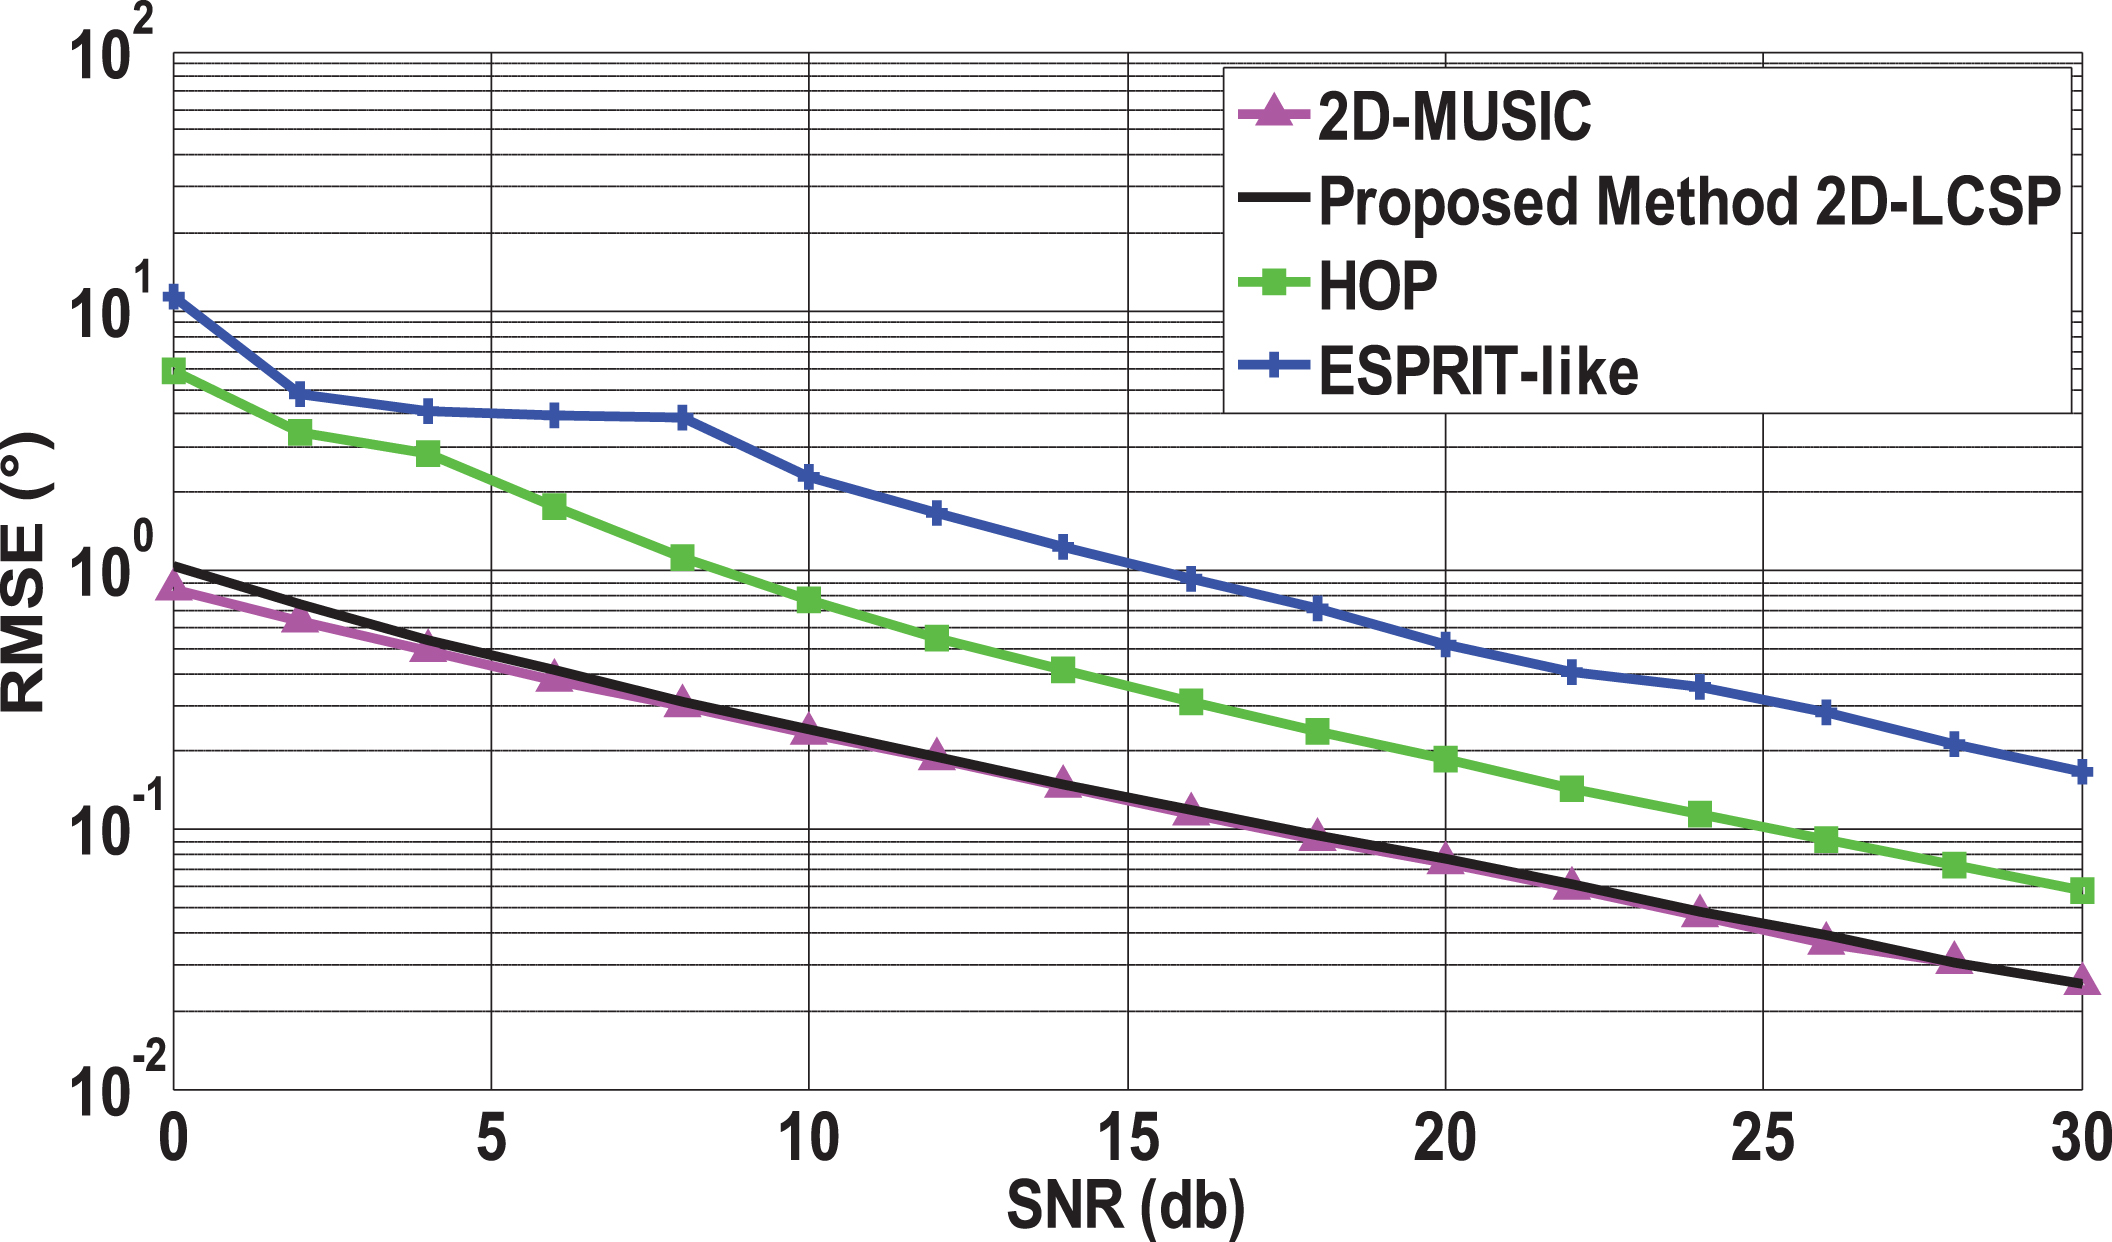
RMSE of the estimated DOA versus SNR (r j , θ j ) = (0.6(m),10(°)).
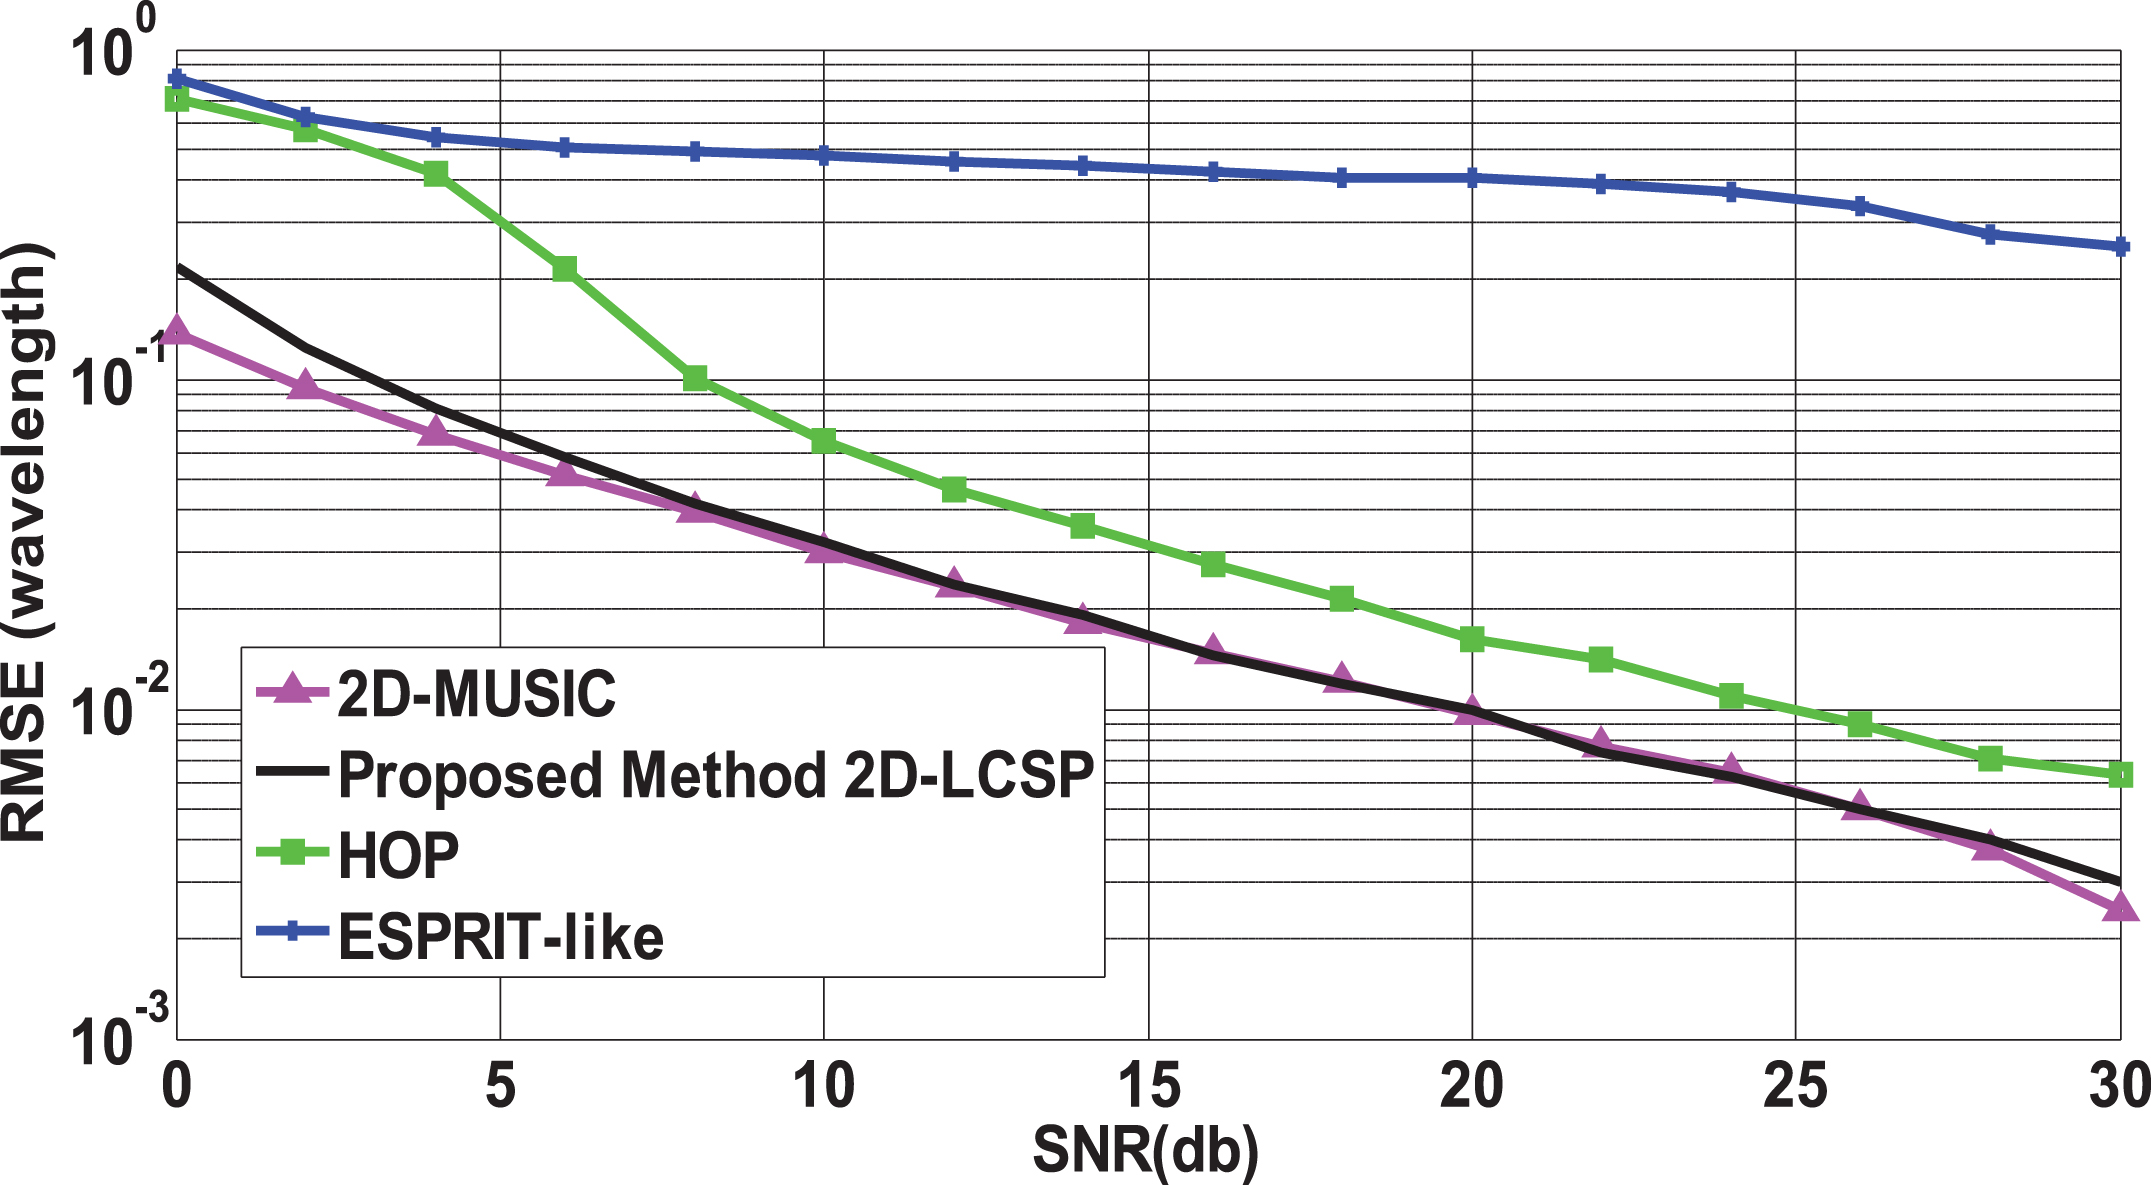
RMSE of the estimated range versus SNR. (r j , θ j ) = (0.6(m), 10(°)).
The RFID setup based on a bistatic configuration (Fig. 5) is placed in a Lab environment (no absorbers). An arbitrary waveform generator emulating the EPC Gen2 RFID protocol is connected to a linearly-polarized transmitting patch antenna. The transmit antenna energizes the RFID tag with a 22(dBm) conducted power at 867 (MHz). A commercial tag placed in the NF region is activated and returns its RN16 once the Query command is sent. The backscattered signal is received by a uniform linear array of four circularly polarized patches (individual gain = 1.5 (dBic)) fixed on a wooden stick and separated by λ/2 from center-to-center. For this configuration, the NF region of a 4-element array extends to 1.5 meters. Each of the four receiving patch antennas is connected to the input of a 4-channel oscilloscope (500MHz-2GS/s). The four received RN16 signals are stored and used for a subsequent treatment. The offsets brought by the cables are taken into account for each channel. In the measurements, the azimuth angle of the tag relative to the array center is increased from –40(°) to 40(°) and its distance from 0.6(m) to 1.2(m) for each angle.
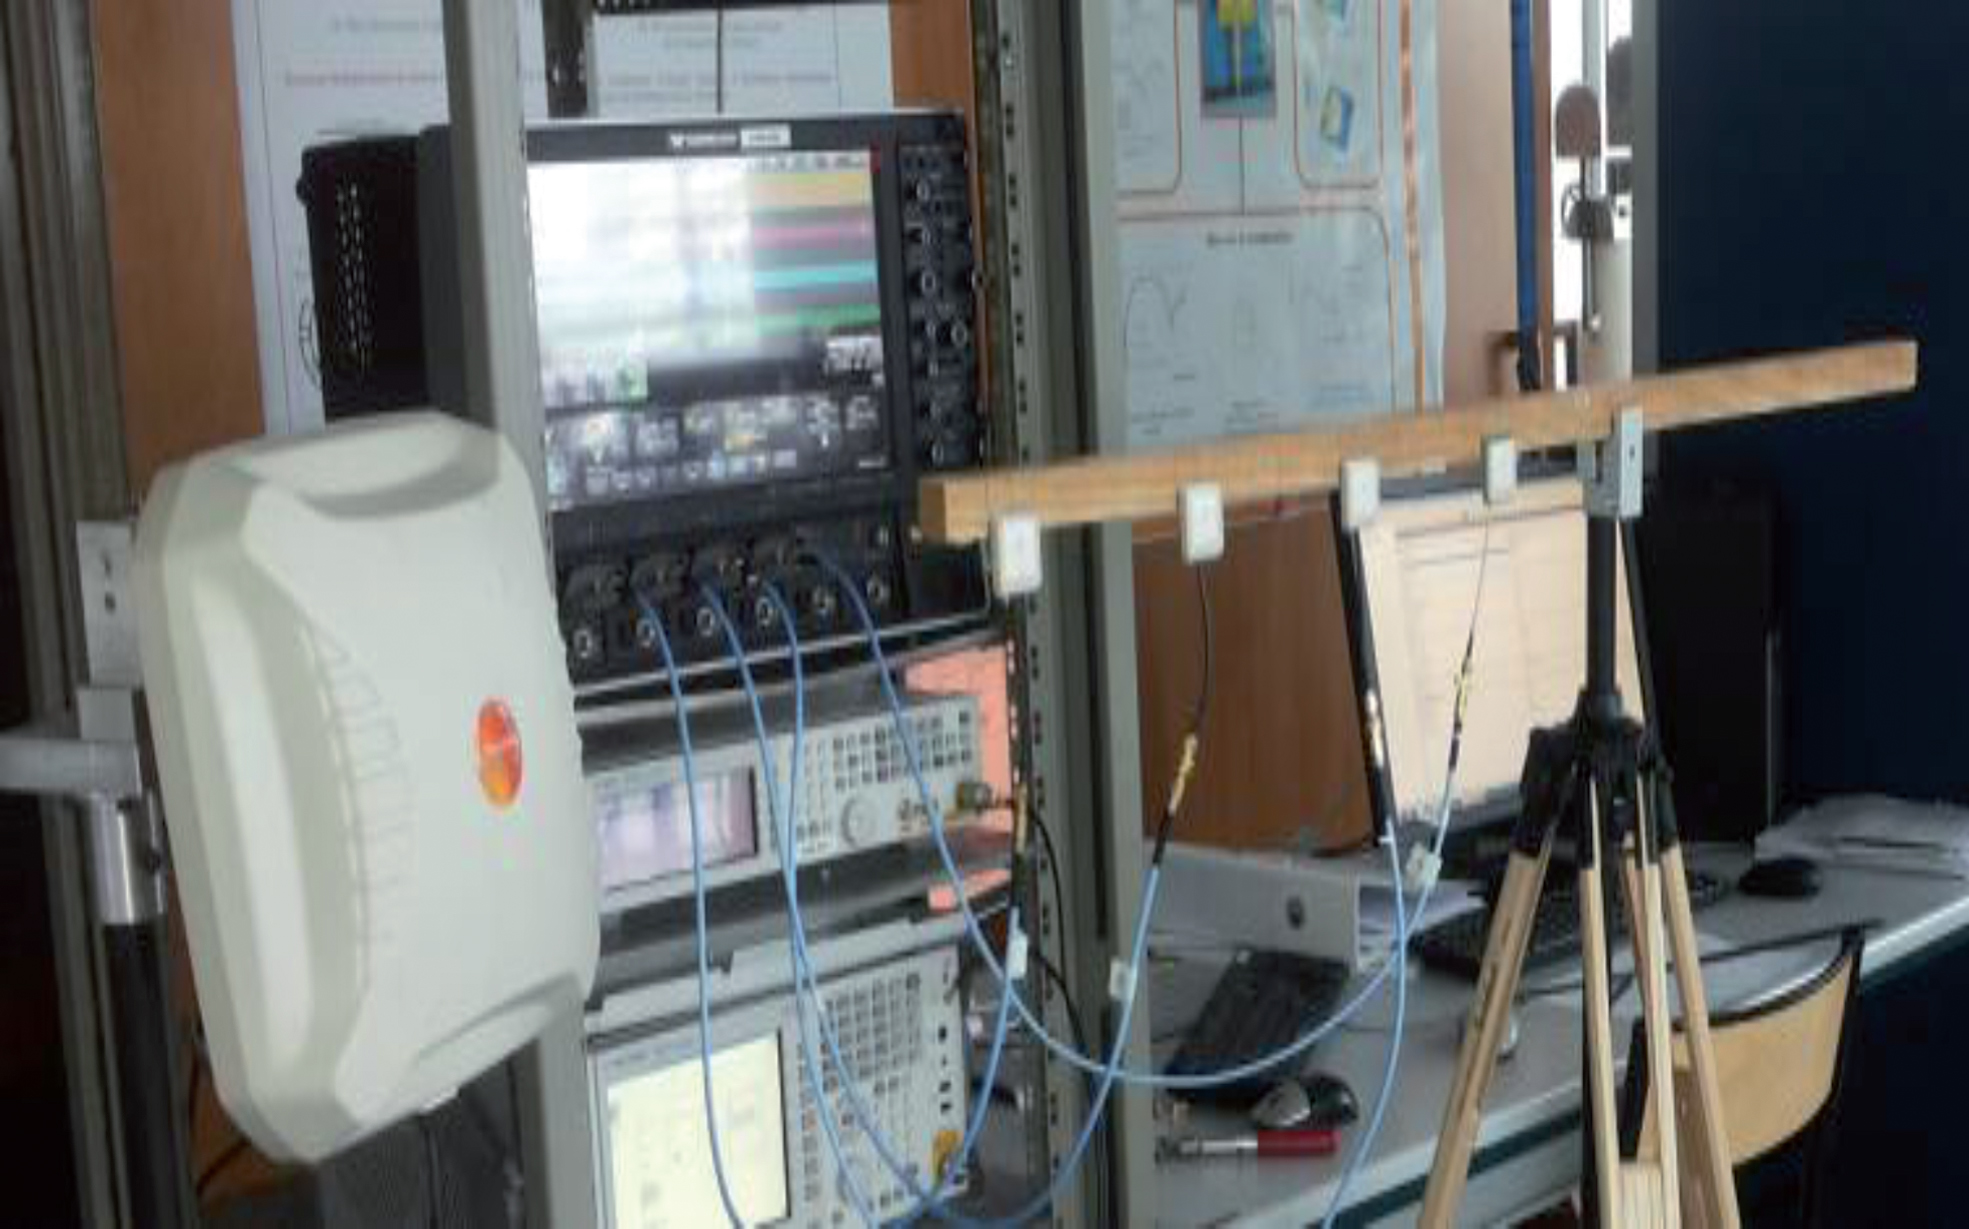
Experimental setup.

Illustration figure of experimental setup.
The setup is highly sensitive to changes in the NF multipath environment as the backscattered signal at each antenna arrives with a different incident angle, i.e., a different phase shift. To fight this effect, the array calibration based on one pilot source discussed in section 6 is first applied with a complex gain associated to every incident angle at a distance of one meter. In Fig. 7, the range estimation is compared with and without array calibration. The improvement brought by the calibration procedure is clearly emphasized.
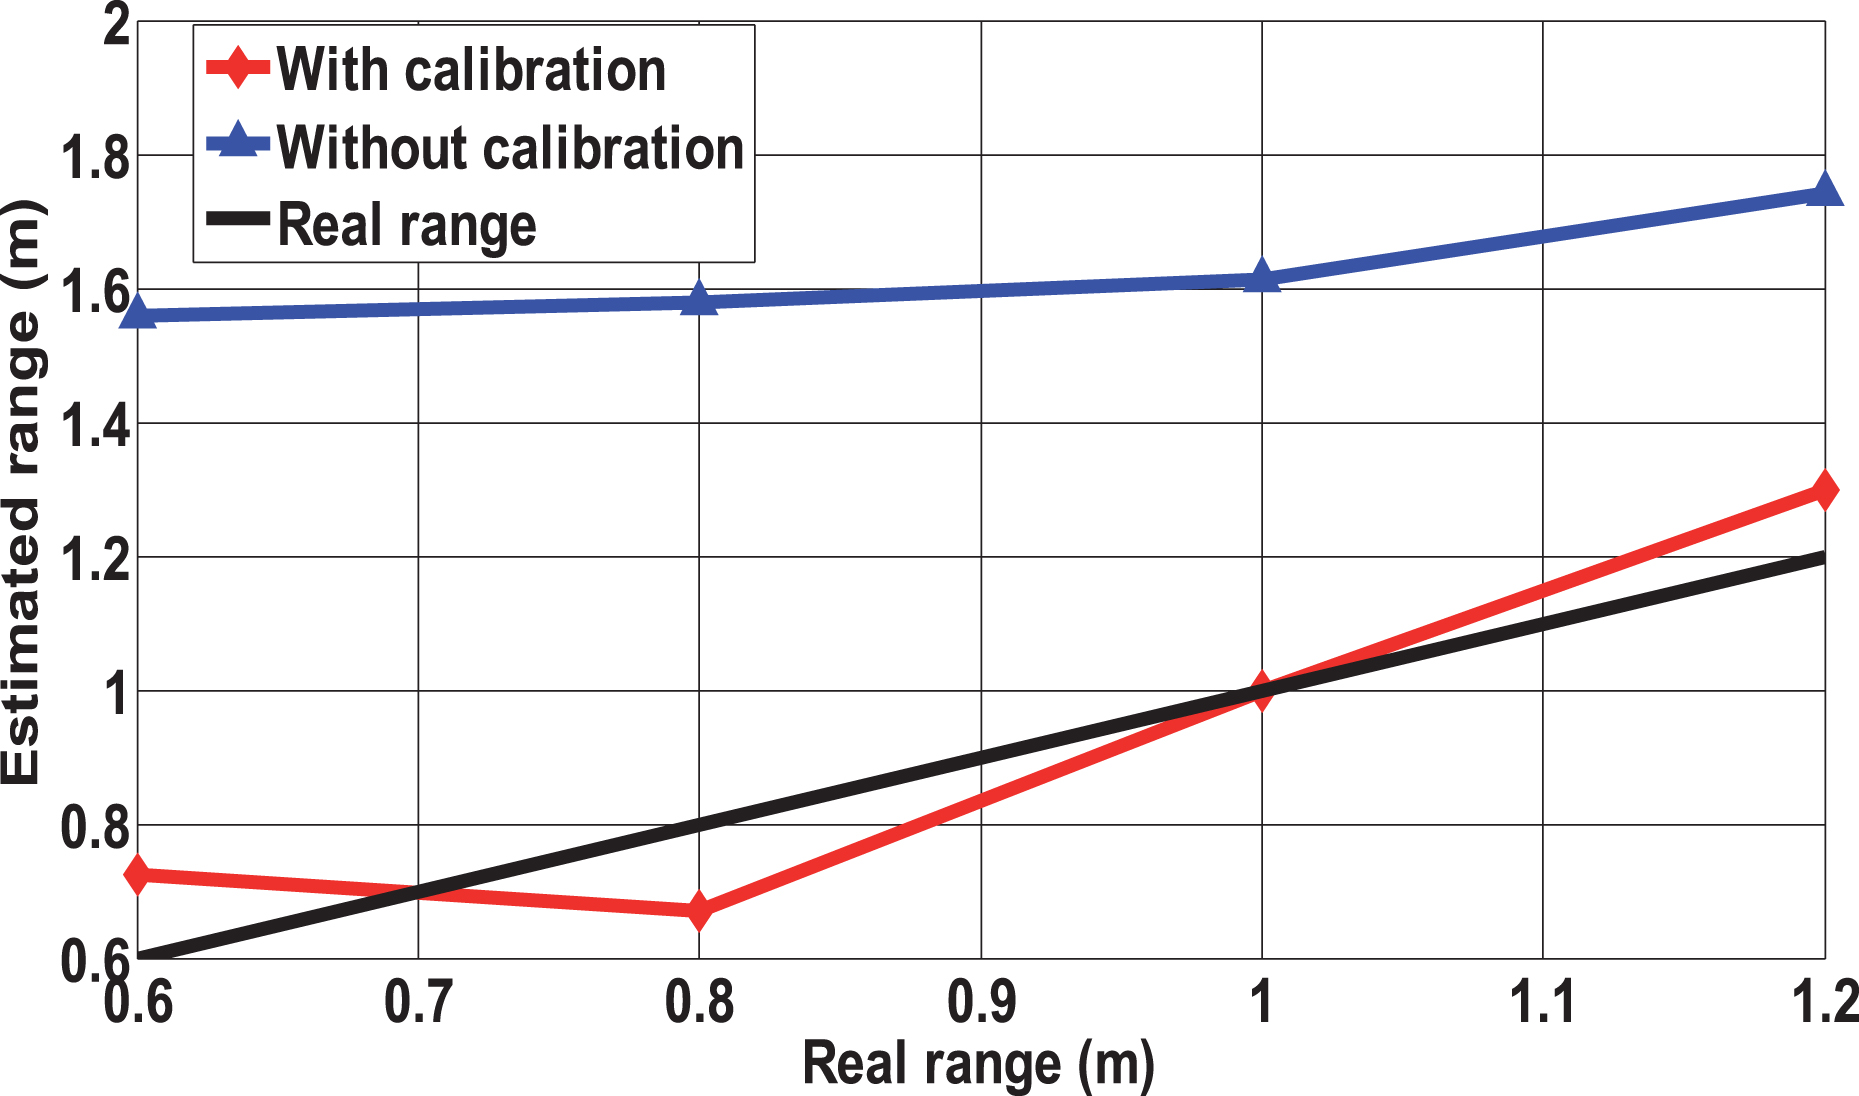
Range estimation with the proposed method (θ j =10(°)).
For a tag located at 10(°), the range is estimated with an accuracy of 9.25(cm). The estimated range is defined as the average of detected ranges greater than 50% of the highest peak value found in the one dimensional range search at 10(°).
In Fig. 8, the DOA estimation is done for a tag placed at an angle of 10(°). For this angle, the distance from the tag to the center of the array is successively fixed at 0.6(m), 0.8(m) and 1.2(m). The DOA is properly estimated for all configurations with an average DOA estimation error of 0.75 degrees. Therefore, it is clear that the DOA can be accurately estimated using this method with a calibrated array. Figure 9 shows the absolute range estimation error for each angle. The absolute error is calculated as follows
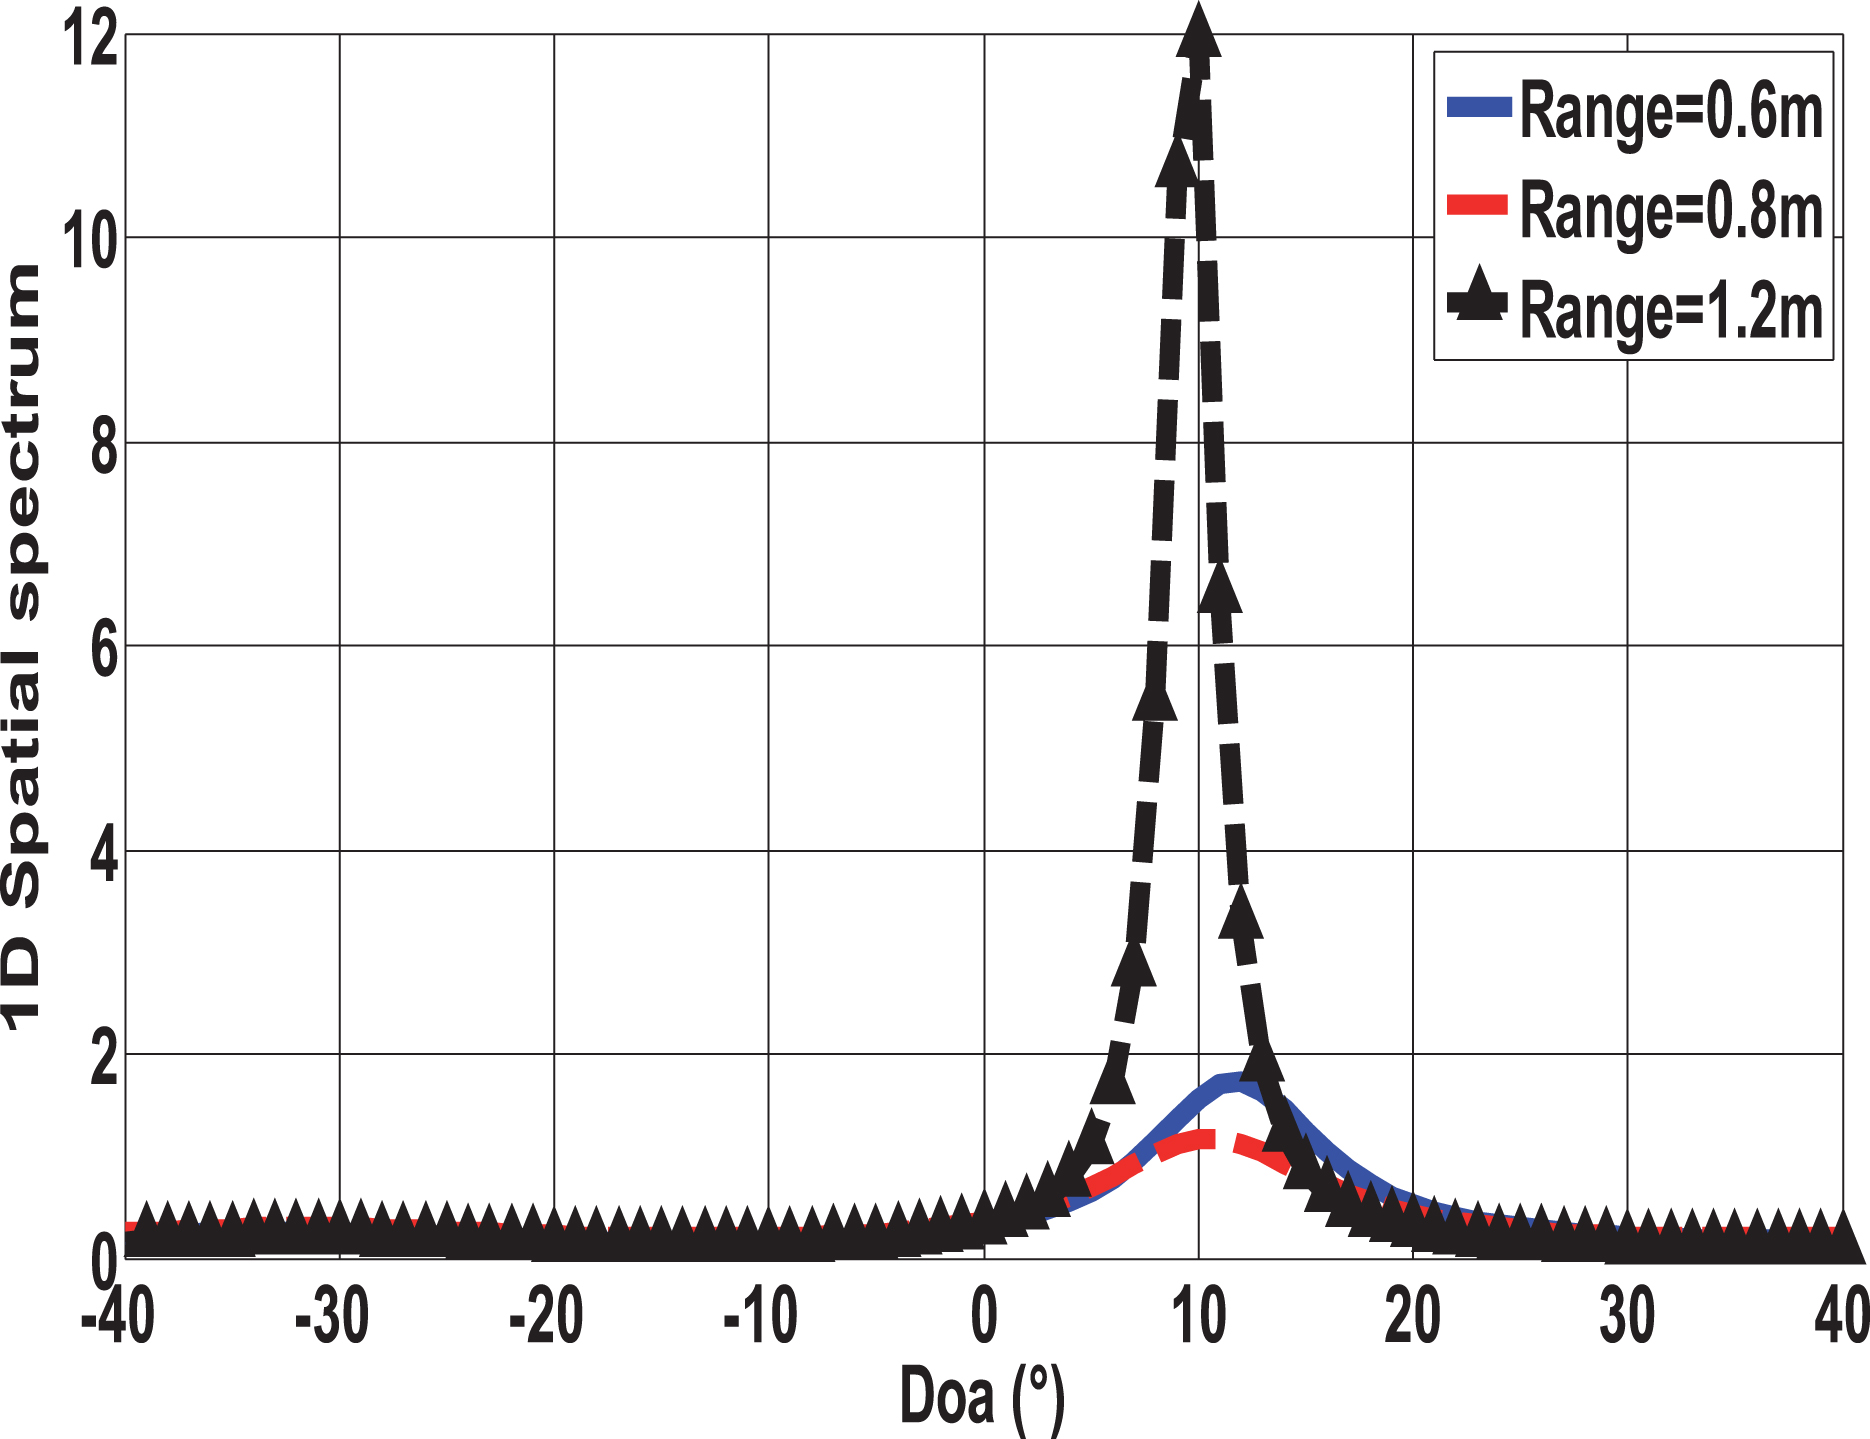
Experimental spatial spectrum of experimental measurements with three range values (0.6(m), 0.8(m) and 1.2(m)) of a tag located at an angle of 10(°).
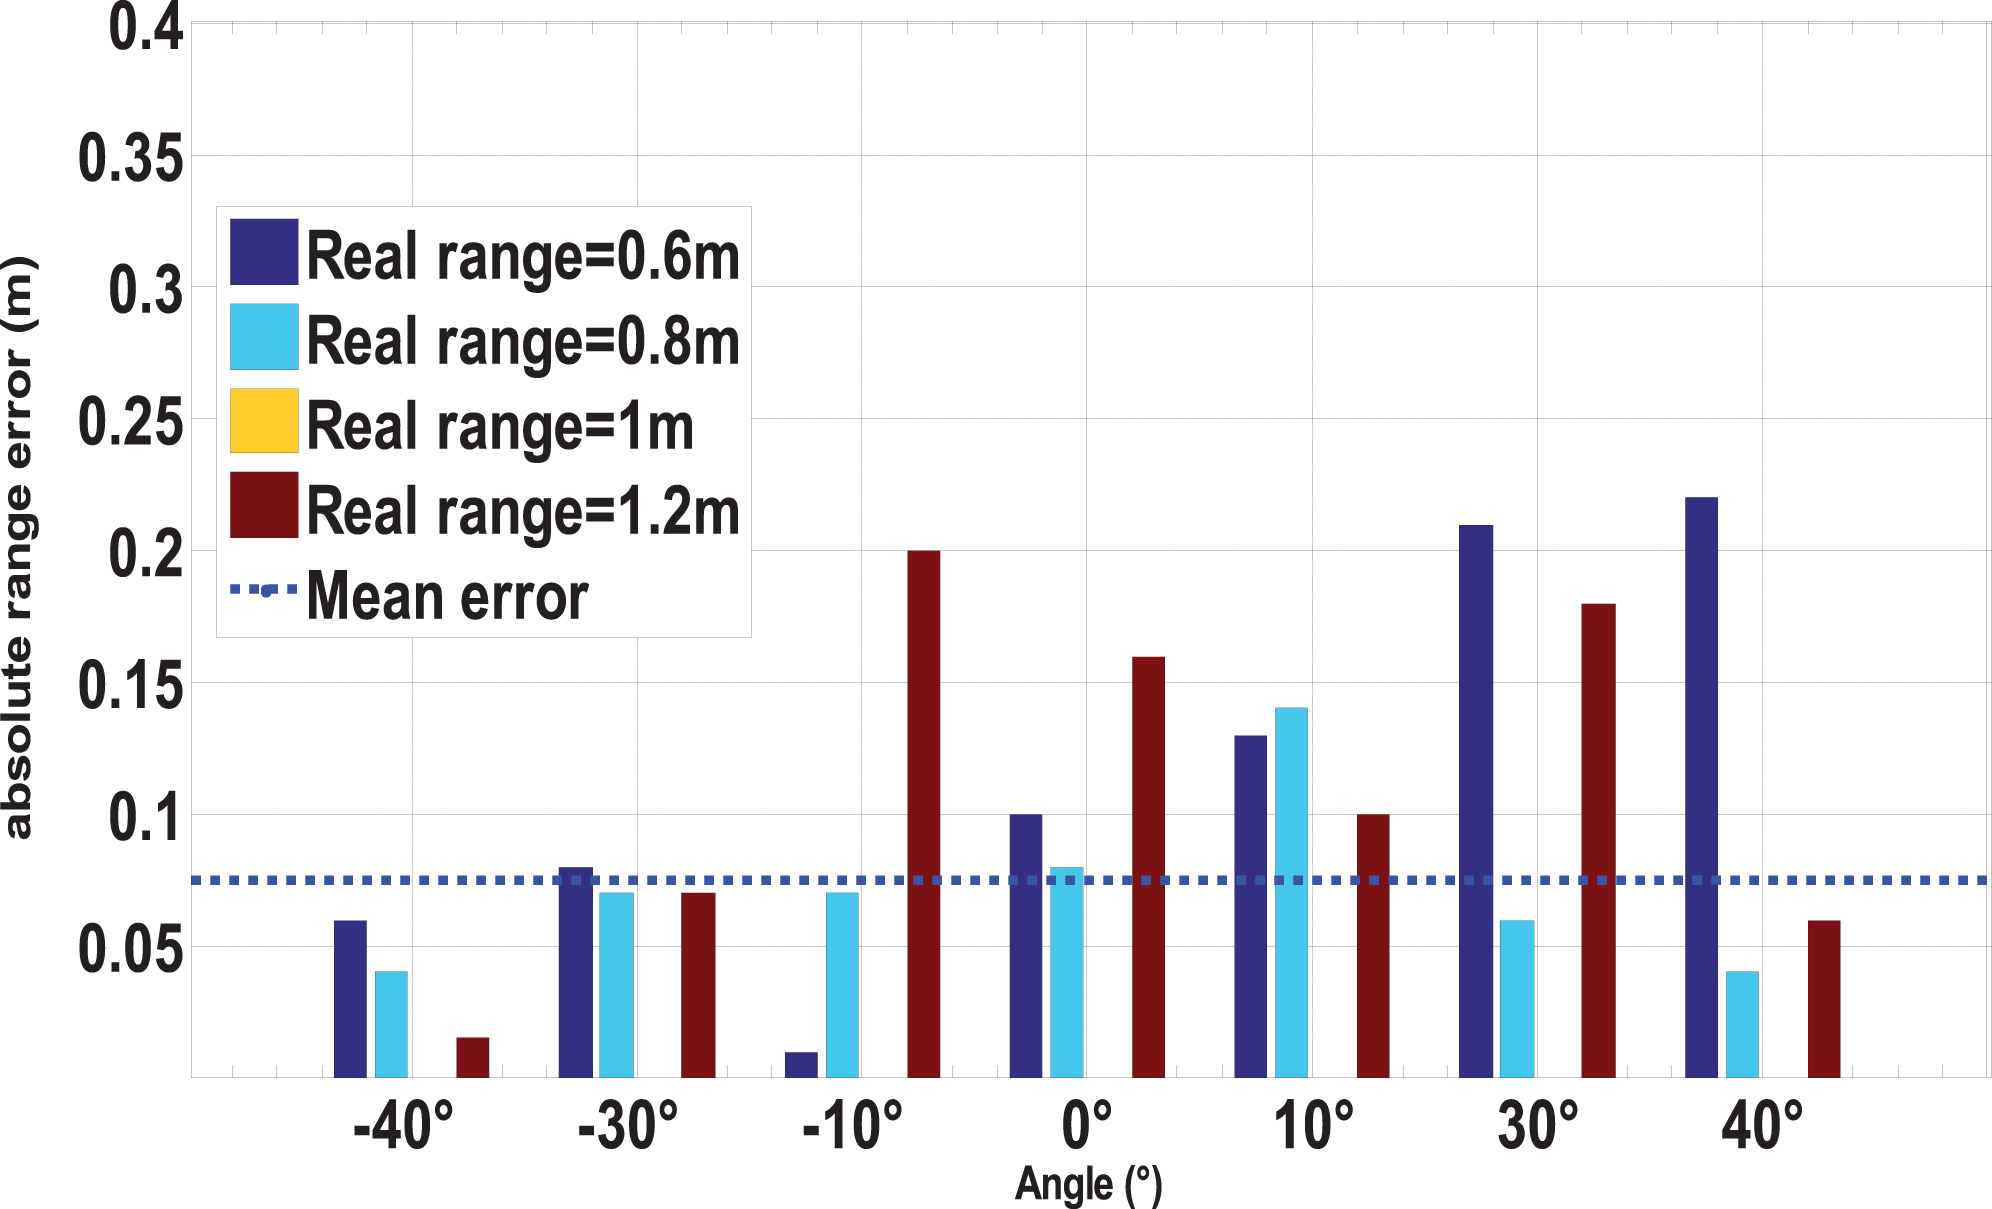
Absolute range estimation error for each angle.
Using an antenna array composed of four patches, we proceed to the estimation of the absolutes Doas errors for each range, the results are shown in Tables 4 and 5. Tables 6 and 7 represents the absolutes ranges errors of the for each angle. On the other hand, to estimate Doa and range of an RFID tag using the HOP method, we use an antenna array composed of three patches because this method requires an odd number of array elements spaced by λ/4 to eliminate the ambiguity in phase, the results are shown in Tables 8–13 for an antenna array consisting of three patches spaced with λ/2.
Estimated Doa of 2D-LCSP (using 4patchs)
Estimated Doa of 2D-MUSIC(using 4patchs)
Estimated Range of 2D-LCSP (using 4patchs)
Estimated Range of 2D-MUSIC(using 4patchs)
Estimated Doa of 2D-LCSP (using 3patches)
Estimated Doa of 2D-MUSIC (using 3patches)
Estimated Doa of HOP(using 3patches)
Table 6 shows the average absolute range error is 7.48 (cm) using four patches. The mean standard deviation of the absolute range error is 5.95 (cm), the smallest range estimation error is 0 (cm) in the calibration position, 89.3% of the range estimations are lower than 20 cm, the range estimation with 2D-LCSP is comparable to that estimated by the 2D-MUSIC method (see Table 7: mean absolute error is 6.16 cm and mean standard deviation is 5.24 cm)
On the other hand, using an array with three patches, the maximum range in the near field region is 2L2/λ = 2λ = 0.7m, in our experimental configuration, because of experimental limitations, we can’t activate the tag at a distance less than 0.6m. In this case, Table 11 shows that 2D-LCSP estimates the range with absolute error of 12 cm at the range of 0.67m. The estimated range with 2D-LCSP is comparable to that estimated by the 2D-MUSIC method (Table 12: absolute error of 10.75 cm), and better than the estimated range with the HOP method (Table 13: absolute error of 17.88 cm).
Estimated Range of 2D-LCSP (using 3patches)
Estimated Range of 2D-MUSIC(using 3patches)
Estimated Range of HOP(using 3patches)
The proposed method is better than the range estimation based on the phase measurements at multiples frequencies reported in (Povalac et al., 2011). It is comparable with the range estimation approaches using the EPATL (Enhanced Phased Array antenna Tag Localization) method in (Qiu et al., 2017) and the AoAct transmitter beamforming technique in (Markus et al., 2016).
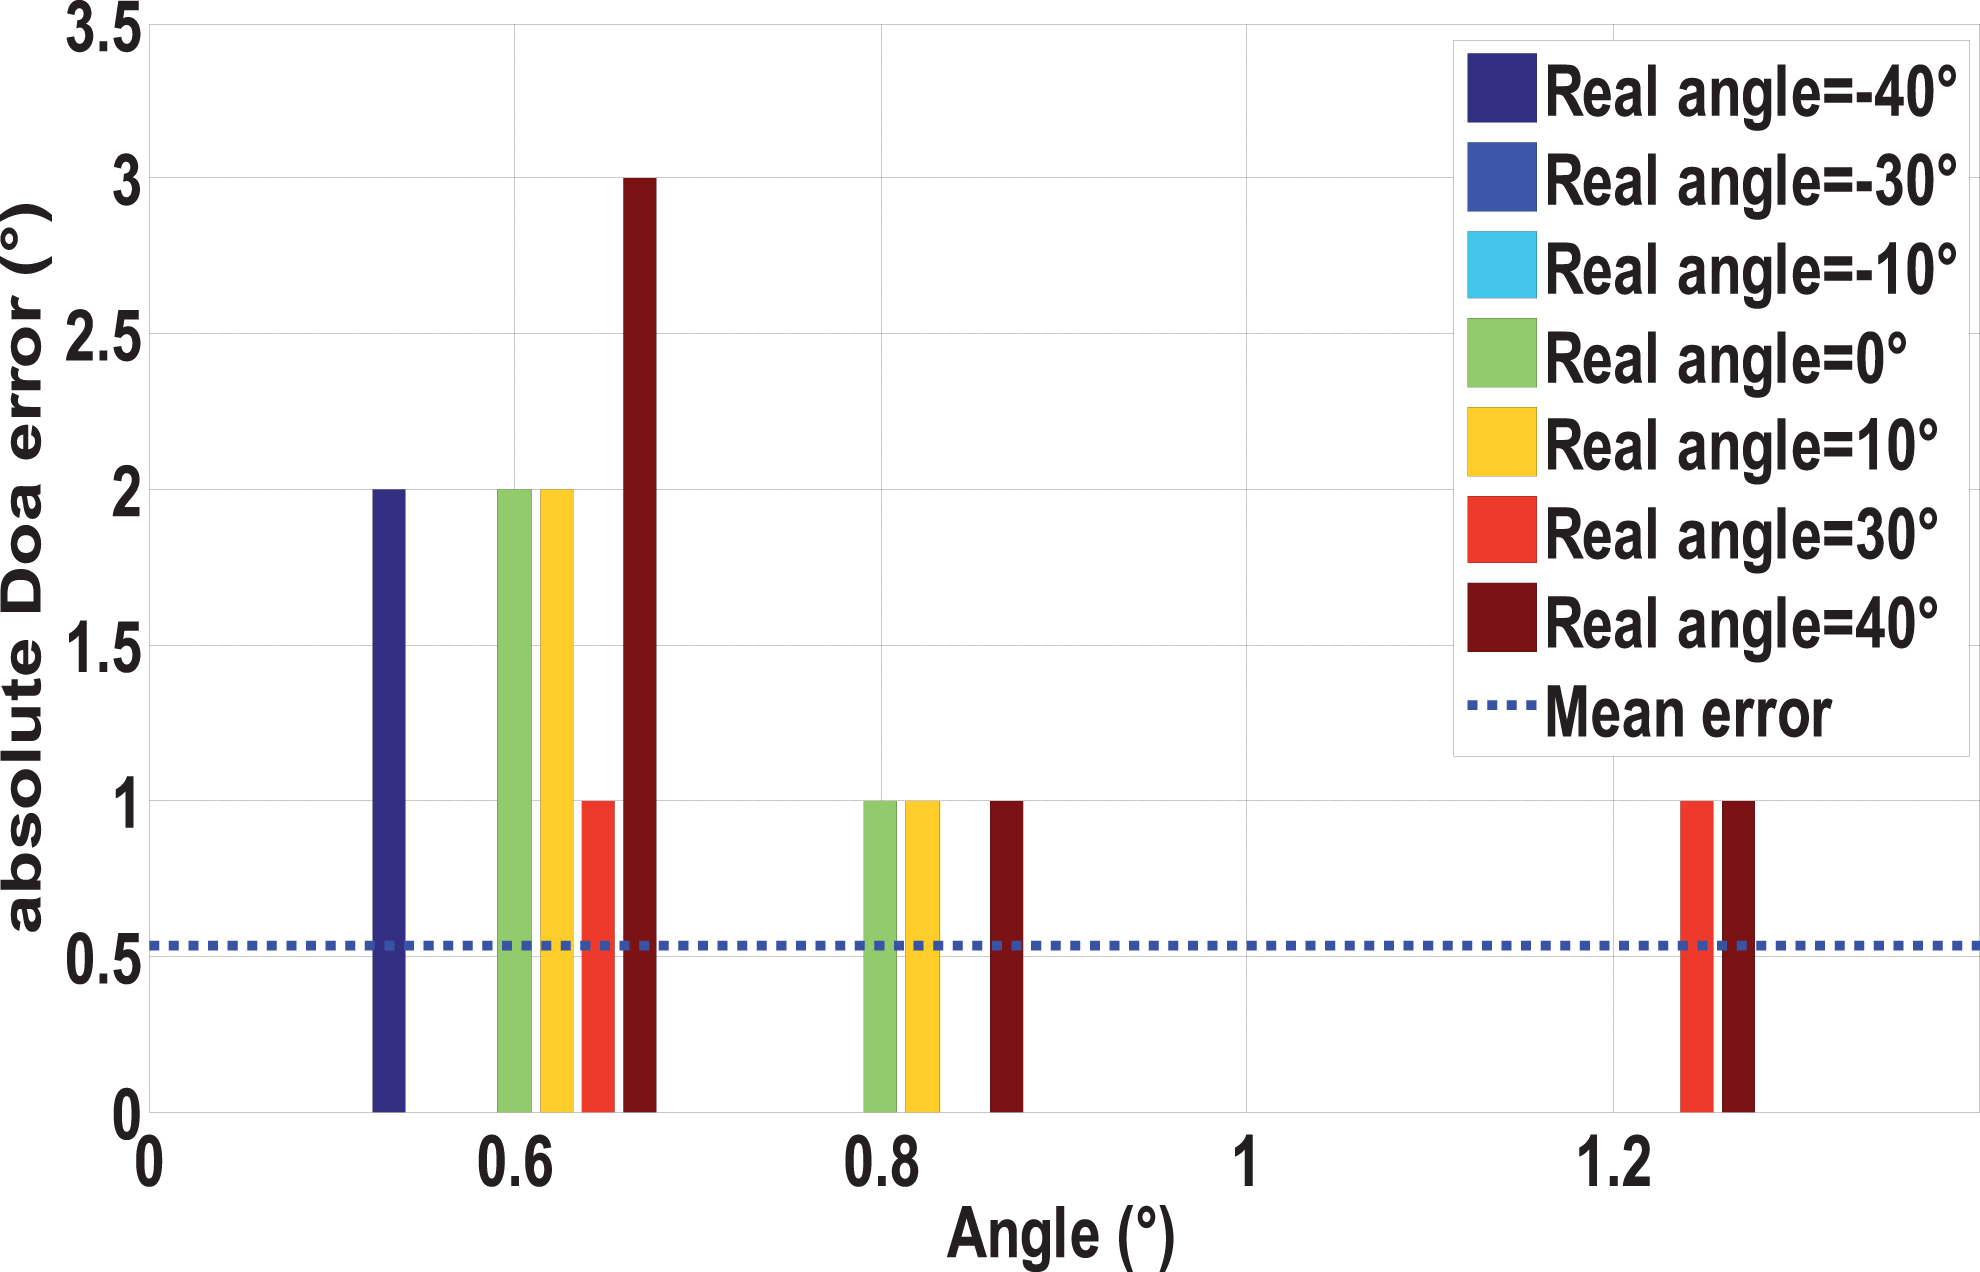
Figure 10 shows the absolute DOA estimation error for each range. The DOA absolute error is calculated as follows:
For each angle at calibration position (range = 1m), the estimated range is 1m, so the absolute range error is zero, therefore it is not plotted in the Figs. 9 and 10.
Absolute DOA estimation error for each range.
The average absolute Doa error of 2D-LCSP is 0.5357(°) using array with four patches. Table 4 shows the mean standard deviation of the absolute doa error is 0.4991 (°), the smallest DOA estimation error is 0(°) in the calibration position and 1(°) for the other positions, 85.71% of the DOA estimations are lower than 2(°), the estimated DOA with 2D-LCSP is comparable to that estimated by the 2D-MUSIC method (Table 5: an absolute error of 0.4286° and standard deviation of 0.3134°).
On the other hand, using an array with three patches, Table 8 shows that 2D-LCSP estimates the Doa with mean absolute error of 1.25° and a standard deviation of 0.4330°. The estimated Doa with 2D-LCSP is comparable to that estimated by the method 2D-MUSIC (Table 9: mean absolute error of 1° and standard deviation of 0.9825°), and better than the estimated Doa with the HOP method (Table 10: mean absolute error of 2° and standard deviation of 1.1213(°).
The proposed DOA estimation method is better than 2.5(°) that reported in (Cremer et al., 2014; Azzouzi et al., 2011).
The new method proposed in this paper estimates the short-range localization of a passive UHF RFID tag in the NF of a calibrated array. Experimental results using four patches show a range estimation mean error of 7.48 cm and a DOA estimation mean error of 0.53° for a range varying between 60 cm and 120 cm and an angle varying from –40° to 40°. This is done without eigenvalue decomposition of the covariance matrix in contrast to existing techniques such as 2D-MUSIC, ESPRIT-like and HOP. As a result, the method shows lower complexity and computational cost as well as better performances with a calibrated array compared to the related literature. The future work for this work is the implementation of the proposed method on commercial RFID system.