
Abstract
In traditional VIRE method, the linear interpolation is used to estimate the relationship between RSSI and distance, this increases the positioning error. Moreover, the label elimination threshold is a fixed value that is obtained by repeated adjustment experiments, this increases the time complexity of positioning. For these two problems, an adaptive VIRE indoor positioning algorithm is proposed based on Kriging interpolation. The Kriging interpolation is used to estimate the RSSI value of the virtual tag, and the threshold is automatically adjusted according to the real-time characteristics of the pending tag, so that the number of adjacent tags is nearly optimal, and the interference is more accurately eliminated, thereby the positioning coordinates are obtained. The experimental comparison results show that the algorithm not only saves the positioning cost, but also improves the positioning accuracy.
Keywords
Introduction
Kriging is a regression algorithm for spatial modeling and prediction (interpolation) of stochastic processes/destinations based on covariance functions (Le et al. 2006). In a specific stochastic process, such as the intrinsic stationary process, the Kriging method can give the Best Linear Unbiased Prediction (BLUP), so it is also called the spatial optimal unbiased estimate in geostatistics (spatial BLUP). The study of Kriging can be traced back to the 1960 s. The prototype of the algorithm is called Ordinary Kriging (OK). Commonly improved algorithms include Universal Kriging (UK), collaboration. Co-Kriging (CK) and Disjunctive Kriging (DK); Kriging can be combined with other models to form a hybrid algorithm. If the form of the covariance function is equivalent and the modeled object is a stationary Gaussian process, the output of ordinary Kriging and the Gaussian Process Regression (GPR) are the same in the mean and confidence interval of the output under normal likelihood. As is shown in Fig. 1, there is stable prediction effect (Rasmussen et al. 2006).
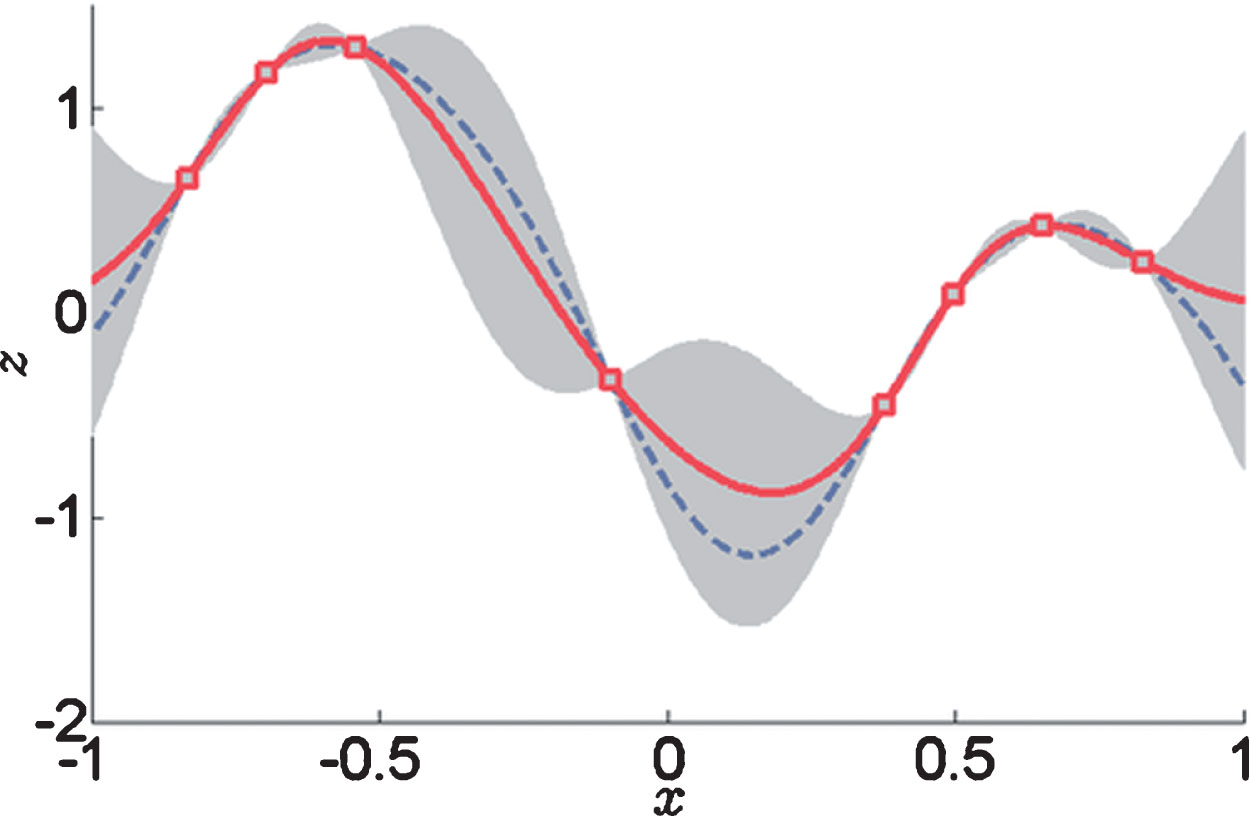
Example of one-dimensional data interpolation by kriging, with confidence intervals.
In Fig. 1, squares indicate the location of the data. The kriging interpolation, shown in red, runs along the means of the normally distributed confidence intervals shown in gray. The dashed curve shows a spline that is smooth, but departs significantly from the expected intermediate values given by those means.
In the indoor environment, RFID has strong anti-interference ability and can be carried out in harsh environments (Saad et al. 2011; Peng et al. 2019; Chen, 2019; Zhai, 2018). Due to its non-line-of-sight and non-contact, relatively low price, it can be used for positioning to achieve high-precision positioning requirements. VIRE is an RFID indoor positioning system that introduces reference tags.
With the continuous deepening development of Ubiquitous Computing, the location information service has attracted more and more people’s attention. Positioning systems have been proposed based on RFID, 802.11b, Bluetooth, ultra-wideband and other technologies (Zhang & Chen, 2015; Li & Becerik-Gerber, 2011; Jiang et al. 2009). Most of the existing RFID positioning algorithms are based on the Received Signal Strength Indicator (RSSI) to estimate the position of the object to be located (Zhao et al. 2010; Yin et al. 2018; Shang, 2018). The more classical algorithms are LANDMARC (Ni et al. 2004) and VIRE(Virtual Reference Elimination) (Zhao et al. 2007; Lu et al. 2018; Liu et al. 2017). LANDMARC used reference tag-assisted positioning as a positioning reference point. VIRE introduced a virtual reference tag based on this, it reduced the mutual interference between reference tags (Jiang et al. 2007; Ahn & Yu, 2009) and improved the positioning accuracy. However, the shortcoming of the VIRE algorithm is that the RSSI data set of the reference tag is extended by linear interpolation, and the RSSI is nonlinearly related to the distance (Zhou et al. 2012), In the virtual tag elimination process, the threshold parameter needs to be obtained through repeated adjustment experiments. This method is too complicated. When the application scenario environment changes greatly, the fixed threshold will be invalid, it would result in an increase in error.
The VIRE algorithm is improved by the classic LANDMARC algorithm (Xu et al. 2011; Li et al. 2012), a reference tag is used as a positioning reference to assist in positioning, and the reference tag density is expanded by linear interpolation, then the impossible position is eliminated, the remaining “adjacent label “ weighted average is used to correct the uncertainty of the pending tag (Wang et al. 2010), so that the algorithm is less affected by changes in the external environment during the positioning process, and it has higher stability.
Virtual reference elimination method
VIRE is Virtual Reference Elimination Method. In the positioning area, the reference label of the known position information is laid in a rectangular grid shape, and the label grid unit is covered by each of the four real reference labels, it is further divided into equal large virtual network cell units of N×N (N is the virtual label density). Each virtual mesh endpoint is treated as a virtual tag. The RSSI of the real reference tag is measured by the reader, and the coordinates are known. As is shown in Fig. 2.
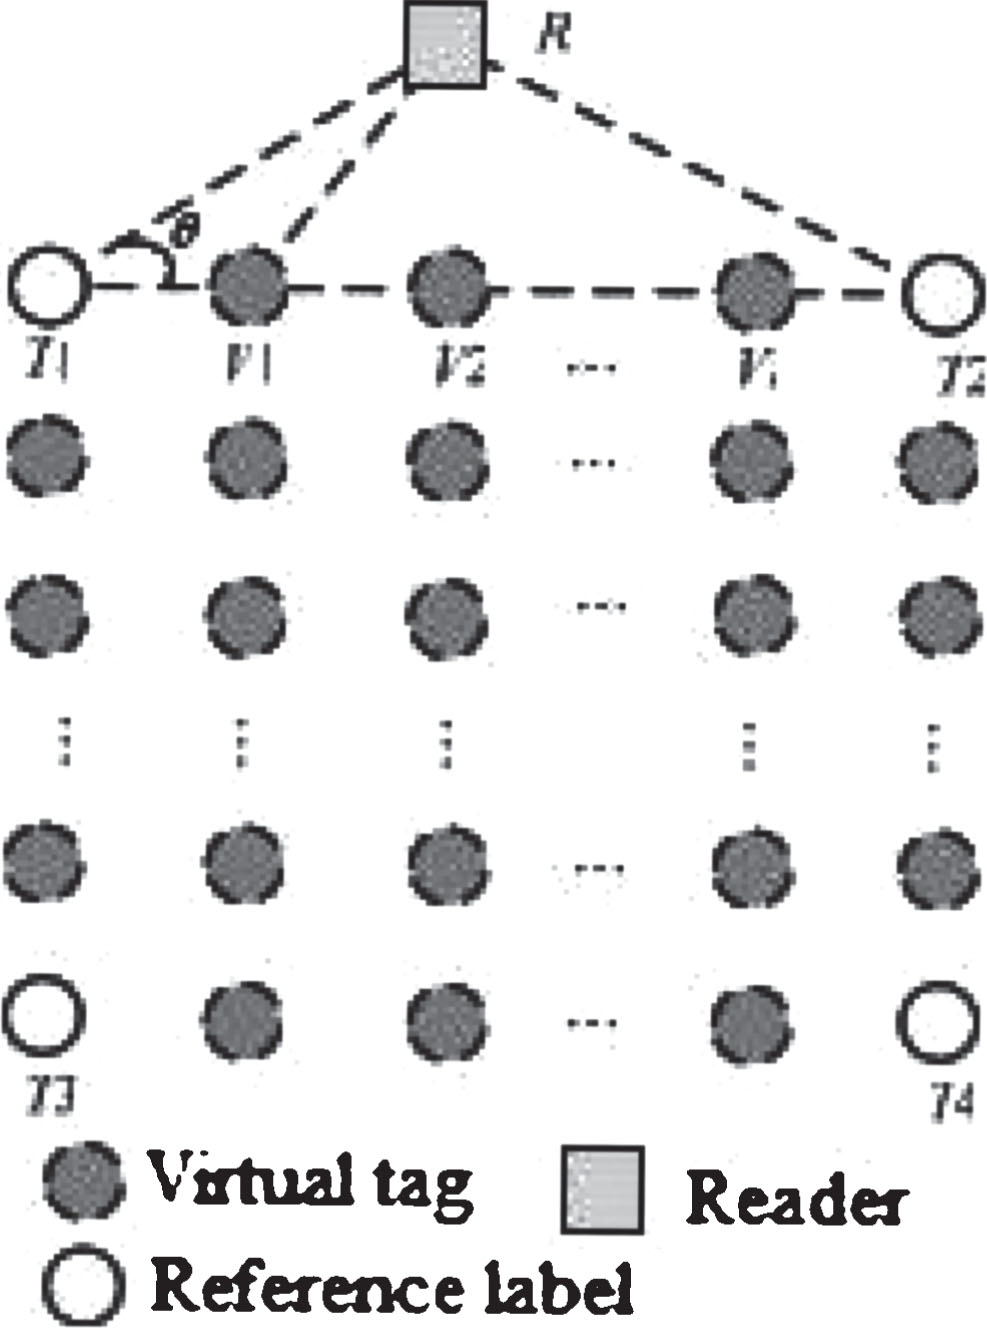
Grid virtual reference label distribution.
Let a certain coordinate (i,j) (i,j∈R) fall in the reference label network, it is surrounded by 4 real reference labels, and the RSSI of the real reference label is obtained by the reader. In the known real reference label, the coordinates and RSSI of the virtual tag of the region are calculated based on the linear interpolation. The RSSI of the virtual reference labels in the horizontal direction and the vertical direction are obtained by the Equations (1) and (2), respectively.
Where p = i% N (0≤p≤N-1) is the interval between the virtual reference estimated label and the known start label on the X-axis, q = j% N (0≤q≤N-1) is the interval between the virtual reference estimated label and the known start label on the Y axis; parameter a = [i/N], b = [j/N], [.] means rounding down.
After the virtual tag mesh is established, the reference tag signal strength matrix S
l
(it is read by the l-th reader) is obtained, and each element of the matrix is compared with the signal strength θ
l
of the tag to be located read by the l-th reader, if the result is below a certain threshold, 1 is counted, and 0 is reversed, and the resulting matrix is called a proximity map (Zhao et al. 2007). Take the intersection of all L neighboring graphs as the area with the highest probability of the label to be located. Two weighting factors ω1i and ω2i are introduced.
Where Rl(Ti) is the RSSI value of the i-th virtual reference tag which is obtained by the l-th reader, and Rl(θ) is the RSSI of the l-th reader reading the tag to be located.
The connected tags together are grouped into one class, nci is the number of tags in the i-th class, and na is the number of classes after clustering, and the weight ω2i is obtained. ωi =ω1i×ω2i as the final weight, and the coordinates of the pending tag are given by Equation (5):
Kriging interpolation, also known as the space auto-covariance optimal interpolation method, is an optimal interpolation method named after the mining engineer D.G. Krige of South Africa. The Kriging method is widely used in groundwater simulation, soil mapping and other fields, and is a useful geological statistical grid method.
The Kriging interpolation method first considers the variation distribution of spatial attributes in spatial position. Determines the range of distances that have an influence on the value to be interpolated, and then uses the sampling points in this range to estimate the attributes of the points to be interpolated. value. According to the different spatial position of the sample and the degree of correlation between the samples, different weights are assigned to each sample grade, and the sliding weighted average is performed to estimate the average grade of the central block.
This method mathematically provides an optimal linear unbiased estimate (determined value at a point) for the object under study. After considering the geometric shape of the information sample, the geometrical features such as the spatial position of the block to be estimated, and the spatial structure of the grade, an estimate of linearity, unbiasedness, and minimum estimated variance is given for each sample. A certain coefficient, and finally a weighted average to estimate the block segment quality. However, it is still a smooth interpolation method. When the data points are large, the result of the interpolation is highly reliable.
Compared with traditional interpolation methods (such as least squares, triangulation, distance weighted averaging), the advantages of kriging are as follow: In the process of data gridding, the spatial correlation properties of the description object are considered, so that the interpolation result is more scientific and closer to the actual situation; The error of interpolation (Kriging variance) can be given, so that the reliability of the interpolation is clear at a glance. There is less uncertainty than other predictive models. It can filter out the abnormal value caused by measurement error. Ability to find the correlation of variables between feature points and covariates.
Virtual label calculation based on Kriging interpolation
The Kriging interpolation method is a method based on the theoretical analysis of variograms (Xu et al. 2011; Li et al. 2012), the linear unbiased estimation is optimized for the values of variables in a finite region. The Kriging method not only considers the relationship between the estimated position data and the known position data, but also it considers the spatial correlation of the variables, and the virtual reference label RSSI is calculated by Kriging interpolation.
RSSI (Received Signal Strength Indicator) is an indication of the received signal strength, an optional part of the wireless transmission layer, which is used to determine the quality of the link and whether to increase the broadcast transmission strength. A positioning technique for determining the distance between a signal point and a receiving point by the strength of the received signal, and then performing positioning calculation according to the corresponding data.
Such technology and algorithm are adopted by the positioning engine of the wireless sensing ZigBee network CC2431 chip. The average signal strength indication of the receiver input obtained by the receiver measurement circuit. This measurement typically does not include antenna gain or loss in the transmission system.
Let Xi be the i-th (1≤i≤M) reference label position in the positioning area, and the label characteristic attribute RSSI is R(Xi). Then, the unbiased estimation of the RSSI value of the virtual label point X0 can be expressed by the following formula (6):
λi is the weight of the real reference label to the interpolation point. The weighting factor of ordinary Kriging interpolation is determined by the following Equation (7):
Where γ(Xi, Xj) is the semivariance of R(X0) between the real reference labels Xi and Xj (Li et al. 2012), γ(X0, Xj) is the semi-variance of R(X0) between the real reference label point Xj and the virtual label point X0, these quantities are calculated from the appropriate variogram. μ is the Lagrangian multiplier when minimizing processing.
((h) reflects the spatially related part of Z(x), which is equal to the mathematical expectation of the square of the difference between all the sample measurements separated by a given spacing h: where N(h) is the spacing of h The number of pairs of observation points. The graph of the semivariogram of a particular direction is usually obtained by ((h) plotting h. Usually the value of the semivariogram function increases with the spacing of the samples, and at a certain The spacing (called range, range) rises to a substantially constant constant (called a sill).
Optimal interpolation estimate: If the regionalized variable satisfies the second-order stationary or eigenal hypothesis, the estimation of the point or block segment can be directly based on the Puctual Kriging or the Block Kriging. The two methods are the most basic estimation methods, also known as Orging Kriging (OK).
In the interpolation calculation process, in order to reduce the amount of calculation, the theoretical model is usually used to fit the variogram. The fitting model is divided into a spherical model, a ring model, an exponential model and a Gaussian model. The Gaussian model is more in line with the relationship between the tag RSSI and the distance, and the Gaussian model (8) is used here:
Where C0 is the nugget constant, C is the arch height, and the range
The variogram value γ(h) of the above formula is substituted into the Equations (7), the Lagrange multiplier μ and the weighting coefficient λi are substituted into Equation (6), and the RSSI estimation value of the virtual label point X0 can be obtained.
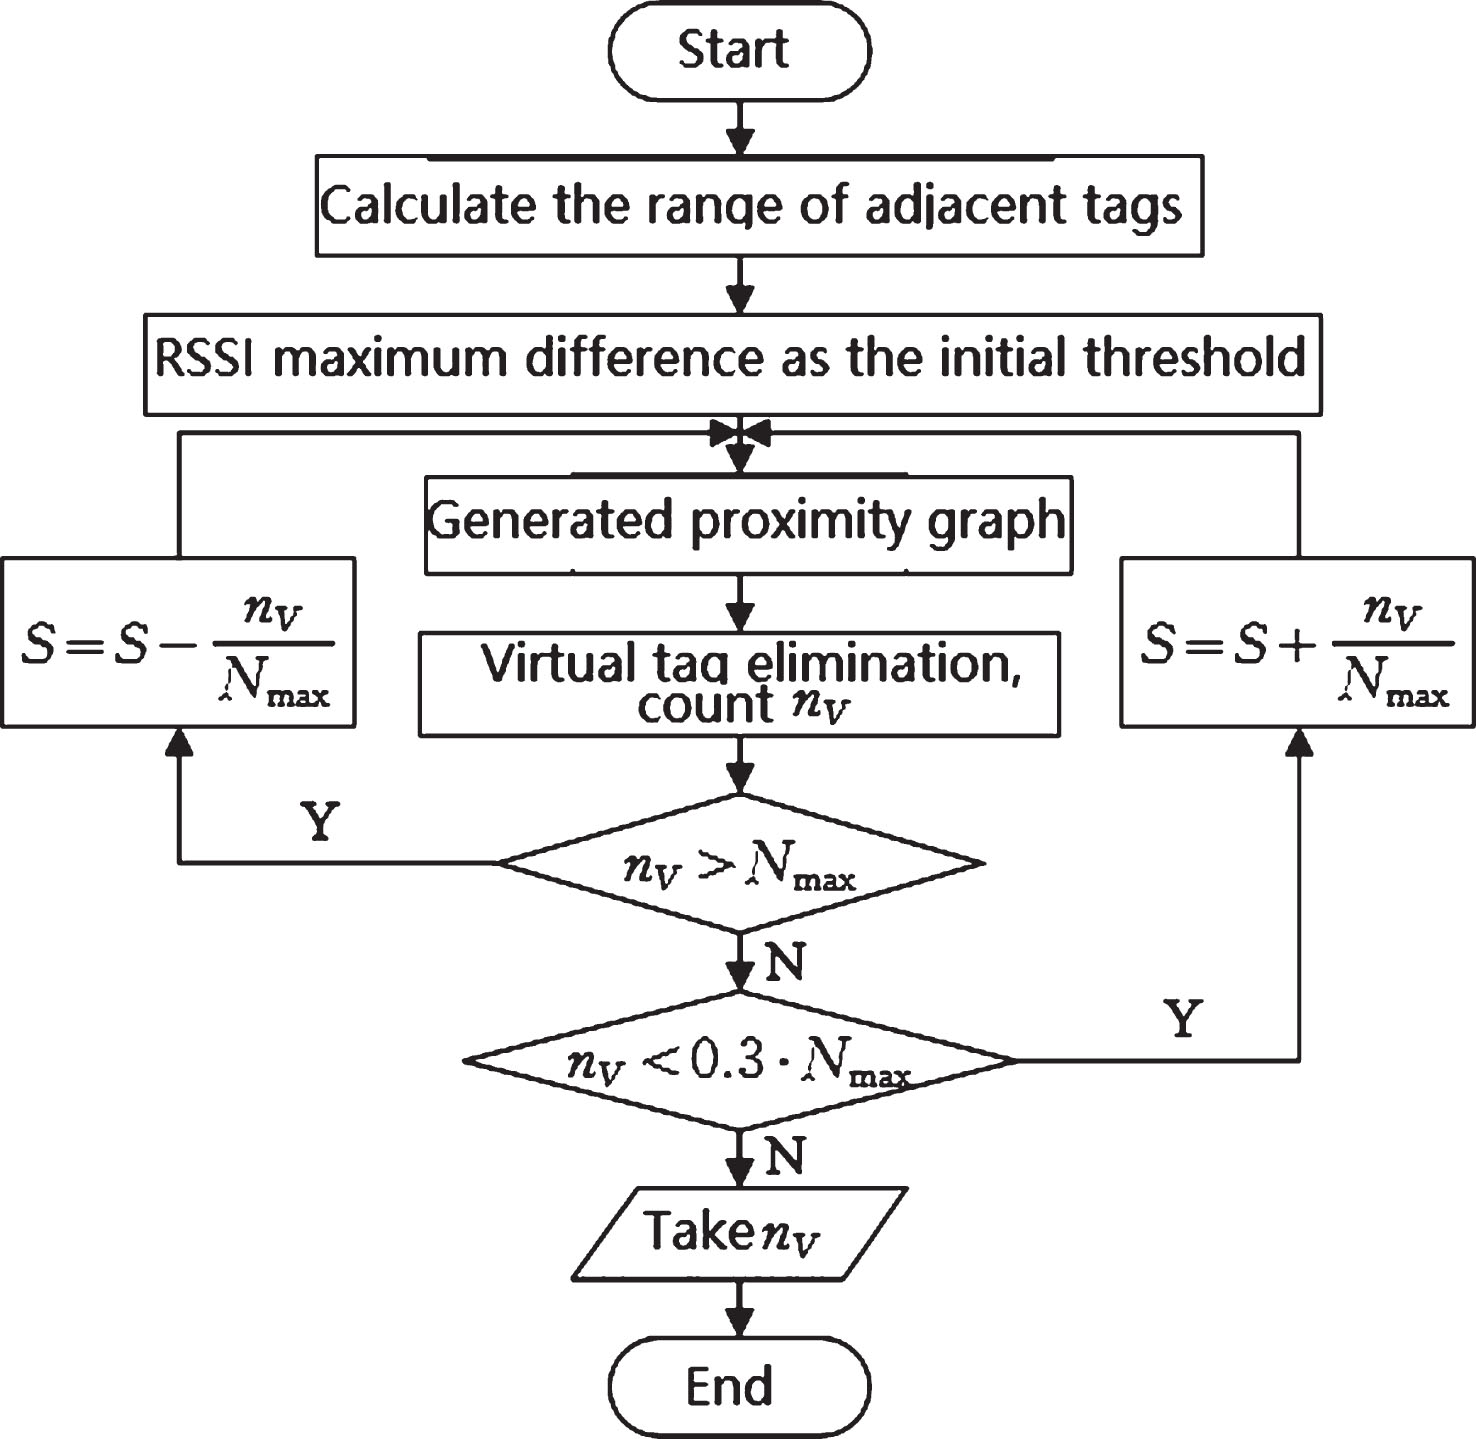
Threshold S is a crucial parameter in the VIRE algorithm, this paper proposes an adaptive threshold adjustment strategy. The steps are as follows: After the virtual reference label elimination process, it is estimated that the range of adjacent labels nV is 0.3·Nmax<nV<Nmax, Nmax = LV/M is the maximum number of adjacent labels, L is the number of readers in the positioning area, and M is the total number of real reference labels, V is the total number of virtual reference labels, the minimum number of adjacent labels is 0.3 times the maximum number of adjacent. The virtual tag matrix is traversed, and the maximum difference is found between the L RSSI values read by the L readers and the RSSI values in the virtual tag matrix, and the maximum difference is taken as the initial threshold S. The virtual reference tag elimination process is performed, and in the final neighboring graph, the remaining number of adjacent tags nV is counted. Determine whether nV satisfies the range of adjacent tags. If nV > Nmax, decrease the threshold, S = S-nV/Nmax, and return to step 3); if nV <0.3·Nmax, increase the threshold S = S+nV/ Nmax, return to step 3). If the proximity tag number range 0.3*Nmax<nV<Nmax is satisfied, 0.3 is the experimental test selection, the current threshold S is considered to be desirable, and the iteration ends. This 0.3 is the result of empirical testing.
Algorithm flow is shown in Fig. 3.
Adaptive threshold adjustment process.
The flow of adaptive VIRE indoor positioning algorithm based on Kriging interpolation is as follows: Obtain the real reference tag RSSI matrix. Kriging interpolation expansion matrix is used to obtain a large number of virtual reference labels. The maximum difference between the virtual tag RSSI and the pending tag is used as an initial threshold, and the adaptive threshold adjustment strategy is used to calculate an optimal threshold iteratively. The optimal threshold is obtained, the set of corresponding neighboring labels is also obtained, and finally the neighboring label weighting factor is calculated, and the estimated coordinates of the pending label are the weighted sum of all adjacent label coordinates.
Experiment, comparative analysis and discussion of experimental results
Experimental environment construction
In this paper, the 433 MHz active RFID device of Detective IOT company is used in experiments. The reader is the R701 omnidirectional antenna reader. The tag is the T702 active tag. The active tag can actively send a message to the reader due to its own power supply, and the effective reading radius can reach 50 m in an indoor environment.
An office experimental environment is set up to simulate, the positioning area is 4.5 m×4.5 m, four readers are placed in the four corners of the area, 16 labels are placed into a 4×4 array as a reference label. 50 pending tags are tested in the experiment, and 9 representative pending tags are selected for detailed description, as is shown in Fig. 4. The reader transmits the collected RSSI and tag serial number data to the PC responsible for data processing via the local area network, and the algorithm is implemented by Matlab software programming.
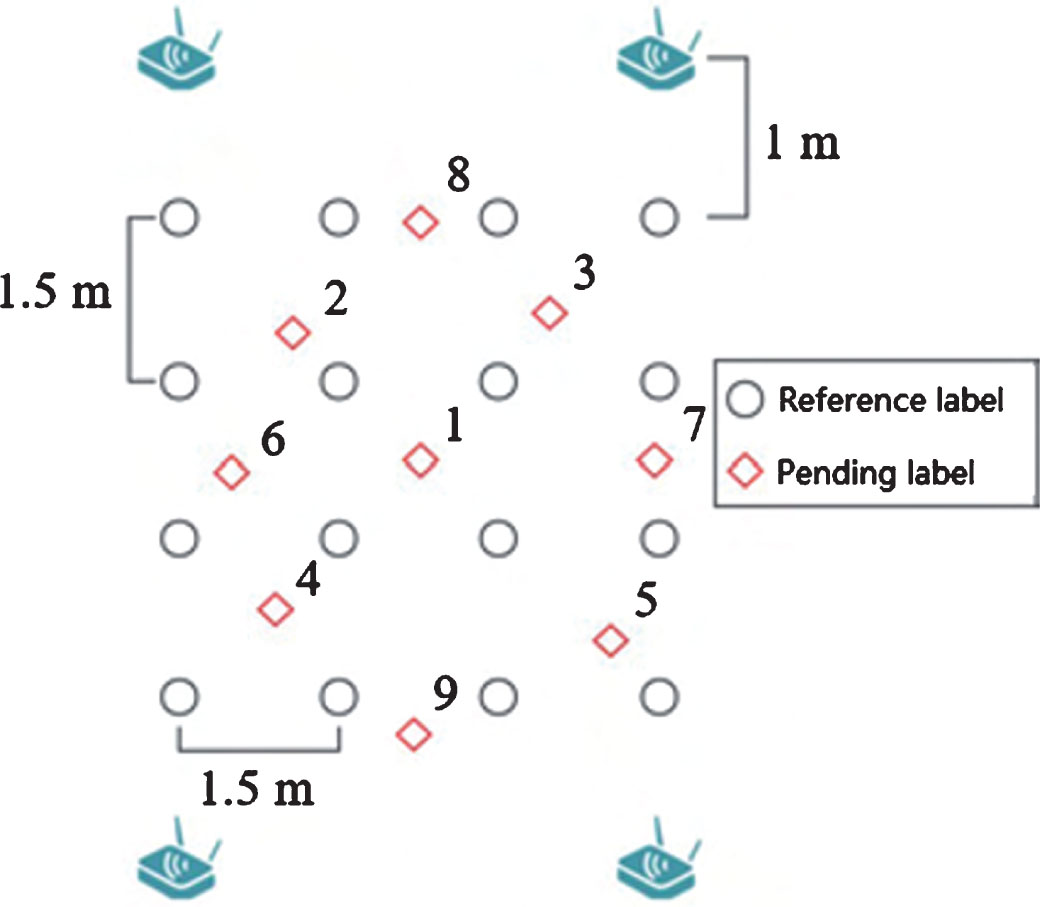
Experimental equipment layout.
In order to verify the superiority of the adaptive VIRE algorithm with Kriging interpolation, the contrast experiment is designed. The proposed algorithm is compared with the classical VIRE algorithm and the VIRE algorithm based on Newton interpolation. If the true coordinate of the pending tag is (x0, y0), and the coordinate of the positioning calculation is (x’, y’), the error
Classical polynomial interpolation methods mainly include Lagrangian interpolation and Newton interpolation. By the existence and uniqueness theorem of the interpolation polynomial, in fact, the two interpolation methods are two variants of the same method, and the idea of constructing the fitting function is the same, and the calculation results are the same (Li et al. 2010; Xu et al. 2017; Wu & Tan, 2017; Huang et al. 2015; Park & Lee, 2013; Digiampaolo & Martinelli, 2012). In the Lagrangian interpolation calculation process, all the base functions need to be recalculated when adding a node, and the Newton interpolation method has inheritance. After the interpolation node is added, it is only necessary to calculate a new line in the difference table on the original basis. And the interpolation of the remainder is also relatively easy. Therefore, in the improved algorithm based on polynomial interpolation in the experiment, the VIRE algorithm is selected based on Newton interpolation.
Since the RSSI data collected by the reader is affected by the multipath effect, 150 data is collected for each tag position to be positioned, Gaussian filtering is performed, and the mean μ and variance σ of the data set are calculated. The formula is as follows:
A Gaussian probability density function is constructed, the RSSI data is traversed, the data is selected into a new array, whose probability density value is greater than 0.6 times the maximum value, such as (11), and the arithmetic mean of the new array is taked as the RSSI value of the pending tag.
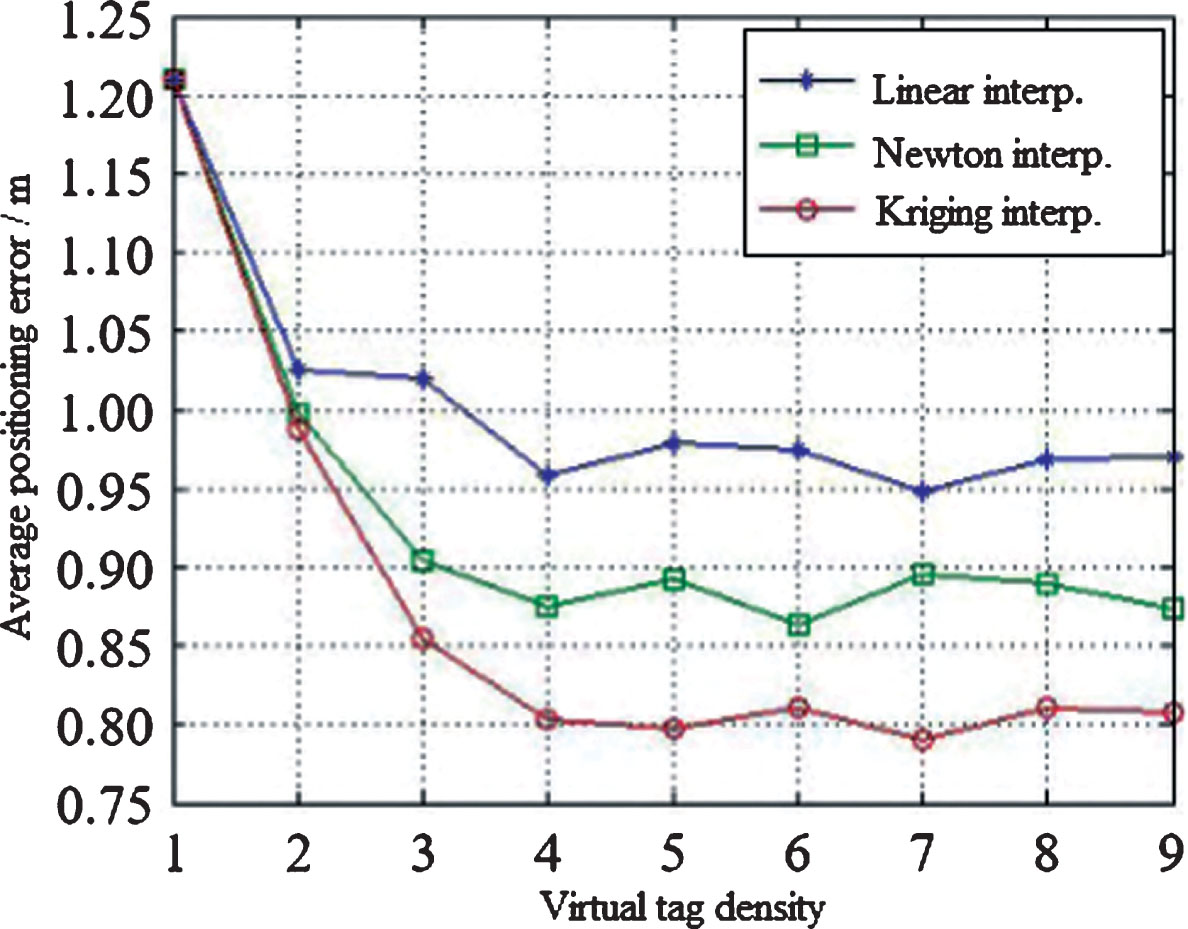
Influence of Different Interpolation Methods and Interpolation Density on Positioning Accuracy.
It can be seen from Fig. 5 in experiment 1 that the average positioning error of the three algorithms shows a downward trend as the virtual tag density increases from 1 to 9. When the virtual tag density parameter is greater than 4, the average positioning error of the three interpolation methods tends to be stable and no longer decreases. At this time, increasing the virtual tag density will increase the time complexity of the algorithm, but the positioning accuracy will not be improved. It can be seen that the average positioning error of the Kriging interpolation algorithm is the fastest with the increase of the virtual tag density, and after algorithm stabilization, the average positioning error is the minimum, it is 0.81 m, and under the premise of the same positioning accuracy, Kerry Gold interpolation requires the least number of tags, the cost of positioning is reduced.
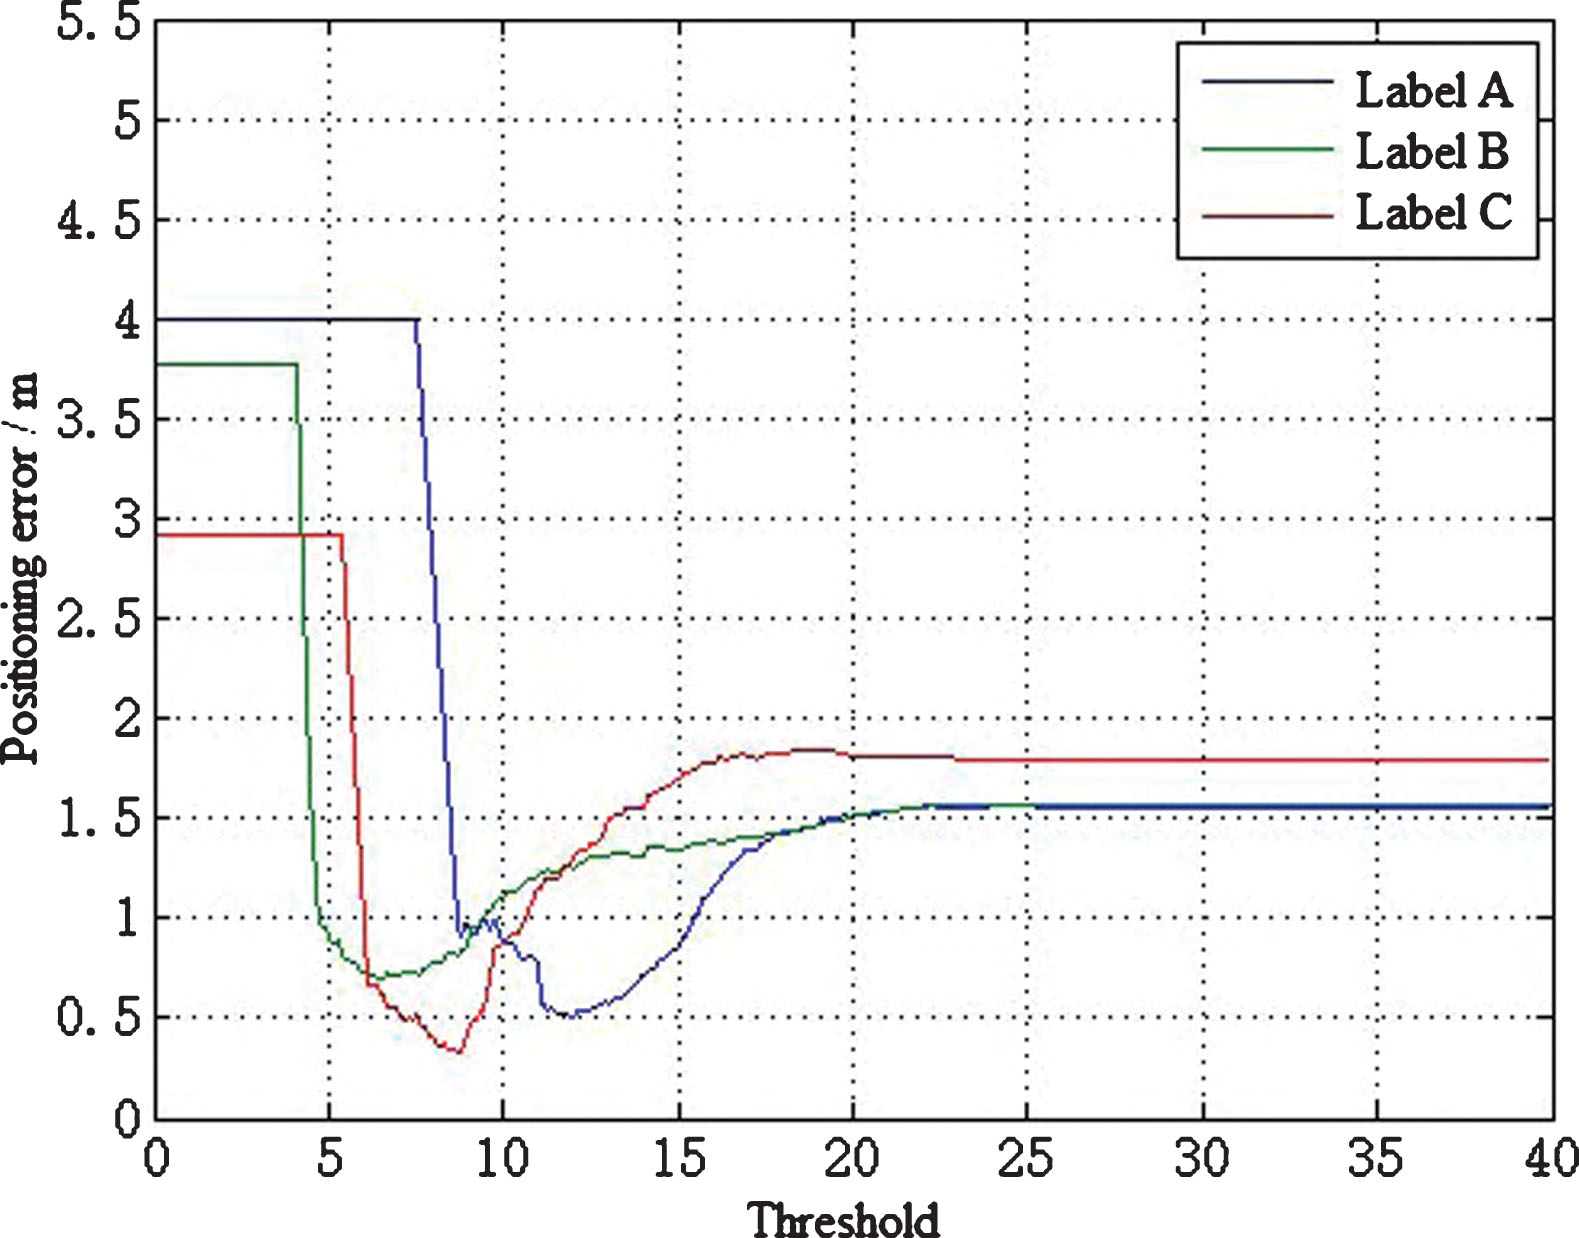
Test label positioning error changes with threshold.
The optimal threshold for different tags can be found in the results of Experiment 2 of Fig. 6. The premise of finding the optimal threshold is to know the location of the pending tag, the purpose is to evaluate the calculation results of the adaptive threshold adjustment strategy in this paper, but the positioning error cannot be calculated during the actual positioning process. Therefore, the optimal threshold cannot be obtained by the classical VIRE algorithm. In this paper, an adaptive threshold adjustment strategy is proposed to estimate the optimal threshold.
In order to test the adaptive threshold adjustment strategy, the required time and result of the appropriate threshold are found, the adaptive threshold adjustment strategy is used to test the data of the same set of 50 pending tags, and the number of adaptive iterations and the threshold calculation result are recorded. The results of the adaptive thresholds for labels A, B, and C are shown in Fig. 7.
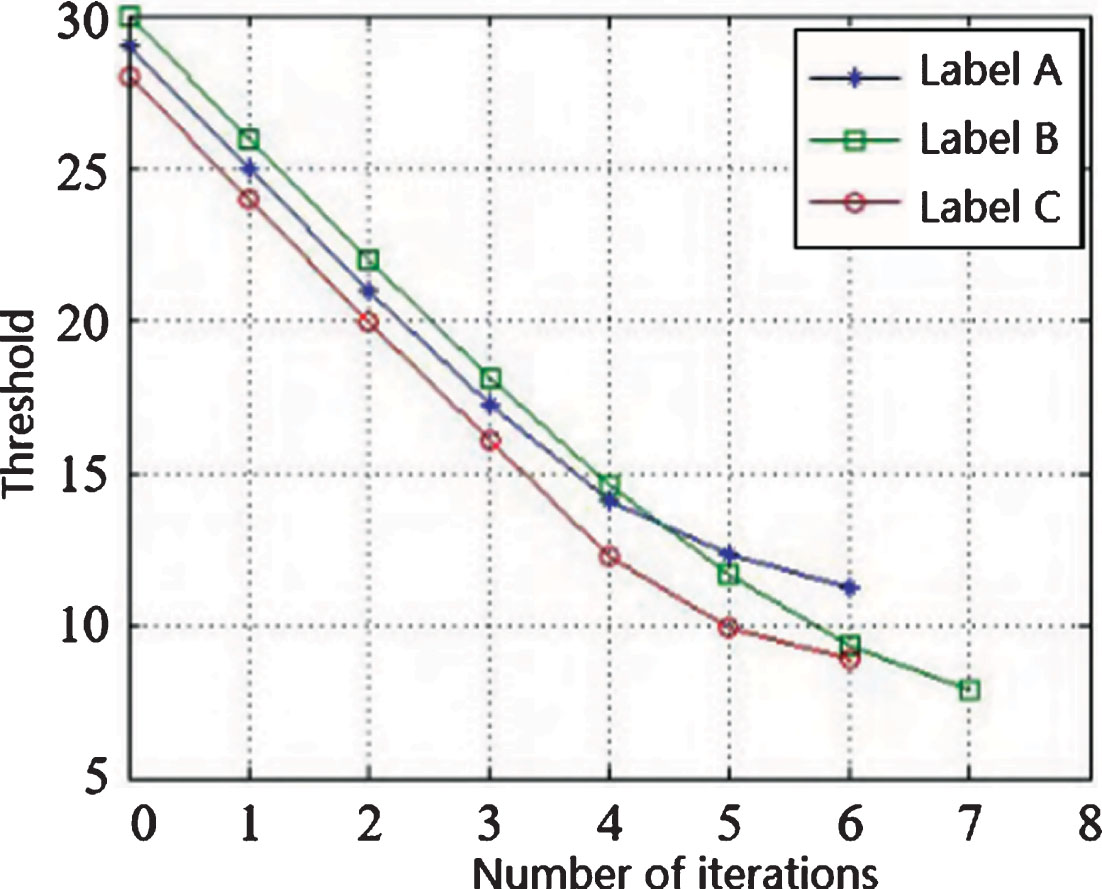
Test tag threshold as the number of adaptive iterations changes.
It can be seen from Fig. 7 that the label threshold decreases rapidly at the beginning of the iteration, and the falling speed becomes slower when the iterative stop condition is approached, and finally the stopping condition is satisfied, and the optimal threshold is obtained. The labels A and B are calculated at the 6-th generation, and the label C ends at the 7-th generation. The adaptive threshold adjustment iterations and thresholds of different labels are not the same.
From the experiment corresponding to Fig. 6, the average positioning errors are extracted, they are corresponding to the optimal threshold value of the tag and the adaptive threshold adjustment, and the adaptive threshold adjustment of the pending tag is extracted from the experiment corresponding to Fig. 7, as is shown in Table 1. After the adaptive threshold adjustment, the positioning error is close to the calculation result under the optimal threshold.
Comparison of positioning error under optimal threshold and adaptive threshold
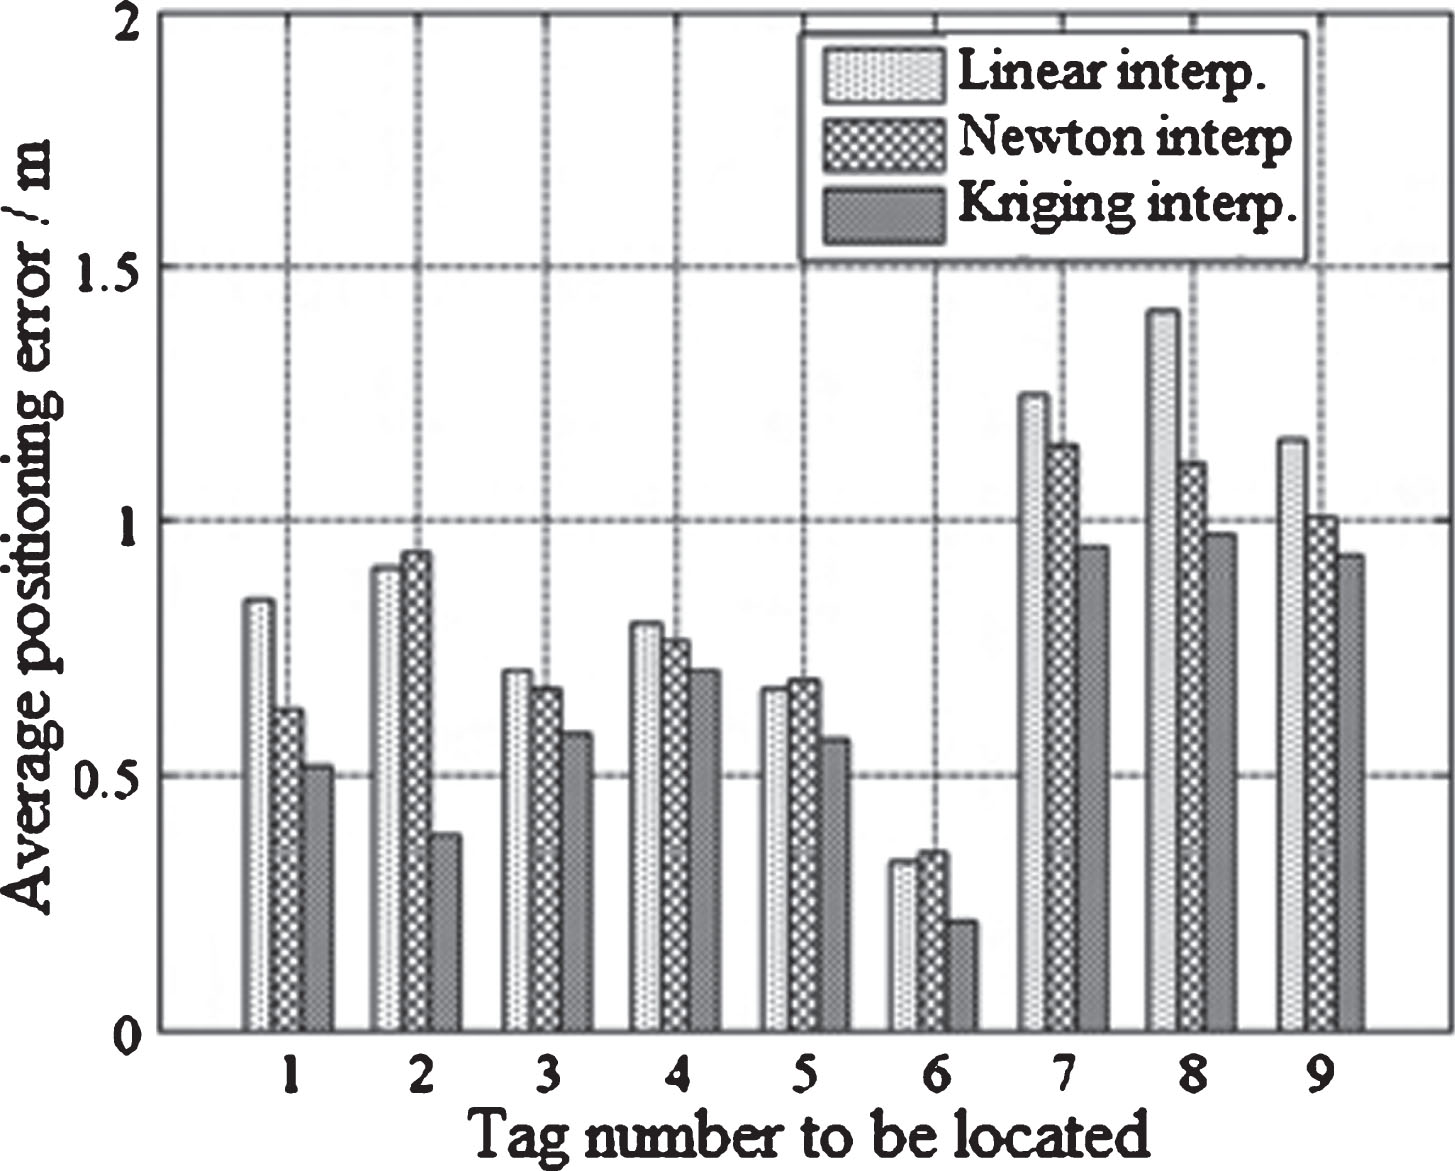
In order to verify the performance of the proposed algorithm, Experiment 3 is designed to test the average positioning error of the Kriging interpolation adaptive VIRE algorithm, the classical VIRE algorithm and the Newton interpolation VIRE algorithm in the same experimental environment. The threshold is experimentally set to 9 in the classic VIRE algorithm and the Newton interpolation VIRE algorithm. In Fig. 4, nine representative positions are marked, and their label error calculation results are shown in Fig. 8.
Positioning error of different positioning algorithms.
It can be seen from Fig. 8 that the average positioning error of the estimated tag is the smallest in the proposed algorithm. For all 50 pending tags, the average positioning error of the VIRE algorithm is 0.8976 m, the average error of the VIRE algorithm is 0.8112 m based on Newton interpolation, and the average positioning error of the adaptive VIRE algorithm is 0.6473 m based on Kriging interpolation, the average positioning error of the adaptive VIRE algorithm is 27.88% and 20.20% lower than the errors of the former two algorithms.
It is tested whether the difference between the two independent sample means can be inferred to the whole, and the t test is performed. The t-test is also known as student’s t-test. The t-test process tests the significance of the difference between the two samples(mean). The t test has a one-sample t test, a paired t test and a two-sample t test. Paired t-test: The following two cases were observed by the paired design method. (a). Two homogenous subjects received two different treatments; (b). The same subject received two different treatments; (c). The same subject Before and after object processing. (d) is choosed here between the Kriging interpolation adaptive VIRE algorithm and the classical VIRE algorithm, or between the Kriging interpolation adaptive VIRE algorithm and the Newton interpolation VIRE algorithm. In the paired design, the difference between each pair of data must obey the normal distribution; if it is a group design, the individuals are independent of each other, and the two sets of data are taken from the normal distribution and satisfy the homogeneity of variance. These preconditions are needed because the t statistic that must be calculated under this premise obeys the t distribution, and the t test is the test method based on the t distribution.
MATLAB command H = ttest(X,Y) is applied in the test. H = ttest(X,Y) performs a paired t-test of the hypothesis that two matched samples, in the vectors X and Y, come from distributions with equal means. The difference X-Y is assumed to come from a normal distribution with unknown variance. X and Y must have the same length. The result of the test is returned in H. H = 0 indicates that the null hypothesis (“mean is zero”) cannot be rejected at the 5% significance level. H = 1 indicates that the null hypothesis can be rejected at the 5% level. X is taken from the positioning error data of the Kriging interpolation adaptive VIRE algorithm, Y is taken from the positioning error data of the classical VIRE algorithm or the Newton interpolation VIRE algorithm. H is equal to 1. This illustrates that there is significant differences between the Kriging interpolation adaptive VIRE algorithm and the classical VIRE algorithm, there is significant differences between the Kriging interpolation adaptive VIRE algorithm and the Newton interpolation VIRE algorithm.
The experimental results are divided according to the proportion of different positioning errors. The cumulative distribution of positioning errors of the three algorithms is shown in Fig. 9. The independent variable is the maximum positioning error limit. The meaning of the dependent variable is the proportion of the number of all test tags in which the positioning error of the pending tag is less than the number of positioning error limits of the corresponding independent variable.
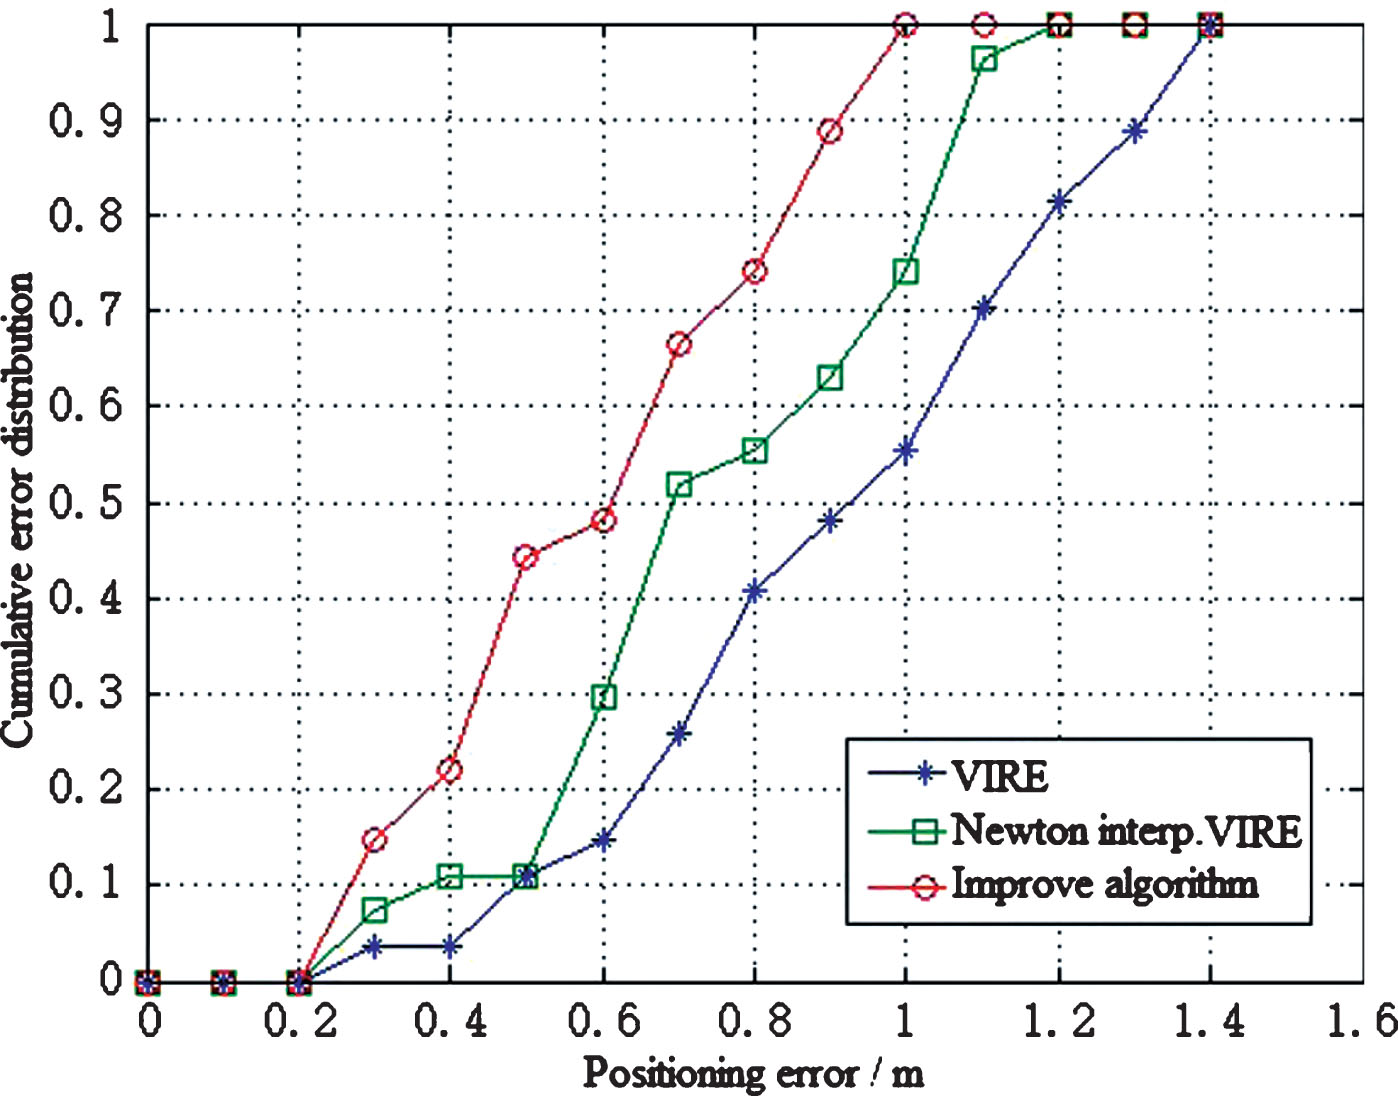
Cumulative distribution of positioning errors of different algorithms.
It can be seen from Fig. 9 that 49% of the experimental results of this algorithm are less than 0.6 m, and the positioning error of all tags is controlled within 1 m. In the improved VIRE algorithm based on Newton’s interpolation method, 30% of the tag positioning error is less than 0.6 m, and the worst positioning error is less than 1.2 m. Only 14% of the tags which are calculated by the classic VIRE algorithm have a positioning error of less than 0.6 m. The difference in positioning error is 1.4 m. It can be seen from the results that our algorithm improves the accuracy and stability of the positioning results.
Using linear interpolation method, VIRE algorithm simply treats the signal strength value and distance of the reference tag as a linear relationship, leading to the inaccuracy of signal strength value for virtual reference tags. The threshold in VIRE algorithm is a fixed value that needs repeatedly adjustment through experiments, which results in the complicated algorithm. To solve these problems, an improved Kriging interpolation adaptive VIRE algorithm is proposed in this paper, including nonlinear interpolation algorithm, dynamic threshold setting and tag self-correction of fuzzy map, which builds an indoor positioning system based on reference tags. The experimental results show that the improved algorithm can improve the positioning accuracy and improve the stability of positioning results under bad environmental conditions without increasing the number of reference tags.
Kriging interpolation method is used based on statistical calculations to estimate virtual tags. In the Kriging interpolation method, the variogram is used as the Gaussian model, it not only considers the relationship between the estimated position data and the known position data, but also the spatial correlation of the variables is considered to more accurately estimate the virtual label data. An adaptive threshold adjustment strategy is also proposed in the algorithm. After the virtual tag is removed, the range of adjacent tags is pre-estimated, the threshold is gradually adjusted to keep the number of adjacent tags in an optimal state, and the interference is more accurately eliminated. Finally, the comparative experiment proves that the proposed Kriging interpolation adaptive VIRE algorithm is more advantageous in this paper.
Based on the VIRE algorithm, an adaptive VIRE algorithm is proposed based on Kriging interpolation. The experimental results show that the Kriging interpolation method is used to calculate the RSSI of virtual reference tags, it is compared with linear interpolation and Newton interpolation. The error is smaller, and the proposed adaptive threshold adjustment strategy approaches the calculation result under the optimal threshold in some extent. The improved algorithm can further improve the positioning accuracy and the stability of the positioning result without increasing the number of reference labels, thereby saving costs.
Footnotes
Acknowledgments
This work was sponsored by the National Natural Science Foundation project (51304076) of China; it is supported by Natural Science Foundation project(14JJ4064) of Hunan Province.