
Abstract
Location-Based Services (LBS) associated with identification technologies are important aspects of smart cities as they provide useful information for planning and for making processes automated, efficient and cost-effective. Indoor environments pose several challenges for existing localization technologies because of their sensitivity to the environment which affects their accuracy and reliability. Low Frequency (LF) Radio-Frequency Identification (RFID) is ideally suited for indoor localization applications since LF magnetic fields are not greatly affected by the environment. The objective of the paper is to present a solution for identification and localization in smart cities based on RFID technology operating at 125 kHz and to compare its performance with Ultra-High Frequency (UHF) RFID systems, widely used for localization applications. In order to demonstrate the localization performance of the proposed system we present test results for an LF-RFID system implemented using Commercial Off-The-Shelf (COTS) components in a challenging indoor environment of area 315 square meters. Proposed LF-RFID system is compared to UHF-RFID technology for localization performance in the same indoor environment. With the proposed system, for 352 position estimations, mean positioning error of 1.58 m is achieved with standard deviation of 0.76 m and for 90% of the cases, positioning error remains below 2.62 m. Based on the performance, possible applications of this technology in smart cities are discussed.
Keywords
Introduction
In order to provide improved services for smart cities, it is necessary to collect information about the state of the environment and activities of the citizens within the city. Location information is an important attribute required to drive many applications and services such as emergency services, asset management, environmental monitoring, industrial sensing and diagnosis, battlefield surveillance, context-aware computing, and more (Liu et al., 2010).
Over past few years, satellite based navigation systems have become integral part of LBSs offered in outdoor environments. Such services are easily implemented in open outdoor spaces, thanks to good signal reception from navigational satellites. However, Global Navigation Satellite System (GNSS) signals are strongly attenuated when penetrating through buildings where the multiple reflections at surfaces cause multi-path fading which is the cause of uncontrollable localization errors (Yanying Gu et al., 2009). LBSs that are intended to work in closed environments (indoors) usually require better accuracy than that offered outdoors by GNSS based positioning, i.e., 5–10 m. Thus, GNSS based localization solutions are not suitable for most indoor LBSs (Romanovas et al., 2013; Brown et al., 2013). Also, factors such as cost, size and power consumption can restrict the use of GNSS based localization solutions when localization of large number of objects is needed (Benbadis et al., 2005).
Many location-based applications within a smart city are required to work indoors. Moreover, most of the asset tracking needs are in closed environments such as warehouses. In order to solve the indoor localization problem, over the years, much effort has been put into designing accurate local positioning systems based on different technologies including, Infrared (IR), ultrasound, RFID, Wireless Local Area Network (WLAN), Bluetooth, Ultra-Wideband (UWB), magnetic fields, computer vision etc. (Gu et al., 2009, Al-Ammar et al., 2014).
Indoor positioning systems based on aforementioned technologies rely on mainly four position estimation techniques: geometric approaches such as triangulation, fingerprinting, proximity and vision analysis (Al-Ammar et al., 2014). Indoor positioning algorithms specify how the position of a target object is calculated. Indoor localization algorithms are generally classified as range-based and range-free localization methods. The ranging methods include Received Signal Strength (RSS) (Wang et al., 2011), Time of Arrival (TOA) (Geng et al., 2013), Time Difference of Arrival (TDOA) (Xu et al., 2011) and Angle of Arrival (AOA) (Zhou et al., 2011). The ranging accuracy affects the localization performance of range-based algorithms. Range-free algorithms, on the other hand, do not estimate distances based on known properties of the signal in order to conduct localization. Fingerprinting is most commonly used range-free technique (Kaemarungsi et al., 2004). Fingerprinting collects radio characteristics of the signal in calibration phase and position is estimated by pattern matching in online phase. Centroid localization (CL) (Bulusu et al., 2000) and DV-Hop localization algorithm (Gao et al., 2010) are other examples of range-free algorithms.
RSS based ranging techniques rely on path loss models which relate the received signal power to the distance. Range estimation using these techniques requires prior knowledge of the path loss models of RF transmitters obtained either empirically or statistically. RSS is widely used as a ranging method for the localization systems based on radio signals, as RSS based localization solutions are relatively cheaper and easier to implement, compared to other localization methods.
IR based localization systems have simple architecture, but they suffer from issues such as security, privacy, interference, failure in Non-Line-of-Sight (NLOS) conditions and low coverage (Gu et al., 2009). Ultrasound based localization system can achieve centimeter level positioning accuracy, but Line-of-Sight (LOS) conditions are required for their operation (Gonzalez et al., 2009). Localization solutions based on WLAN (He et al., 2016) and Bluetooth (Faragher et al., 2014) are more popular because of the existing infrastructure, high security, low cost and low power consumption. However, these systems face difficulties in NLOS and multipath conditions. UWB Positioning using time-based measurements offer very good accuracy (centimeter level) and superior performance in multipath conditions (Ruiz et al., 2017). However, these solutions are usually limited by their cost, complexity and high-power consumption (Song et al., 2011). Computer vision based positioning systems require high computational power and expensive hardware in order to achieve high accuracy (Paton et al., 2017). Among different wireless technologies, RFID is very interesting technology for indoor positioning because of its low operating cost and low power consumption. In order to achieve a high localization accuracy with RFID technology, ways to improve the reliability of RSS in challenging environments, are needed to be studied.
Over recent years, RFID technology has gained popularity in location-based applications such as asset tracking and access control. Traditionally, UHF is used for most location-based implementations of RFID. However, localization in an indoor environment, with UHF radio techniques, faces challenges such as multi-path propagation and shadowing from obstacles affecting the wave propagation (Hui Liu et al., 2007). This is because UHF electromagnetic waves are easily reflected and strongly attenuated by objects present in a typical indoor environment. In addition to the objects present indoors, human body also can be treated as a blockage to direct LOS (Geng et al., 2013) as electromagnetic waves in UHF band are absorbed by the water present inside the human body (Chatterjee et al., 1985; Kuster et al., 1992). Human presence can cause significant deviation in RSS values (Kaemarungsi et al., 2004). Therefore, the Received Signal Strength Indicator (RSSI) of UHF signal in more challenging indoor environments (where the density of obstacles and humans is more) is less accurate and less reliable technique for localization. On the other hand, RFID systems using inductive electromagnetic coupling at LF or High Frequency (HF) do not suffer from multi-paths. LF or HF magnetic fields can penetrate most obstacles with negligible attenuation. This makes magnetic field strength signal more reliable for localization in presence of obstacles. (Christian Metzger et al., 2008) is one of the first papers proposing a distance estimation using HF RFID (13.56 MHz) technology. The assessment of the proposed system was done over a 0.5 m maximal range in LOS condition using a single coil antenna. In order to detect the orientation of the tag a tilt sensor was added to the tag. In (Kenichi Ohara et al., 2011) a range estimation technique was also proposed with an LF-RFID (125 kHz) system using 3 antennas in orthogonal planes thus avoiding the use of a tilt sensor. The evaluation was done in an indoor environment without obstacle between reader and tag and for ranges up to 10 m. Three-Dimensional (3D) underground tracking based on Magneto-Inductive (MI) localization at 125 kHz was proposed in (Markham et al., 2012), where larger transmitter antenna loops of dimensions 15 m×2 m were used to track underground animals moving within 3 m from the transmitter loops, with accuracy below 0.5 m. In this case the UHF transmissions on the tags were handled by a 2.4 GHz ZigBee module. A positioning system based on LF (24.4 kHz) Alternating Current (AC) magnetic fields was proposed in (Pasku et al., 2016), where coverage of 12 m in cluttered indoor and accuracy of 0.3 m was achieved. In this case bigger receiver antenna is used along with an instrumentation amplifier having 12-bit resolution and a costly data acquisition system directly connected to the computer.
The aim of this paper is to present LF-RFID as an identification and localization technology which is accurate, reliable and which is suitable for many location-based services in smart cities. The aim of the experimental work presented in this paper is to examine the localization performance of LF-RFID based Real Time Locating System (RTLS) in an indoor environment with strong NLOS and multipath conditions and human presence. While observing the performance of the proposed system, it is also compared to UHF-RFID for localization performance in exactly same experimental conditions. The results are then analyzed and potential applications of LF-RFID for smart cities are proposed.
The paper is organized as follows: Section 2 explains the principle of operation of LF-RFID. Section 3 describes the technique used for LF-RFID based localization. Section 4 provides information about the experimentation and methodology used. In Section 5 analyses of the results are presented. Section 6 includes discussions on constraints of the presented system and its potential applications. Finally, in Section 7 conclusions are drawn based on the study and possible perspectives are suggested.
Principle of operation of LF-RFID
LF-RFID systems make use of Near-Field Magneto-Inductive Communication (NFMIC). In the near-field, the magnetic field strength decays rapidly as the inverse cube (1/r3) of the distance between the transmitter antenna and the receiver antenna on the tag, as seen from Equation (1), which gives the z component of magnetic field generated by the current loop at any point (Fig. 1), where μ o is magnetic permeability of free space, μ r is the relative magnetic permeability of the medium, I is the current flowing through the coil, r is the radius of the coil, N is number of turns and a is the radius of the current loop.
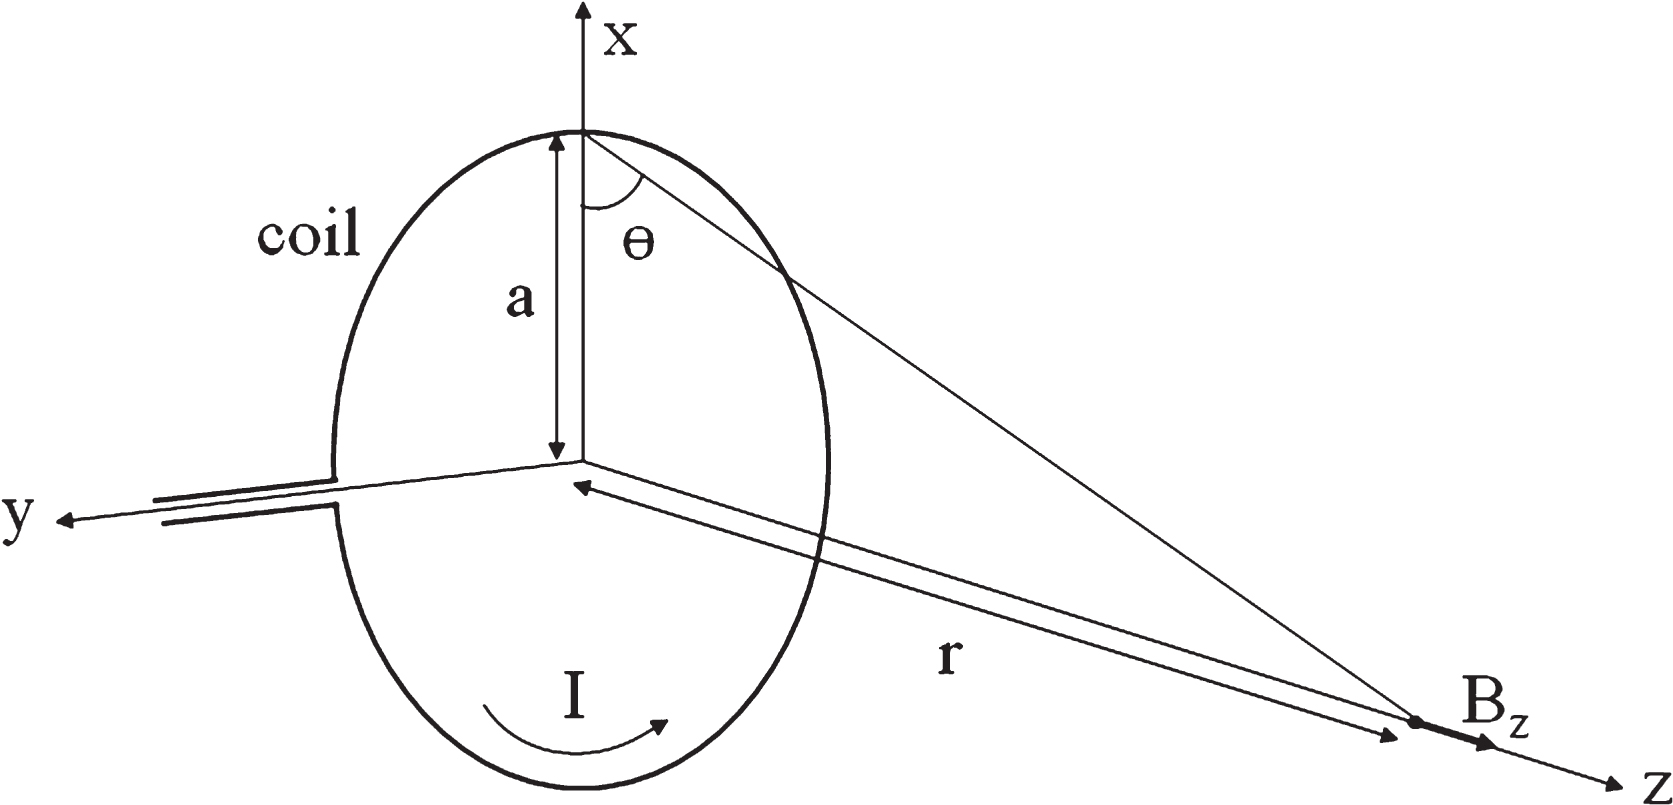
z component of magnetic field generated by a current loop.
In terms of power, the reduction is inversely proportional to 6th power of the distance (60 dB/decade) (Agbinya, 2013). The magnetic field strength is thus high in the immediate vicinity of the transmitting coil, but a very low level exists in the distant field.
The magnetic field energy in the near-field can be acquired through mutual inductive coupling (Fig. 2). In order to efficiently draw energy from the existing magnetic field, principle of resonant inductive coupling is used.
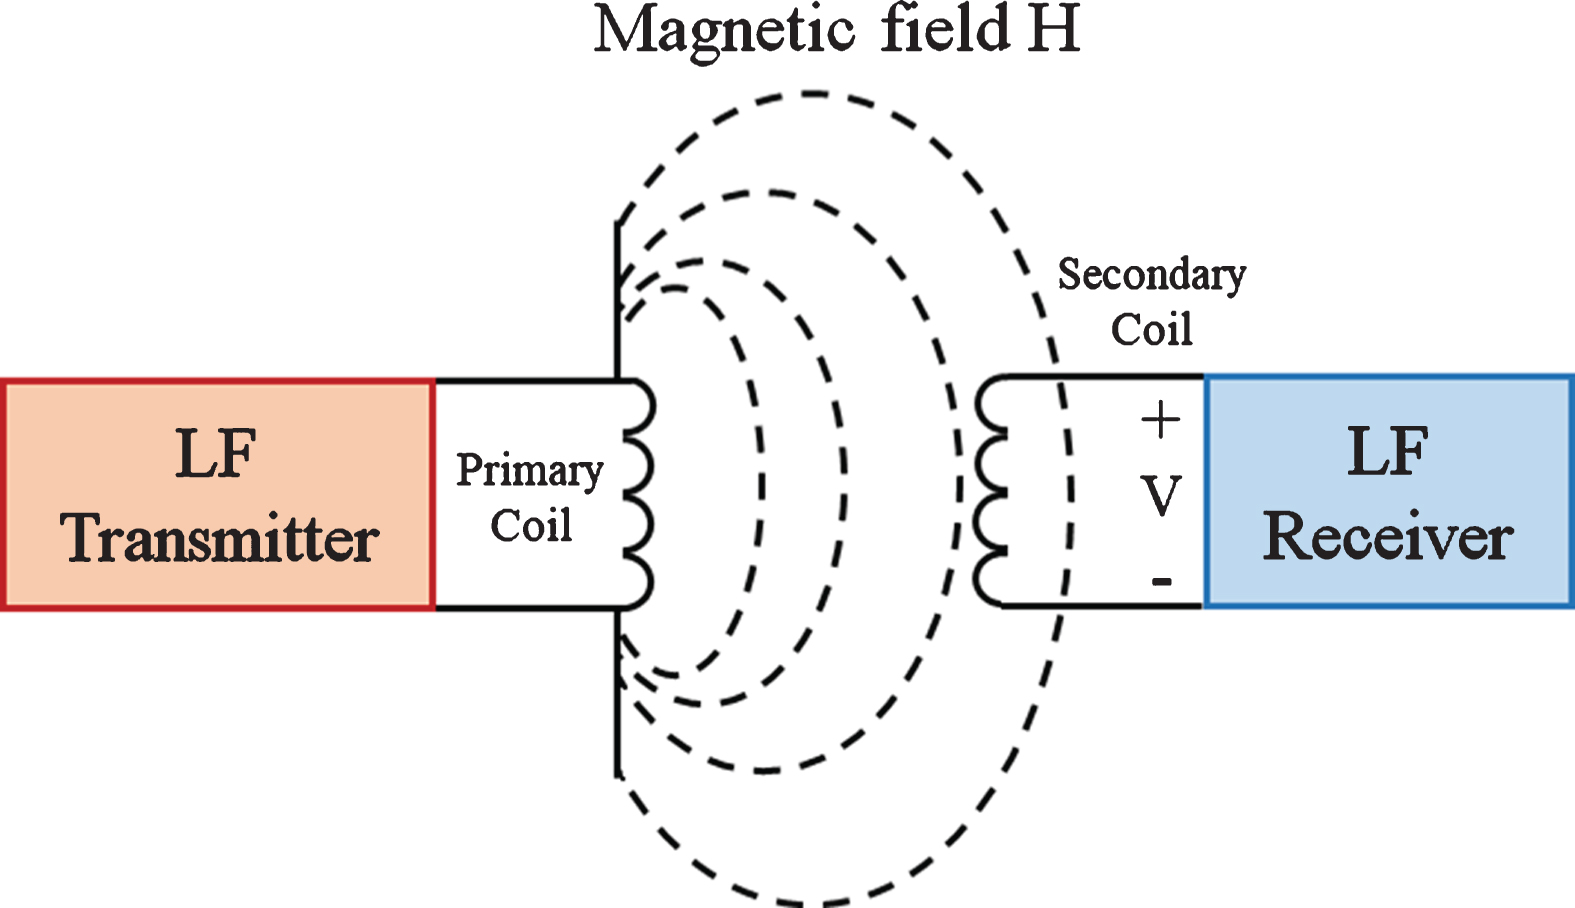
Near-field magneto-inductive coupling.
Within an LF-RFID system, the LF emitter antenna creates a quasi-static magnetic field between itself and the LF receiver antenna present on the LF-RFID tag (Fig. 3). Tuning circuit present on the tag is designed to achieve resonant inductive coupling between the emitter coil and the receiver coil. This induces an electric voltage across the tag’s antenna coil, which is used as a wake-up signal to activate the active RFID tag.
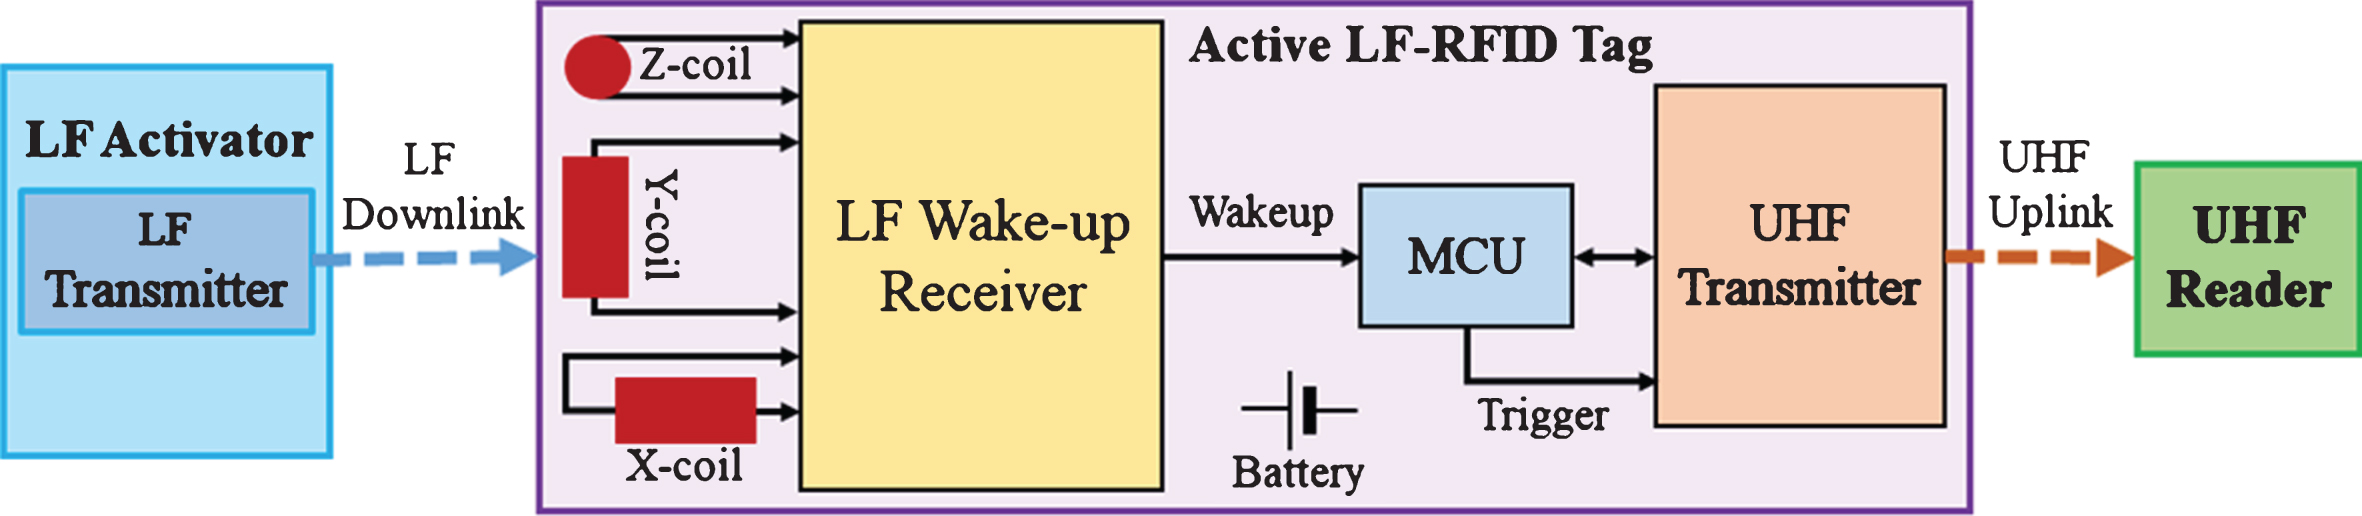
Architecture of an active LF-RFID system.
Figure 3 shows the architecture of an LF-RFID system. The LF transmitter antenna attached to the LF tag-activator generates a quasi-static magnetic field which is amplitude modulated using Amplitude Shift Keying (ASK). This ASK signal is broadcasted periodically by the activator (LF downlink). LF wake-up receiver, AS3933 (Austriamicrosystems, 2015), present on the LF-RFID tag receives this broadcasted LF signal with the help of three receiver coils aligned along three perpendicular axes (3-axes antenna). Upon each reception, the LF wake-up receiver which is in active state all the time, wakes up the system and triggers an UHF transmission through the UHF transmitter on the tag (UHF uplink). This operation is referred as tag-activation. The range, within which the tag-activation is possible, is called as the tag-activation range. Tag-activation occurs only when the voltage induced across the receiver antenna due to the resonant inductive coupling is strong enough to generate a wake-up signal. Thus, the tag-activation range of an LF-RFID system depends on the amount of coupling between the transmitter and receiver antenna and the sensitivity of the wake-up receiver.
Upon activation, the UHF transmitter transmits the identity of the tag to the UHF reader along with the 5-bit LF-RSSI and the identity of the activator by which it has been activated.
In order to keep the wake-up receiver operational all the time, very low amount of energy is required. Also, the UHF radio is only functional whenever there is an activation by an LF transmitter. Thus, this architecture helps to greatly reduce the power consumption of the LF-RFID tag.
LF-RSSI transmitted by LF-RFID tag corresponds to the strength of the magnetic field. On the LF wake-up receiver, AS3933, each of the three channels corresponding to the three coils of receiver antenna has a Variable Gain Amplifier (VGA) with Automatic Gain Control (AGC). Voltage induced in each of the receiver coil, due to the magnetic field generated by the transmitter, is applied to VGA. The LF-RSSI represents how strong this input signal (voltage induced due to the magnetic field across the receiver antenna) is. The receiver evaluates which channel has the highest induced voltage and generates 5-bit RSSI value (0 to 31). This LF-RSSI value, expressed in dB, is the inverse representation of the gain of the VGA at the selected receiver channel on the tag. If the input signal to the VGA is very strong the AGC will reduce the gain of the VGA. The gain reduction will correspond to a big RSSI, as it is the inverse of the gain setting of the VGA (small gain corresponds to a big RSSI and vice versa). At the beginning the gain in the VGA is set to maximum and the AGC reduce it according to the received signal input level. The AGC needs maximum 35 carrier periods to settle, getting a stable RSSI.
Figure 4 shows the relationship between measured LF-RSSI value and the distance of the LF-RFID tag from the activator antenna. LF-RSSI values are measured on a straight line at measurement points separated by 0.5 m in an indoor environment. In close proximity of the activator, the LF-RSSI value detected is 31 and it decreases logarithmically as the distance between the tag and the activator is increased. Figure 5(a) compares the LF-RSSI variation in outdoor field and indoor NLOS field as well as the effect of human body on LF-RSSI in both kinds of environments. In order to observe the effect of human body the LF-RFID tag is mounted on the human body as shown in Fig. 5(b). It can be seen that the impact of the environment and the presence of human body is very low on LF-RSSI.
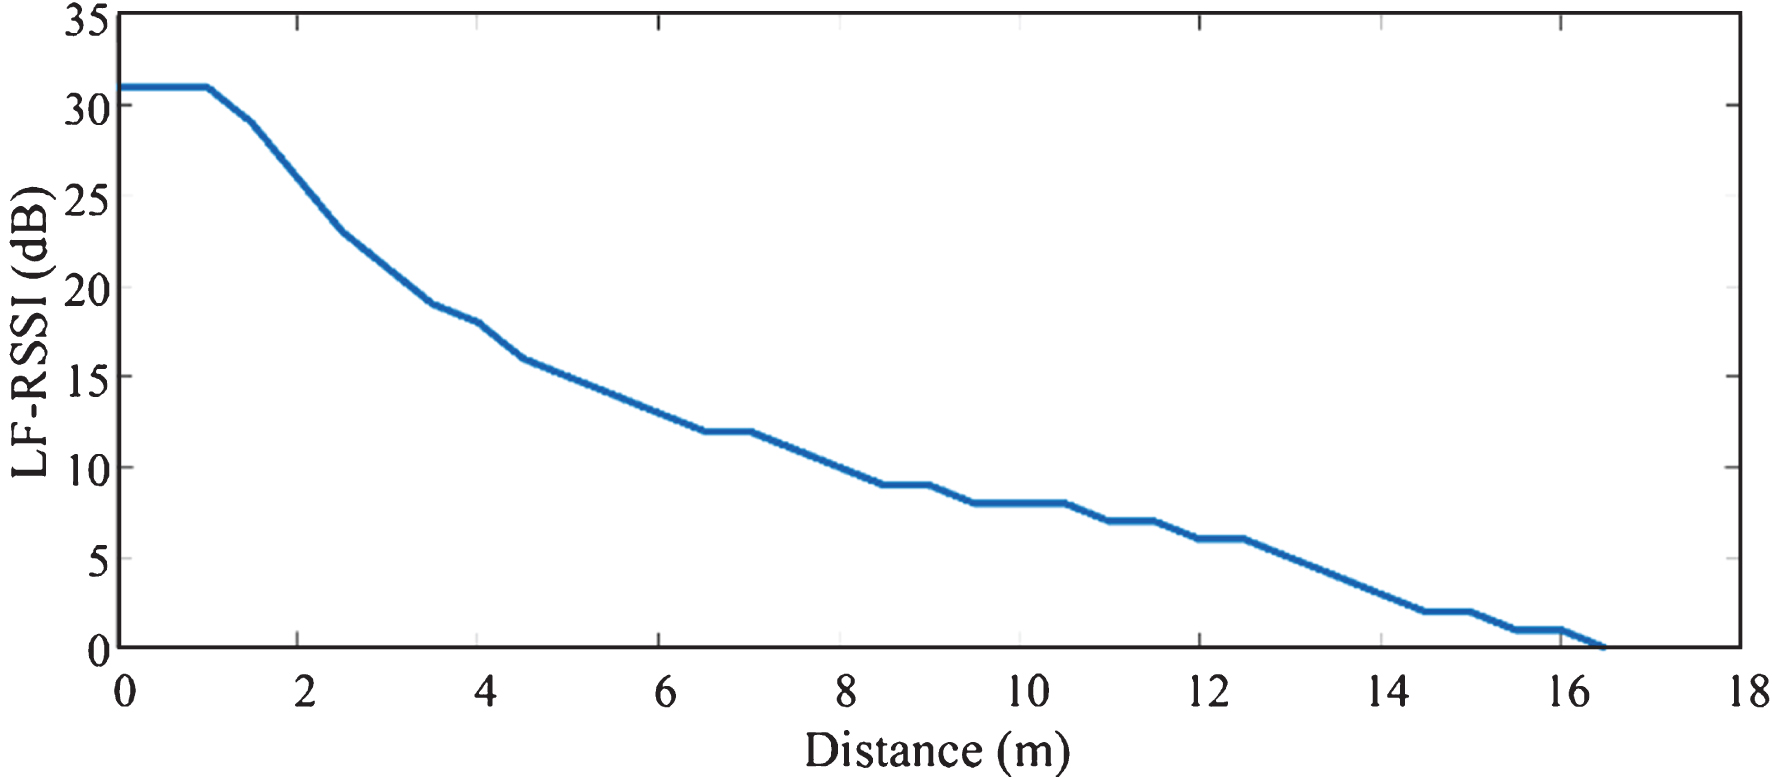
LF-RSSI versus distance of the LF-RFID tag from the activator.
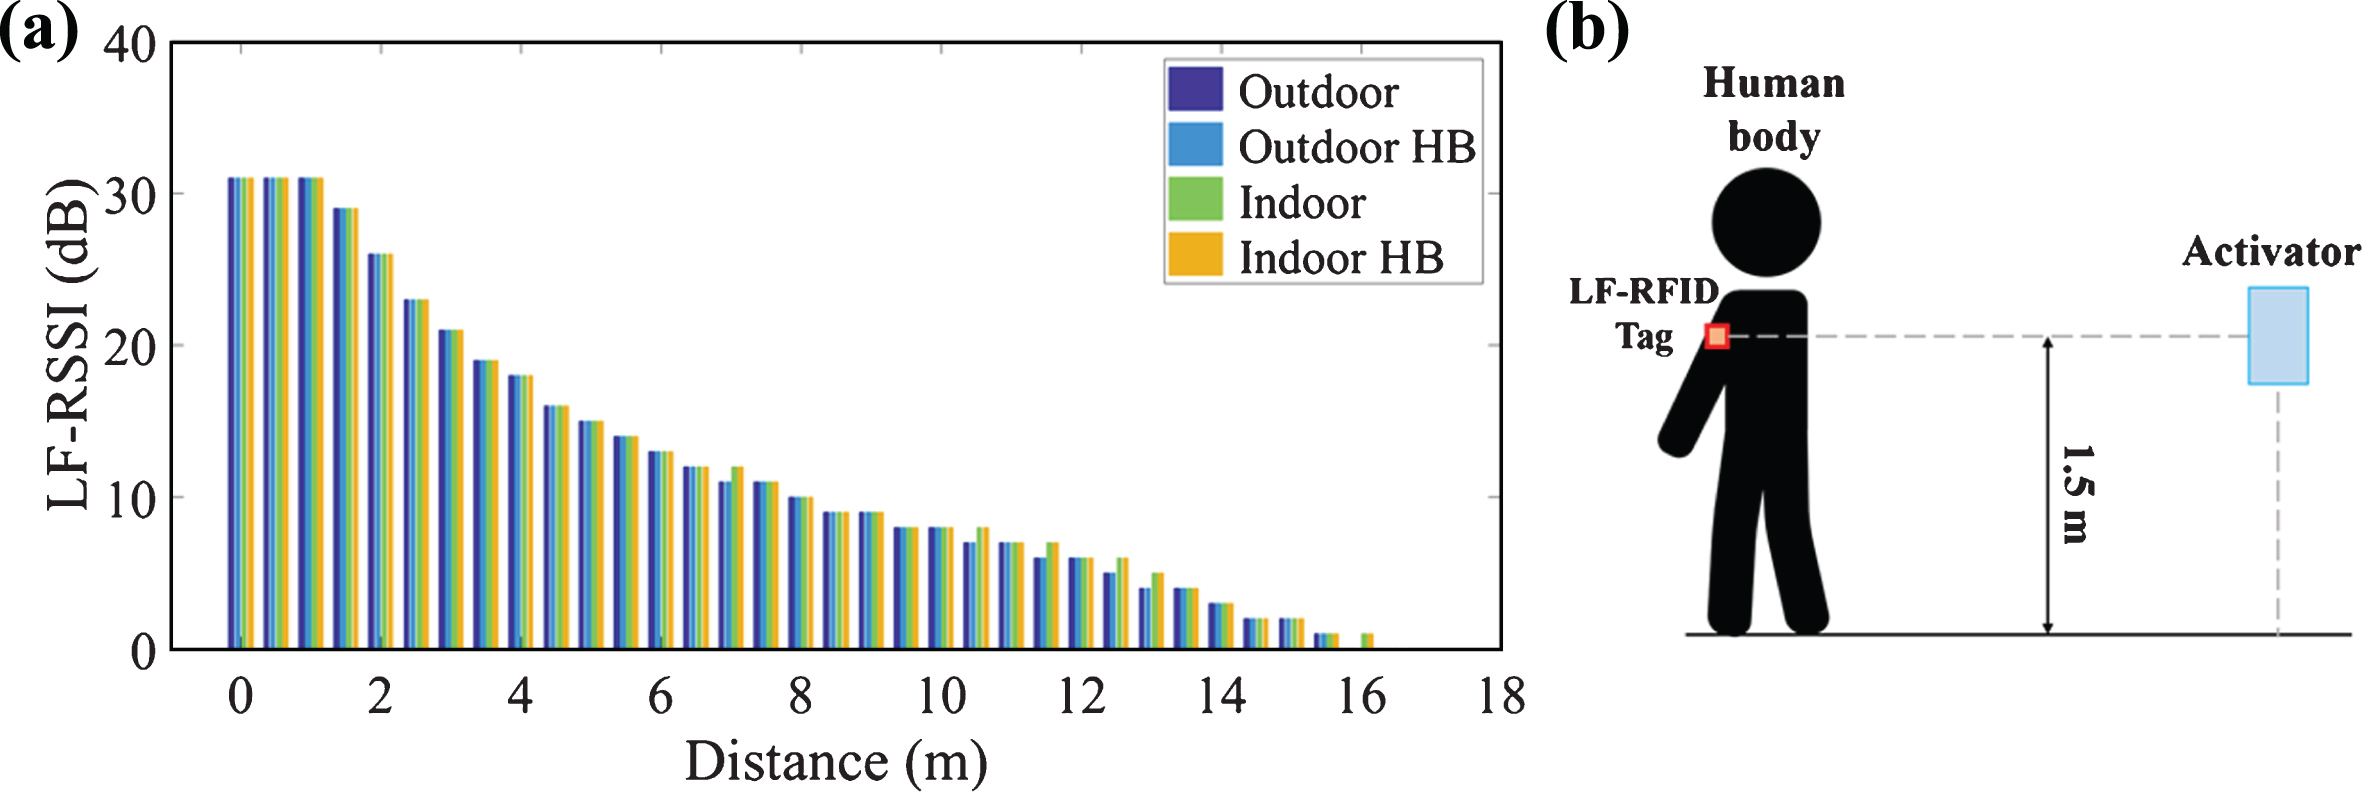
(a) Comparison of LF-RSSI versus distance in outdoor environment, and indoor environment. ‘Outdoor/Indoor HB’ indicates that the tag is mounted on human body. (b) Measurement setup when LF-RFID tag is mounted on human body.
Distance estimation
LF-RSSI captured from the LF-RFID tag can be used to estimate the distance between the tag and the activator. Attenuation model of the LF transmitter antenna relates the magnetic field strength present at the tag to the distance between the LF transmitter and the tag. In order to find the attenuation models for each activator antenna, variation in LF-RSSI value over the distance from the activator is measured for few predefined positions (calibration phase) in the environment. Least-squares fitting technique is used on these measurements to find the mathematical relationship between LF-RSSI and the distance. These attenuation models are then used to perform distance estimations during the localization phase. This technique of relating RSSI to the distance requires significantly lesser memory and training time as compared to fingerprinting.
Weighted centroid algorithm based on estimated distance
Weighted Centroid Localization (WCL) approach is an improvement to the classic CL technique which uses a Link Quality Indicator (LQI) to get a more precise location information (Blumenthal et al., 2005). WCL is very efficient and less complex localization technique which is less sensitive to errors in range estimation compared to triangulation techniques (Fink et al., 2011). The steps involved in WCL calculations are shown in Fig. 6. In order to localize the jth tag T j (Fig. 7), range information from several activators are used. Estimated distance d ij between the ith activator A i (Fig. 7) and the tag T j is used to form weight w i which determines the impact of that activator on final estimated position. The weight w i for the the ith activator can be calculated using Equation 2, where g is weighting degree which depends on the arrangement of the activators. Weighting degree greater than one assigns greater weights to the activators which are closer to the tag. Determination of degree g is done using the measurements from the calibration phase. The attenuation models obtained after calibration are used to perform localization simulation of each calibrated positions for different values of g. The value of g for which the mean positioning error is minimum, is chosen as the optimum weighting degree which is used in the localization phase.
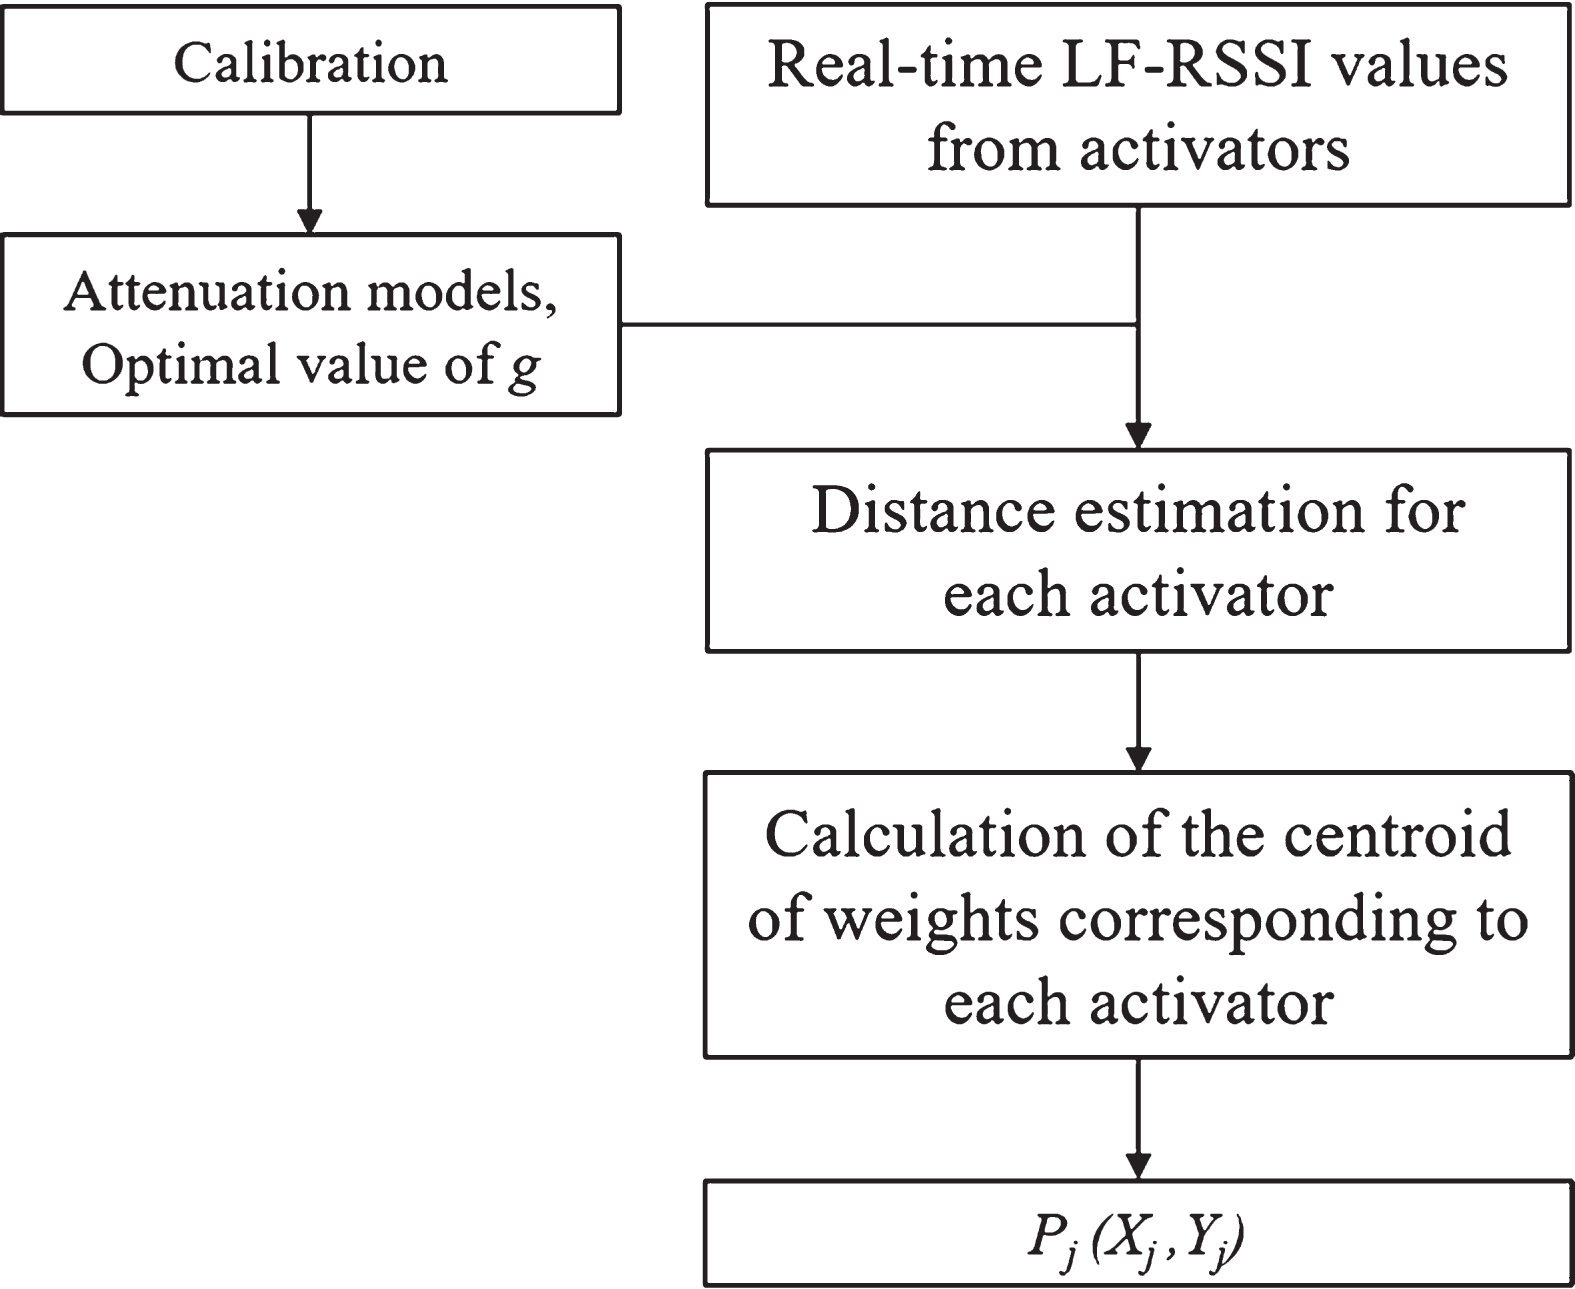
Steps involved in WCL algorithm for LF-RFID system.
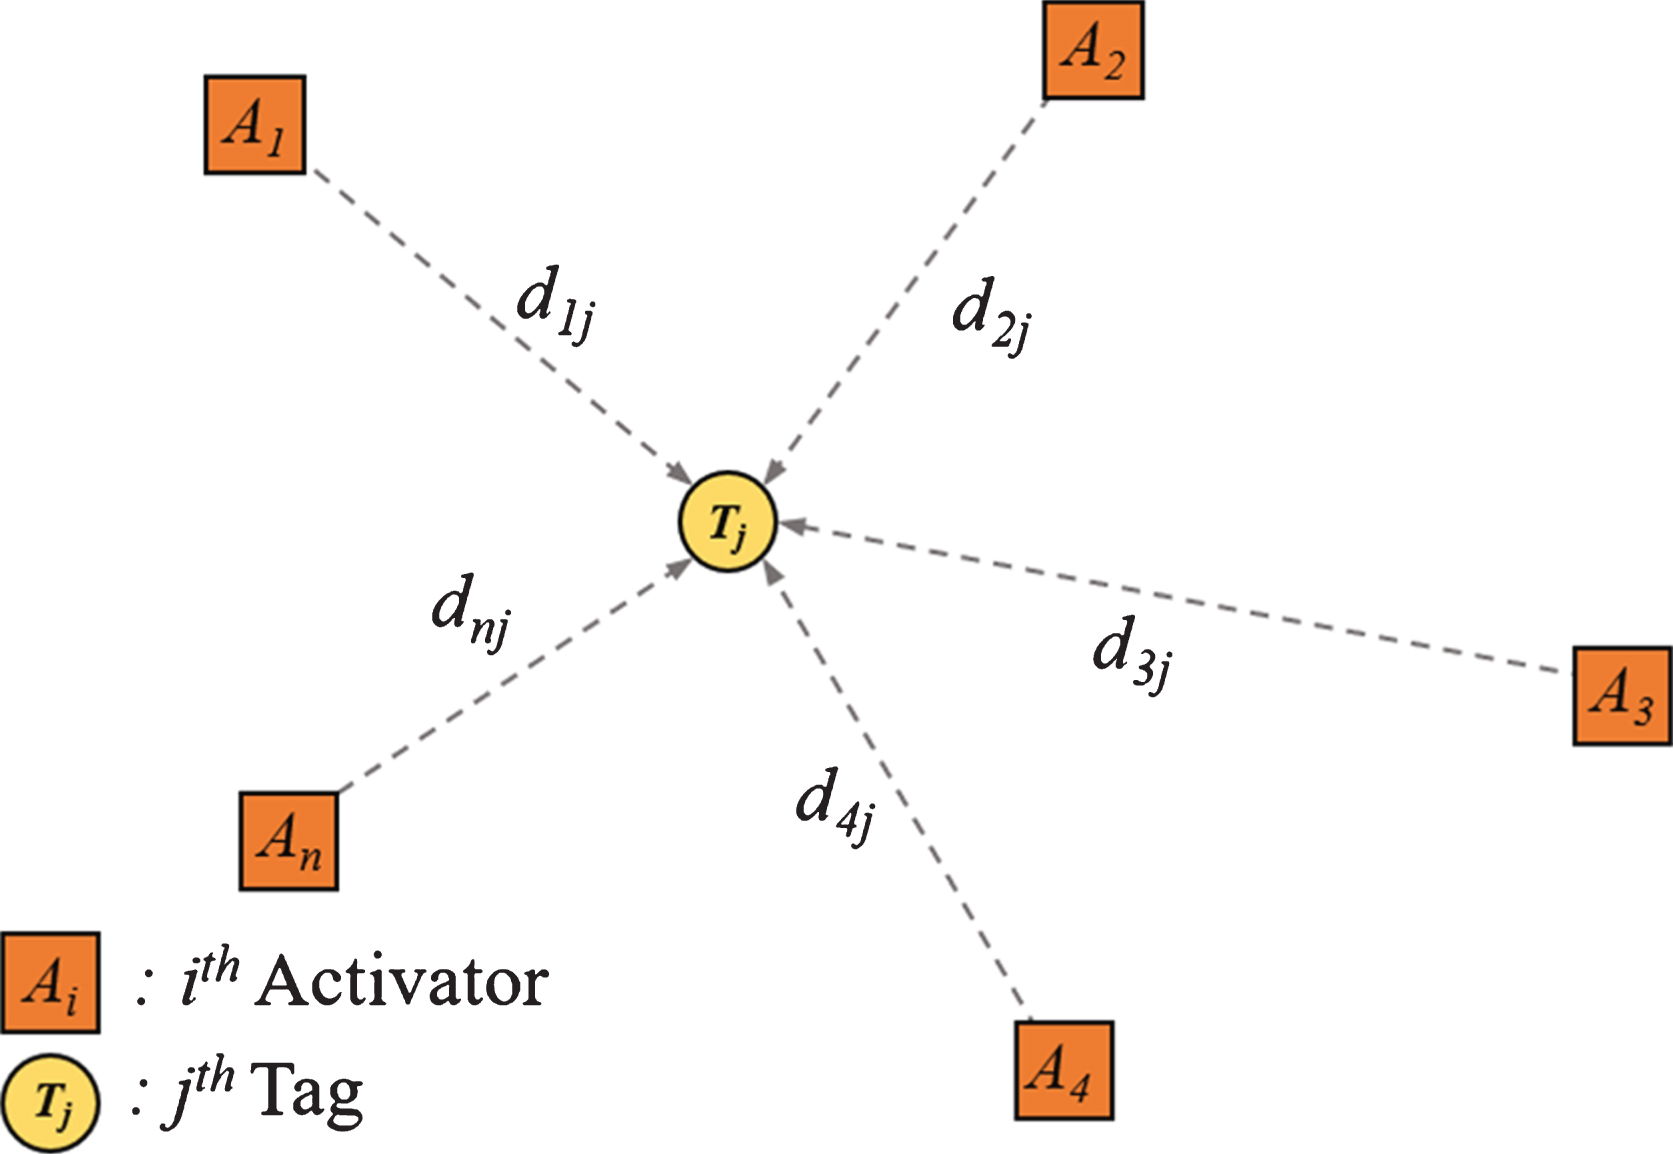
Schematics of WCL algorithm.
In Two-Dimensional (2D) Cartesian co-ordinate system, let the location of the
ith activator be denoted by
(x
i
,
y
i
) and the number of
activators contributing to localization be n, then the
estimated position (X
j
,
Y
j
) of jth tag
T
j
, using this algorithm is
given by Equation 3.
Environment
2D localization tests were performed in an environment with strong NLOS conditions, human presence and multiple metallic and non-metallic obstacles. Entire first floor of ELA Innovation building (ELA Innovation, n.d.) with total surface area of around 315 square meters is used as the test environment. This environment consists of multiple rooms separated by inner walls, metallic window frames, outer walls containing steel bars and heavy metallic rods present inside the floor as well as ceiling. Depending on the usage, this environment can be divided into different environment types such as office environment, storeroom and workshop as shown in Fig. 8. Within the area referred as office environment #1, there is less density of humans, computers, electrical equipment and other metallic objects. In office environment #2, there are computers, screens and other electronic equipment along with the humans in higher density. In this part of the environment, the number of metallic objects is more than that observed in a typical office environment. In case of the storeroom with surface area of around 25 square meters, there are several metallic racks used to keep inventory including electronic raw materials and different RFID products such as tags, readers, antennas etc. The density of metal present is very high in this part. In the workshop environments, there are metallic machines and tools present.
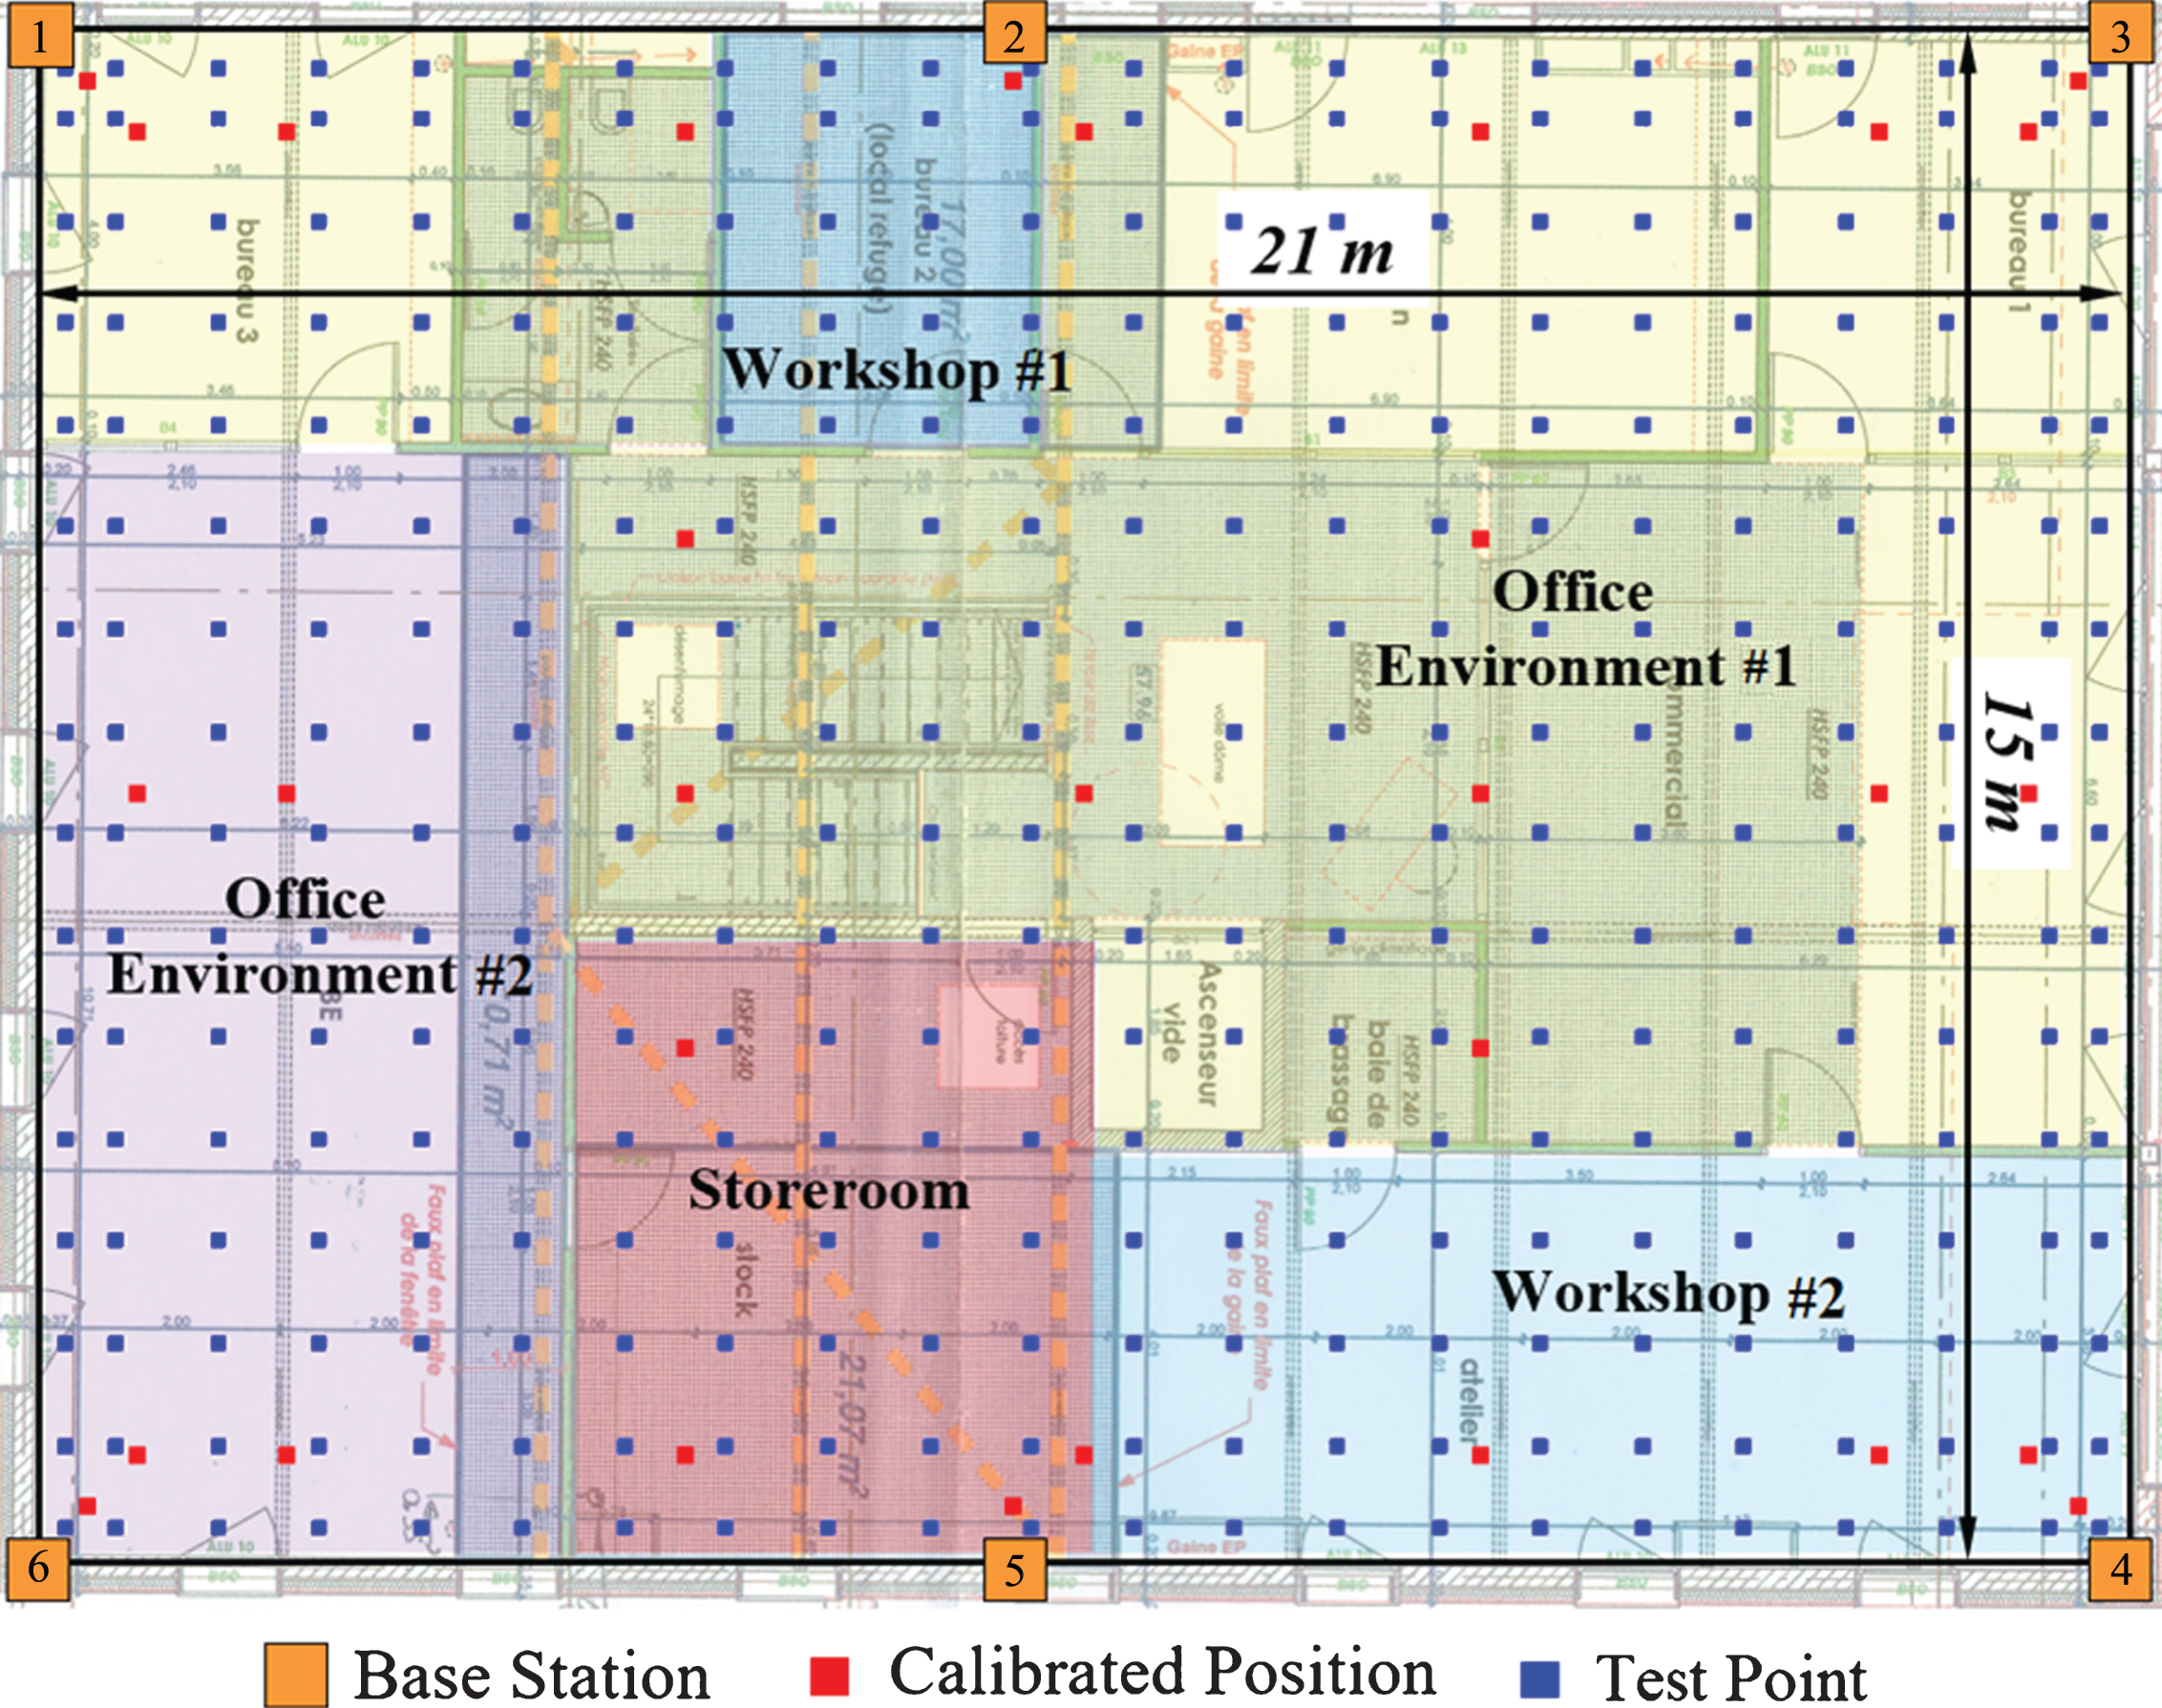
Experimental area showing different environments and positions of base stations for experiment #1 and experiment #2.
Two different systems are used in order to evaluate and compare the performance of LF RFID localization technology with that of UHF RFID technology. The 2D localization tests performed with LF RFID system and UHF RFID system are referred as ‘experiment #1’ and ‘experiment #2’ respectively. The equipment used for both experiments is made available by ELA Innovation (ELA Innovation, n.d.).
Six LF tag-activators (Fig. 9a), each consisting of a printed loop antenna of size 25 cm×55 cm (Fig. 9c), are used to generate quasi-static magnetic field at 125 kHz in the case of experiment #1. Whenever the LF-RFID tag (Fig. 9b) is activated by the activator, it transmits the LF-RSSI, the identity of that activator and its own identity to the UHF-RFID reader over 433 MHz frequency band.
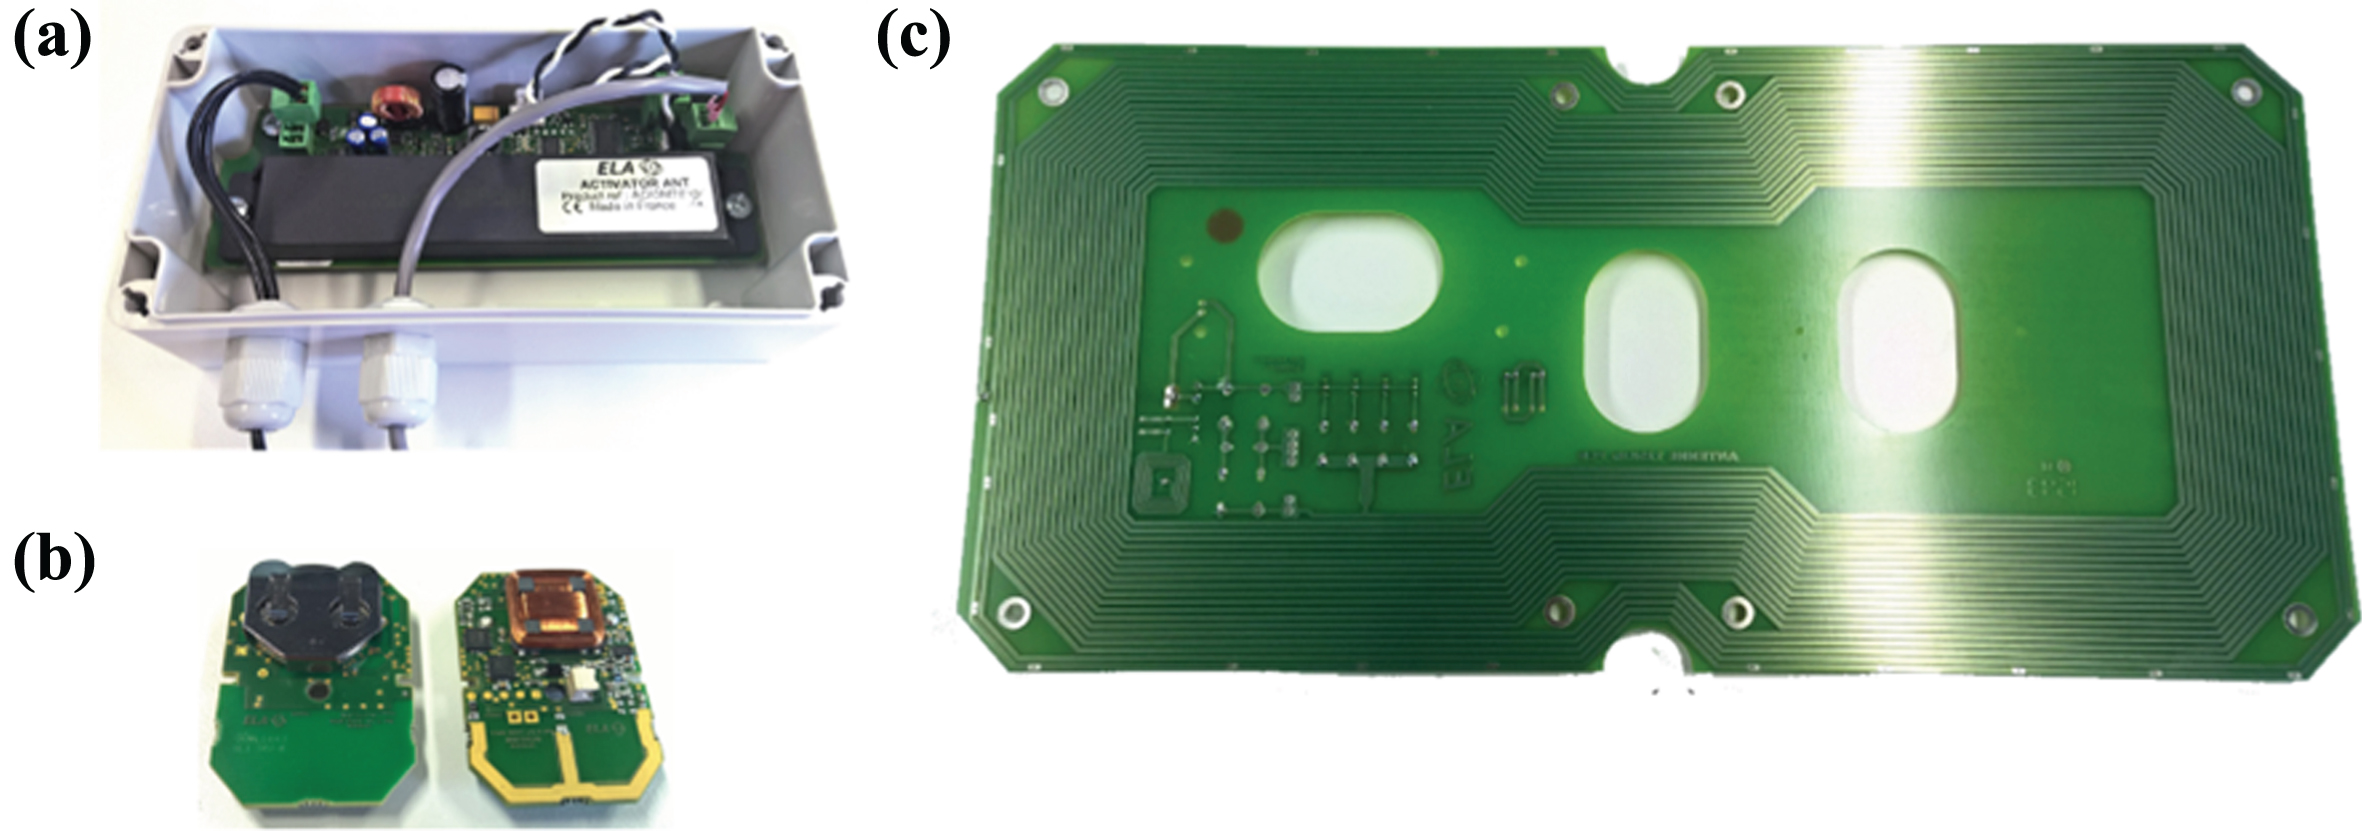
(a) LF Activator, (b) LF-RFID Tag, (c) Transmitter antenna.
For localization based on UHF, six UHF-RFID readers (Fig. 10a) and an active UHF-RFID tag (Fig. 10b) operating at 433 MHz band are used. UHF-RSSI value in experiment #2 corresponds to the strength of the signal transmitted by the active UHF tag at the respective reader. UHF RSSI values are converted to dBm for better representation of power.
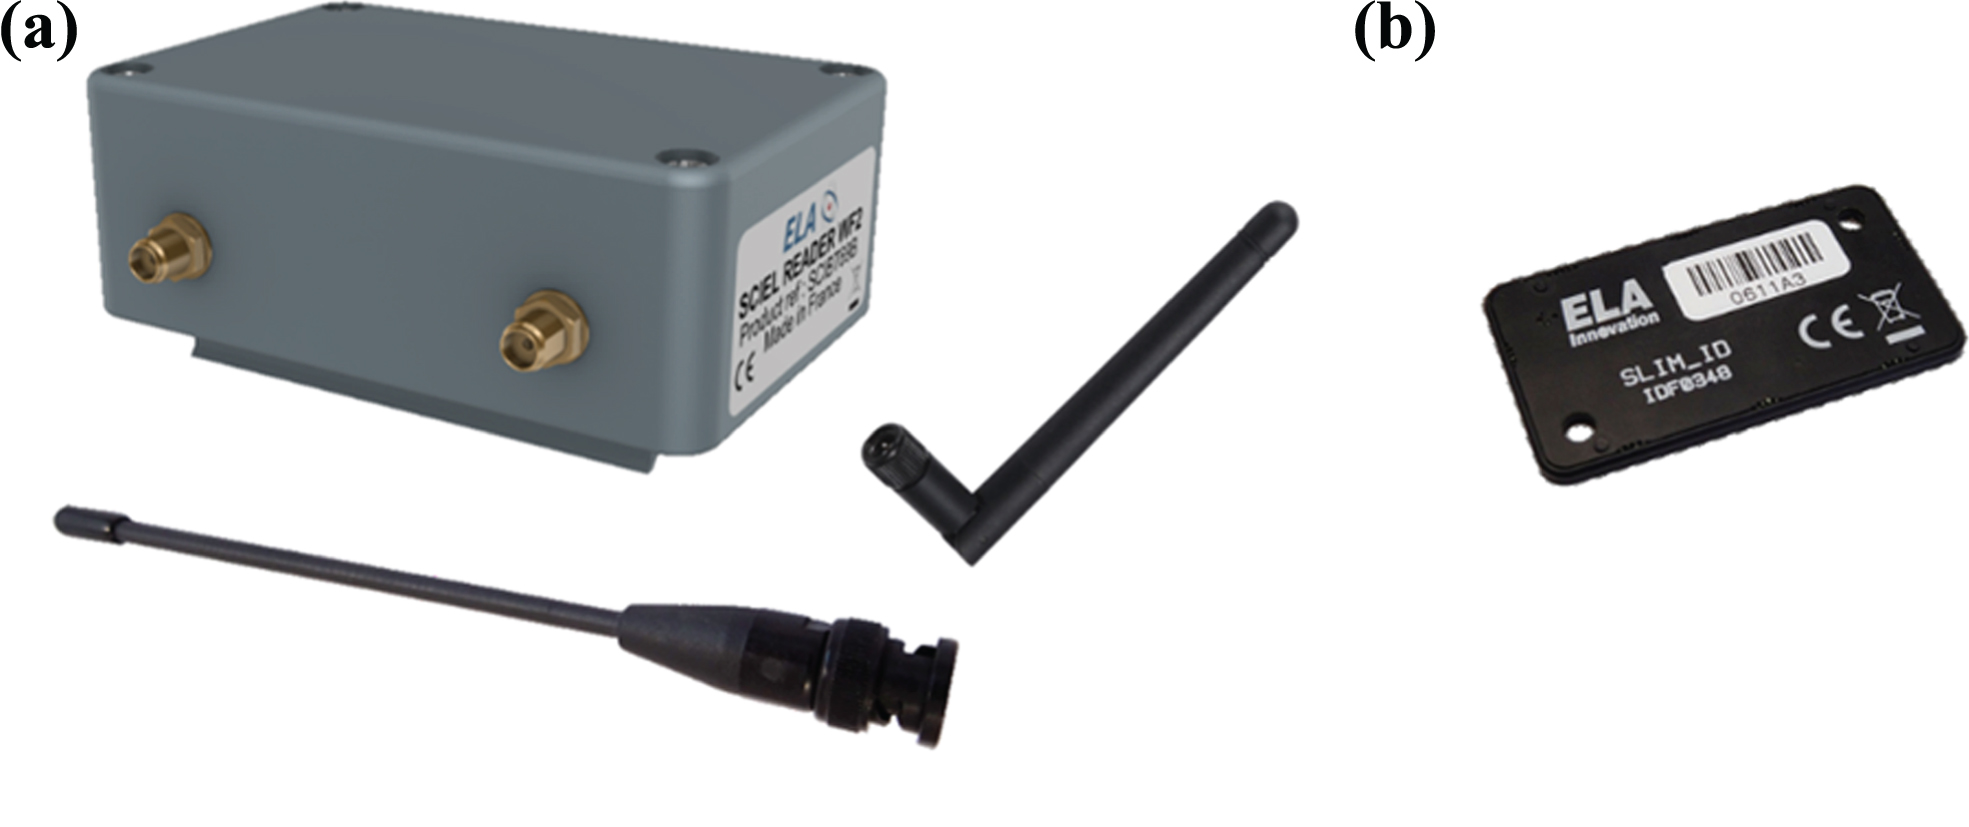
(a) UHF-RFID reader with UHF antenna and WLAN antenna, (b) UHF-RFID tag.
In both the experiments, information necessary for localization (e.g. RSSI, tag ID, base station IDs etc.) is collected by the UHF readers and transferred to a computer over the internet and further processing is done in real time.
The setup for LF-RFID localization system consists of six activators with their LF transmitter antennas installed on the wall with metallic construction. The positions of the activators are at the orange markers shown in Fig. 8 and they are given the numbers as shown in the figure. Height of the antennas from the floor is kept 1.5 m so that the antennas are on the vertical center of the walls. The installation of the activators in the case of experiment #1 is made while keeping in mind the tag-activation range of the activators which is approximately 16 m. With the arrangement of the activators in experiment 1, it is ensured that the tag will always be within the tag-activation range of at least 4 activators, which is sufficient for localization calculations.
During experiment #1 all six activators are turned on simultaneously. Each activator is set to transmit the LF pattern at every 200 milliseconds. LF-RSSI measurements during the calibration phase are recorded.
During the calibration phase, LF-RSSI measurements are recorded at 31 calibrated points (Fig. 8) while the LF-RFID tag is placed 1.5 m above from the floor with the help of a cardboard stand. Based on these measurements, mathematical expression for the attenuation model of each activator is obtained. Coefficients for third degree polynomials which relate the distance to LF-RSSI for each activator are calculated using least-squares fitting. Figure 11 shows the calculated attenuation model for activator 5.
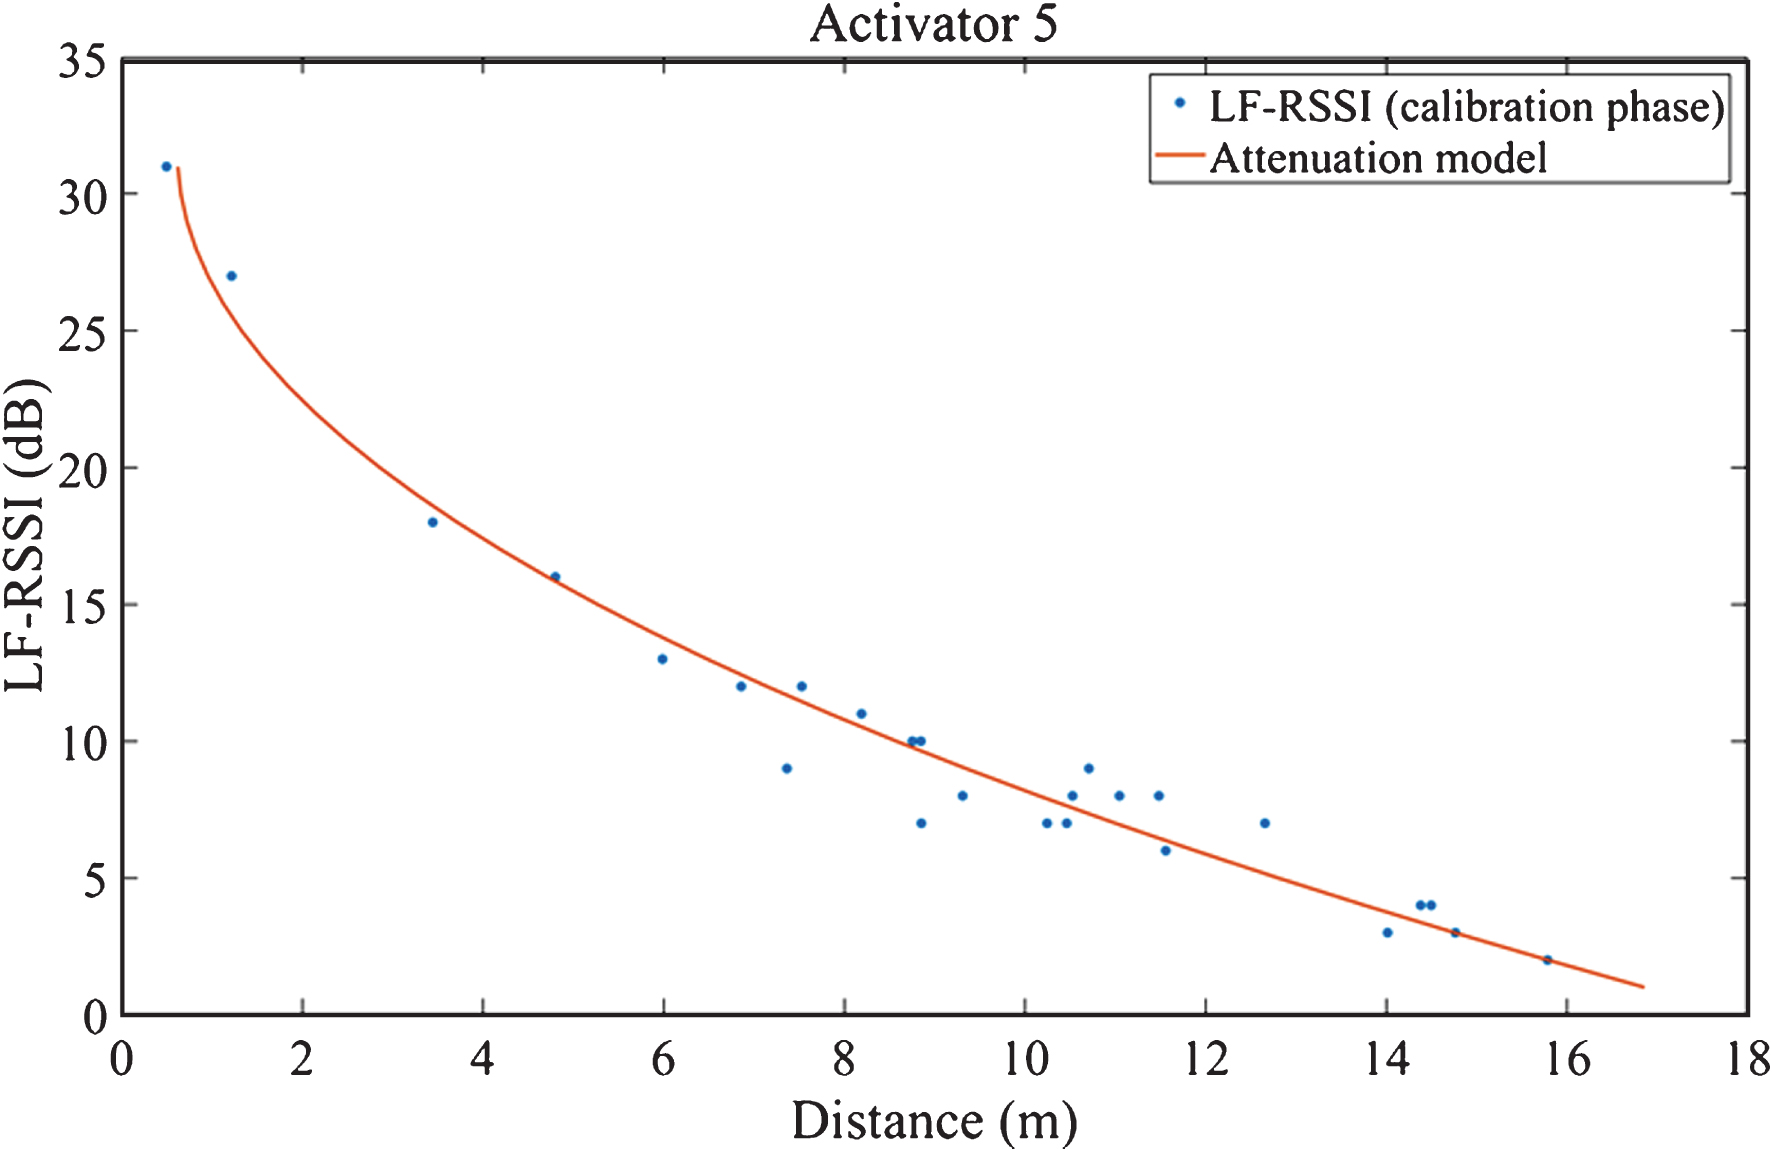
LF-RSSI values measured during calibration phase for activator 5 and attenuation model obtained by least-squares fitting technique.
The measurements recorded during calibration phase are also used to calculate the optimum weighting degree. Figure 12 shows the simulation results of localization of all calibrated points. In this figure mean positioning error is compared for different values of g varying from 1 to 5 by steps of 0.1. For LF-RFID system the mean positioning error (for calibrated points) is minimum when the value of g is 2.2, which is used as the optimum weighting degree in the localization phase of experiment #1.
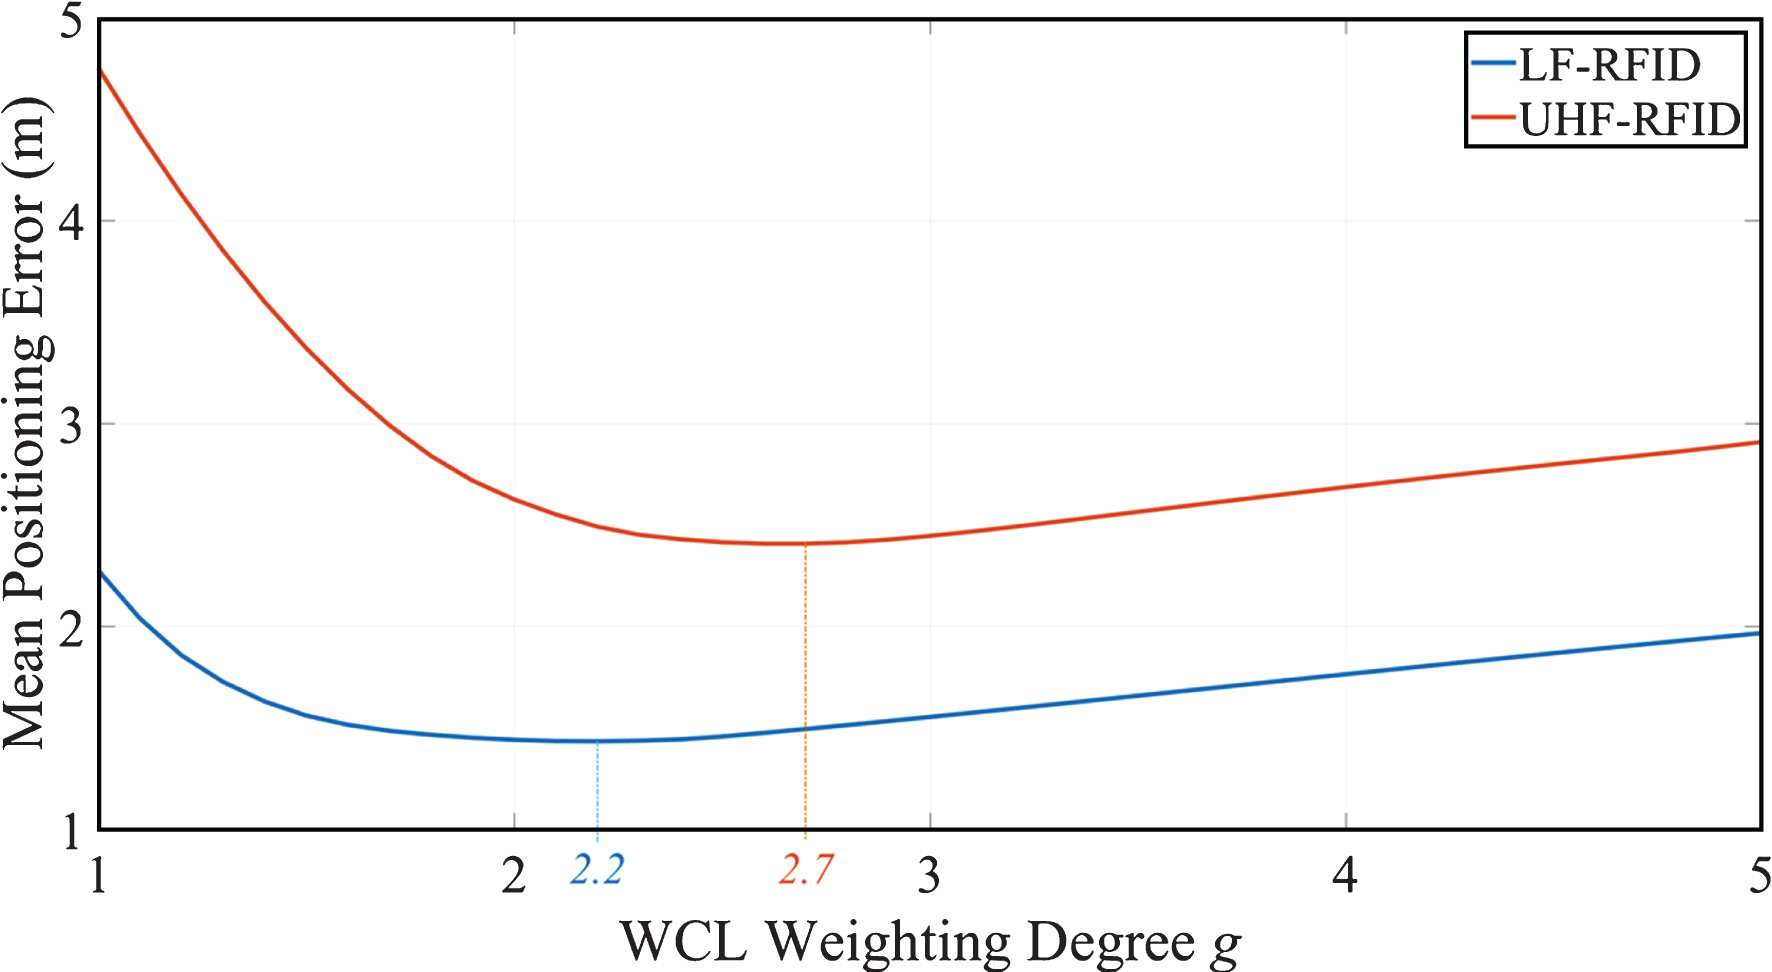
Simulations for calculating optimum value of WCL weighting degree.
During the localization phase, 2D real-time localization tests are performed at 352 different test points within the experimental area as shown in Fig. 8 while the LF-RFID tag is placed 1.5 m above from the floor with the help of a cardboard stand, at each test point. The localization calculations are based on the real-time LF-RSSI values (without any averaging) captured by the LF-RFID tag.
In experiment #2, similar to the experiment #1, 2D localization tests at exactly same 352 points are performed for the UHF-RFID localization system. The system consists of six UHF readers with their 1/4 wave transmitter antennas installed exactly at the same places as the activators in case of the experiment #1. The height of the UHF readers and active UHF tag is 1.5 m from the ground and the measurement procedure is exactly the same as the experiment #1. The coverage offered by the UHF system is superior compared to the LF-RFID system and the entire experimental area can be covered by only four UHF readers installed at four corners of the experimental area. However, in order to compare the system with equal number of base stations, six UHF readers are used. Result for UHF-RFID system with only four activators in the corners are also presented for comparison.
Calibration measurements, calculation of attenuation models and calculation of optimum weighting degree, are performed using similar procedures described for experiment #1. The value of optimum weighting degree obtained for experiment #2 is 2.7 (Fig. 12).
Localization is performed using WCL algorithm based on estimated distance in case of both the experiments while distance estimation is performed using similar method.
Performance evaluation
Figure 13 shows the distribution maps of LF-RSSI values captured by the LF-RFID tag over the entire experimental area during experiment #1 for each activator. The magnitude of LF-RSSI value at each test point is displayed as recorded during the experiment #1. Different attenuation patterns are observed for the activators based on their placement in the experimental area. LF-RSSI decreases more rapidly for the activators installed in the corners compared to activator 2 and activator 5 which are installed on the flat walls. As the outer walls contain steel which is ferromagnetic, the tag activation range of the activators installed in the corners may be affected by the impact on resonant coupling. Table 1 provides the details about the distance estimation performances of all six activators in the LF-RFID system. The performances of activator 2 and activator 5 are considerably better compared to the activators installed in the corners.
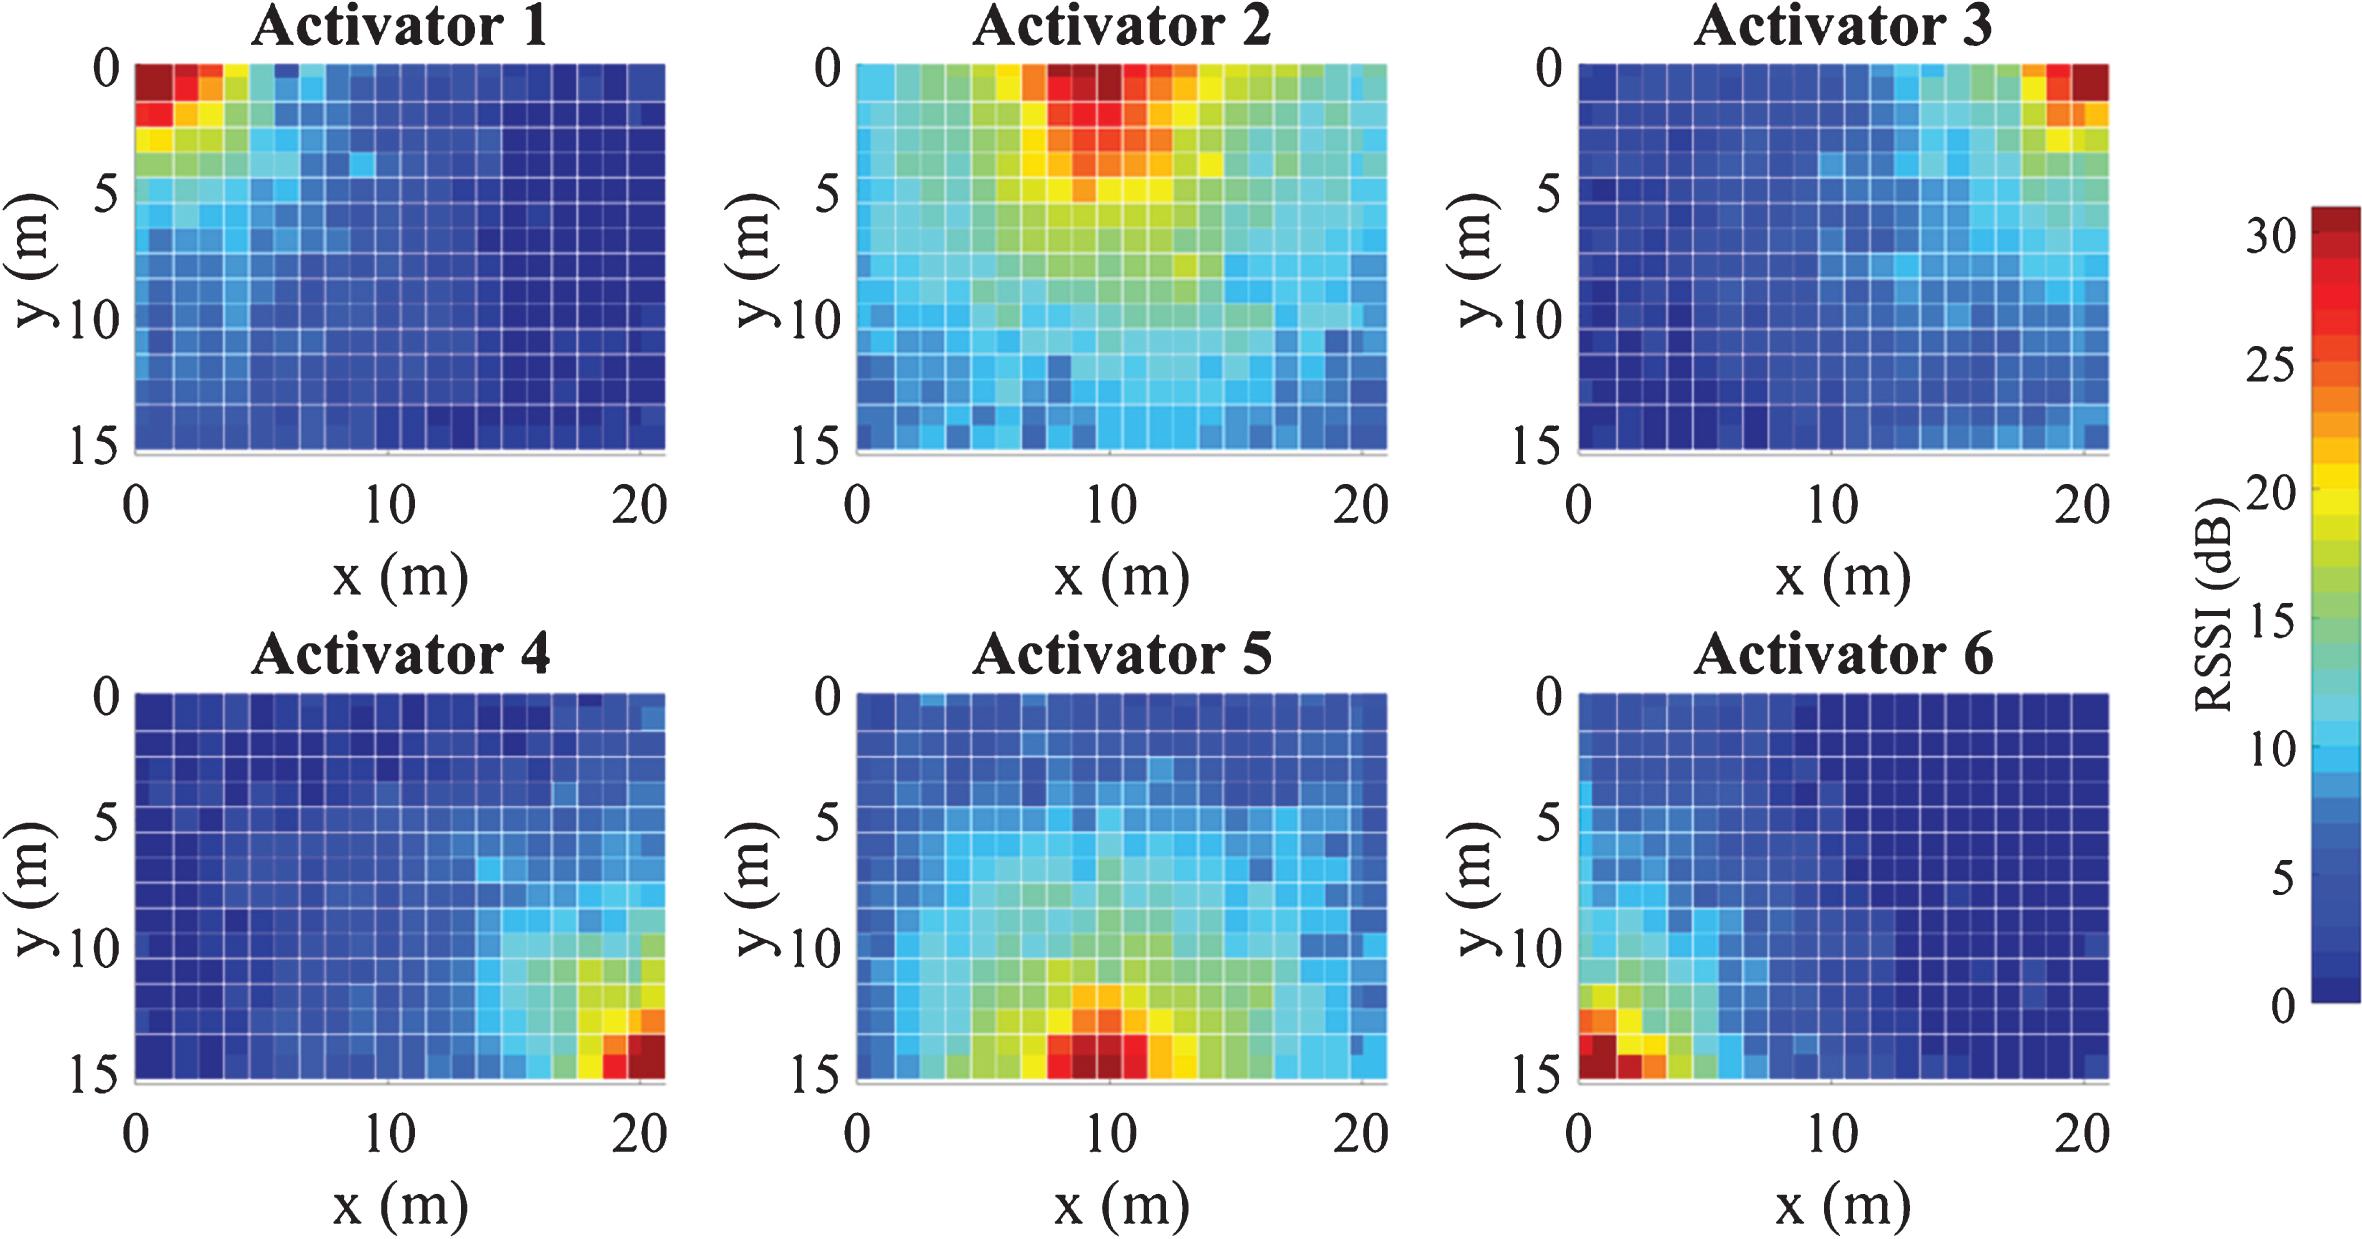
LF-RSSI distribution maps for activators used in experiment #1. Placement of the activators is as shown in Fig. 8.
Distance estimation performance of LF tag-activators in experiment #1
Figure 14 shows the distribution maps of RSSI values captured during experiment #2 for all six UHF readers. The magnitudes of RSSI values are displayed as power values in dBm, which are obtained from the actual RSSI values recorded during the experiment #2. Comparing the RSSI distribution maps for both technologies, we can clearly see that the environmental impact on LF-RSSI values is very less compared to that on UHF-RSSI values. Attenuation patterns of LF transmitters are more consistent and suitable for more accurate distance estimation while multi-path and shadowing effects are clearly visible in case of UHF RSSI patterns. Table 2 provides the details about the distance estimation performance of all six UHF readers in the UHF-RFID system.
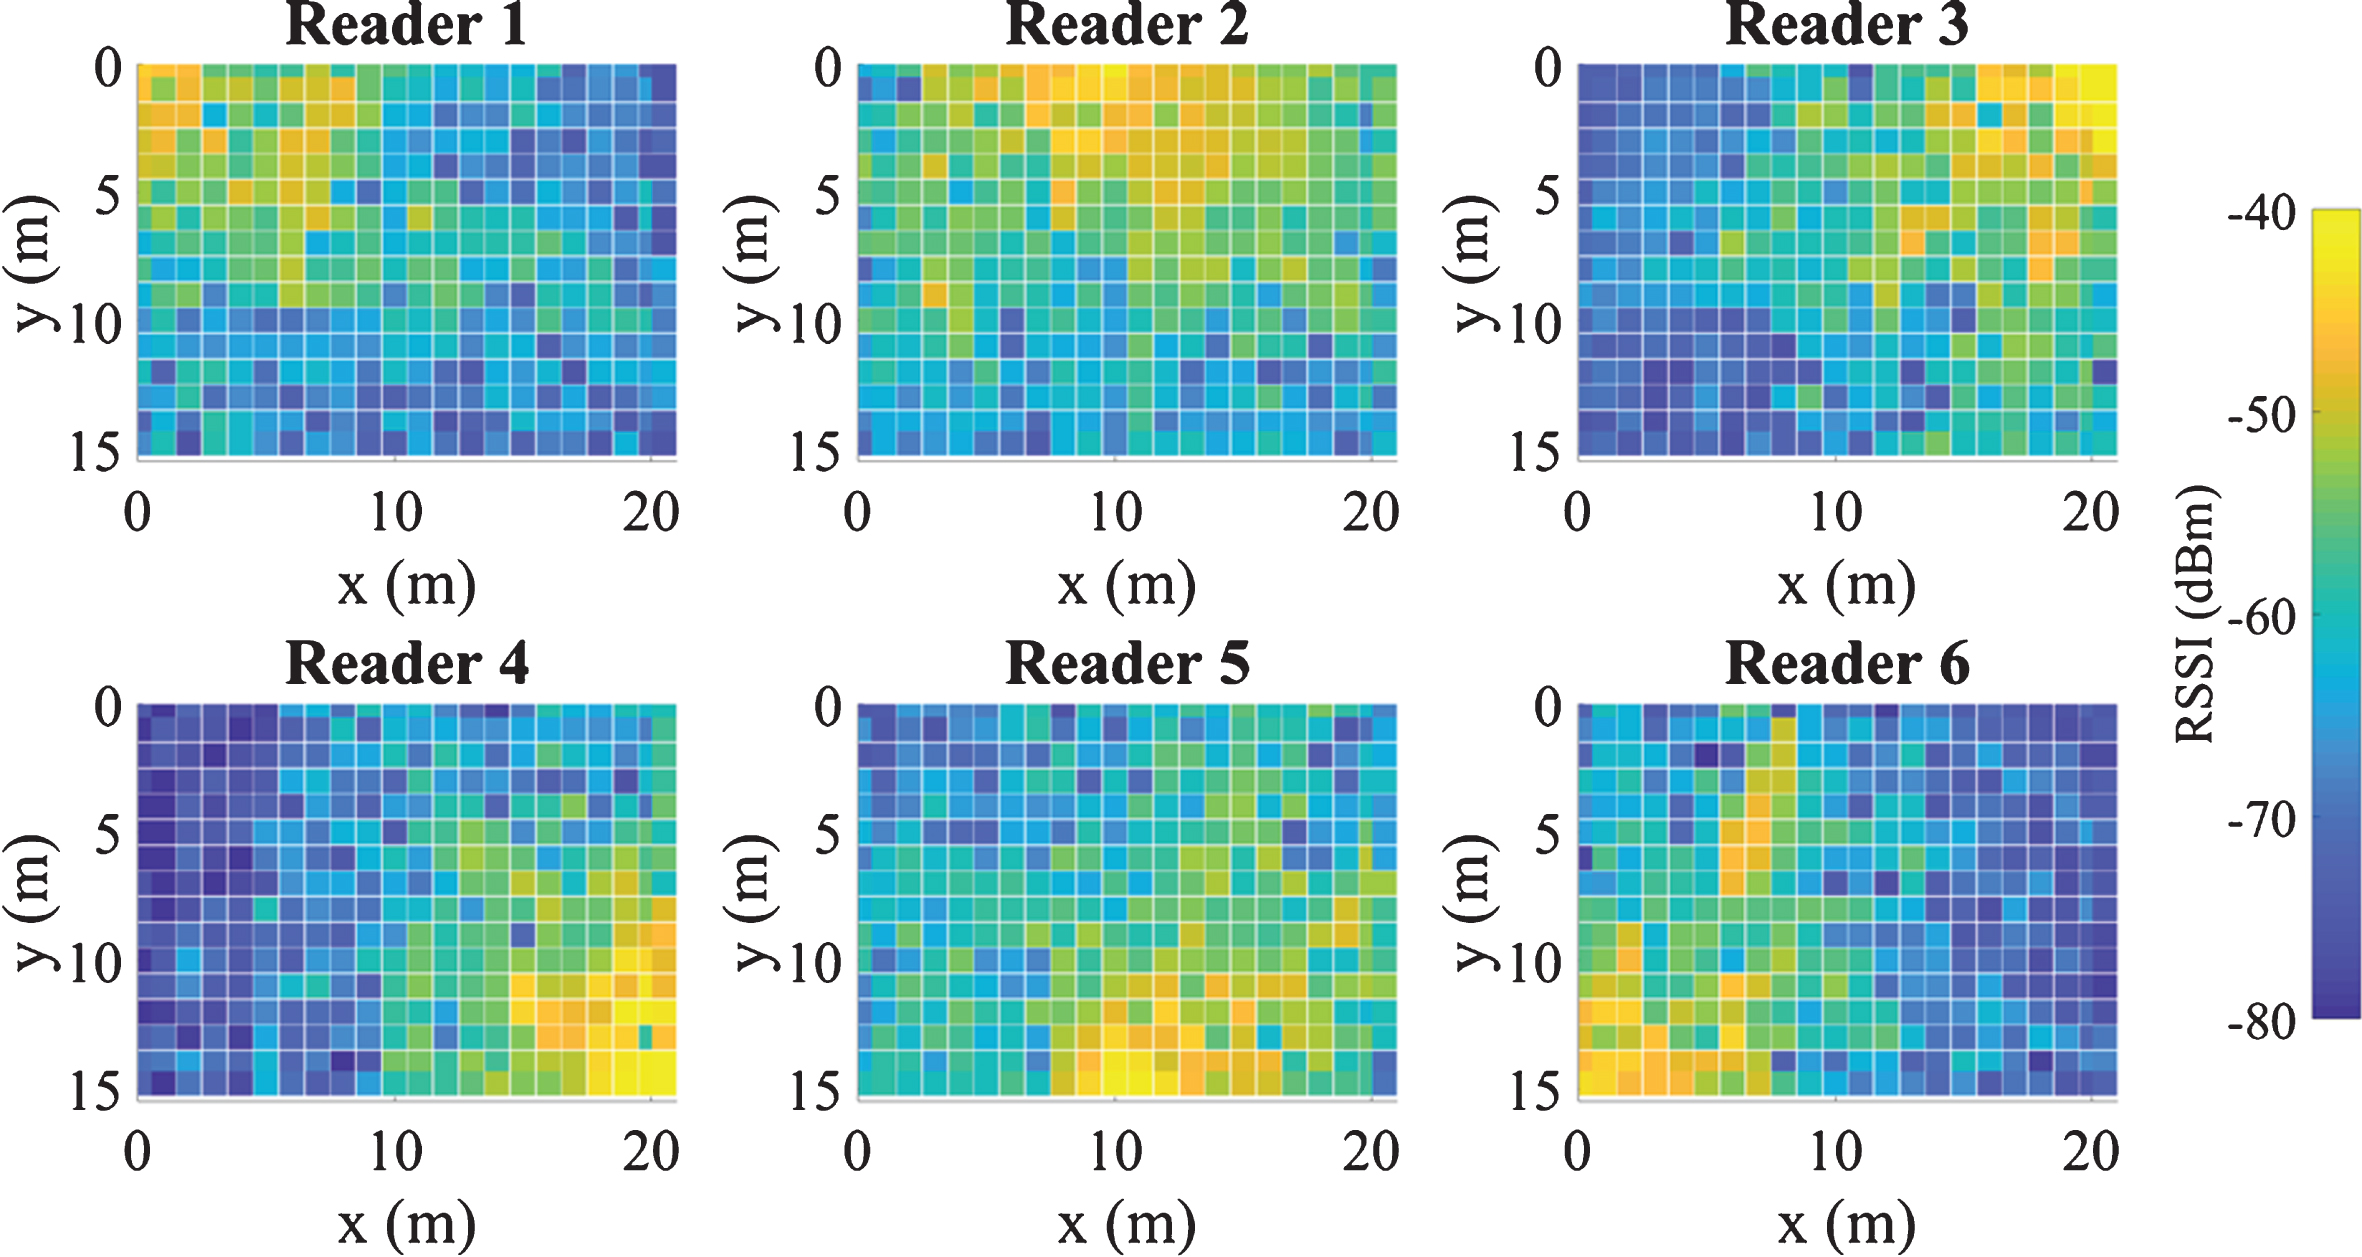
RSSI distribution maps for UHF readers used in experiment #2. Placement of the UHF readers is as shown in Fig. 8.
Distance Estimation Performance of UHF readers in experiment #2
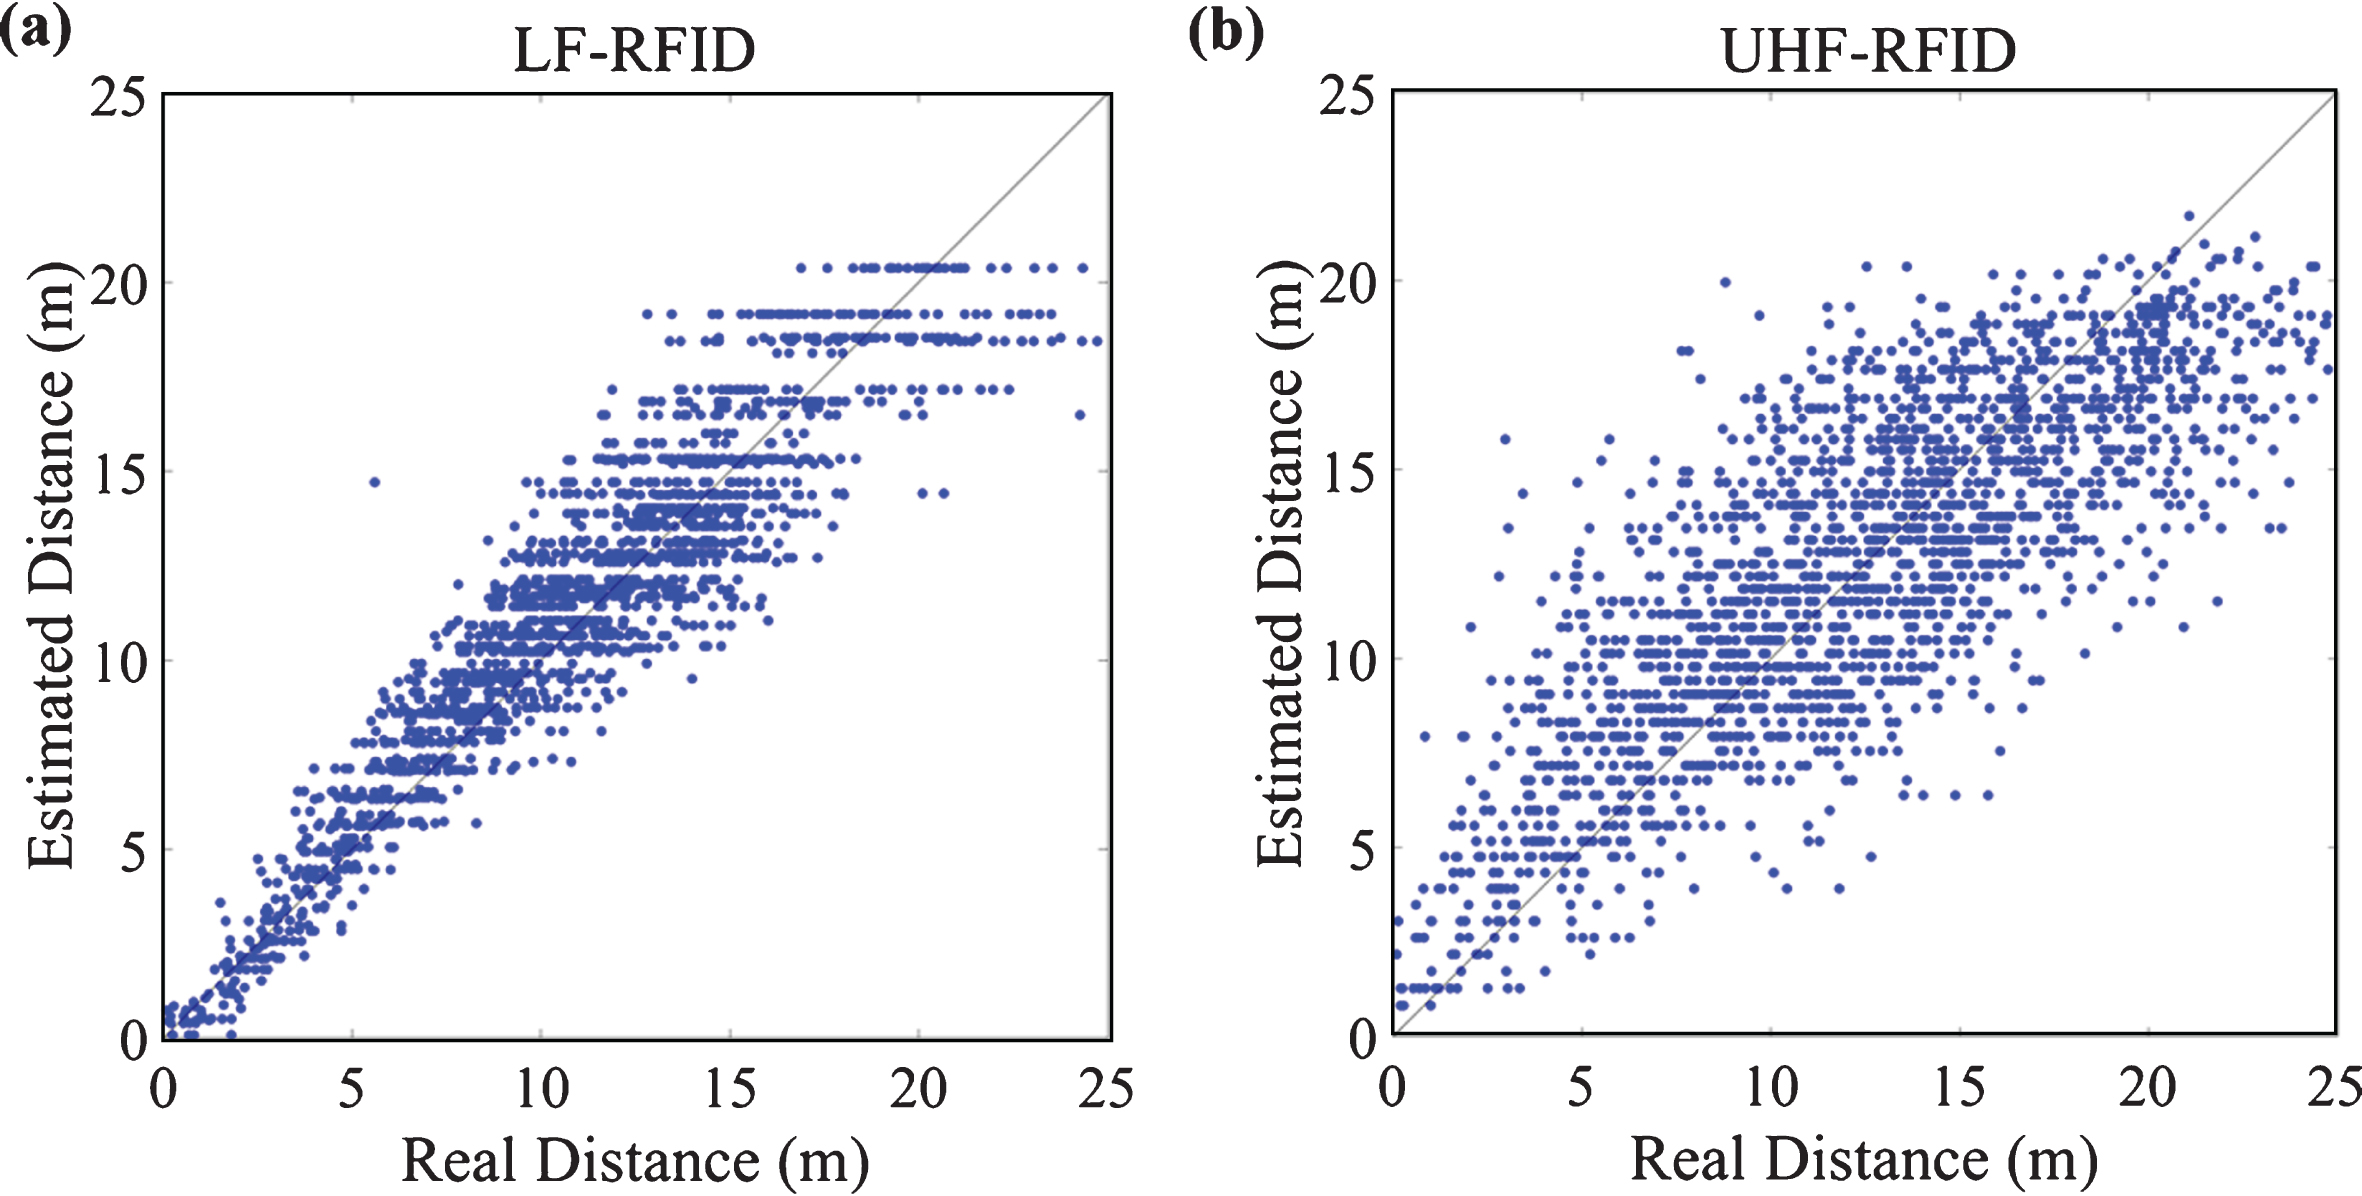
In Fig. 15, plots of real distances versus estimated distances are shown for LF-RFID and UHF-RFID systems. It can be seen that the shorter estimated distances are more accurate compared to the larger distance estimations for the LF-RFID system. Figure 16 shows the histograms of distance estimation error for both systems. The total number of distance estimation is less for LF-RFID system (1774) as it has shorter coverage compared to UHF-RFID system with 2112 distance estimations. LF-RFID has 64% of distance estimations which differ from real distances by less than±1.5 m and 25% of total distance estimations have error below±0.5 m, while UHF-RFID system has 35% and 12% of distance estimations having error below±1.5 m and±0.5 m respectively.
Real versus estimated distances for all base stations in LF-RFID and UHF-RFID systems.
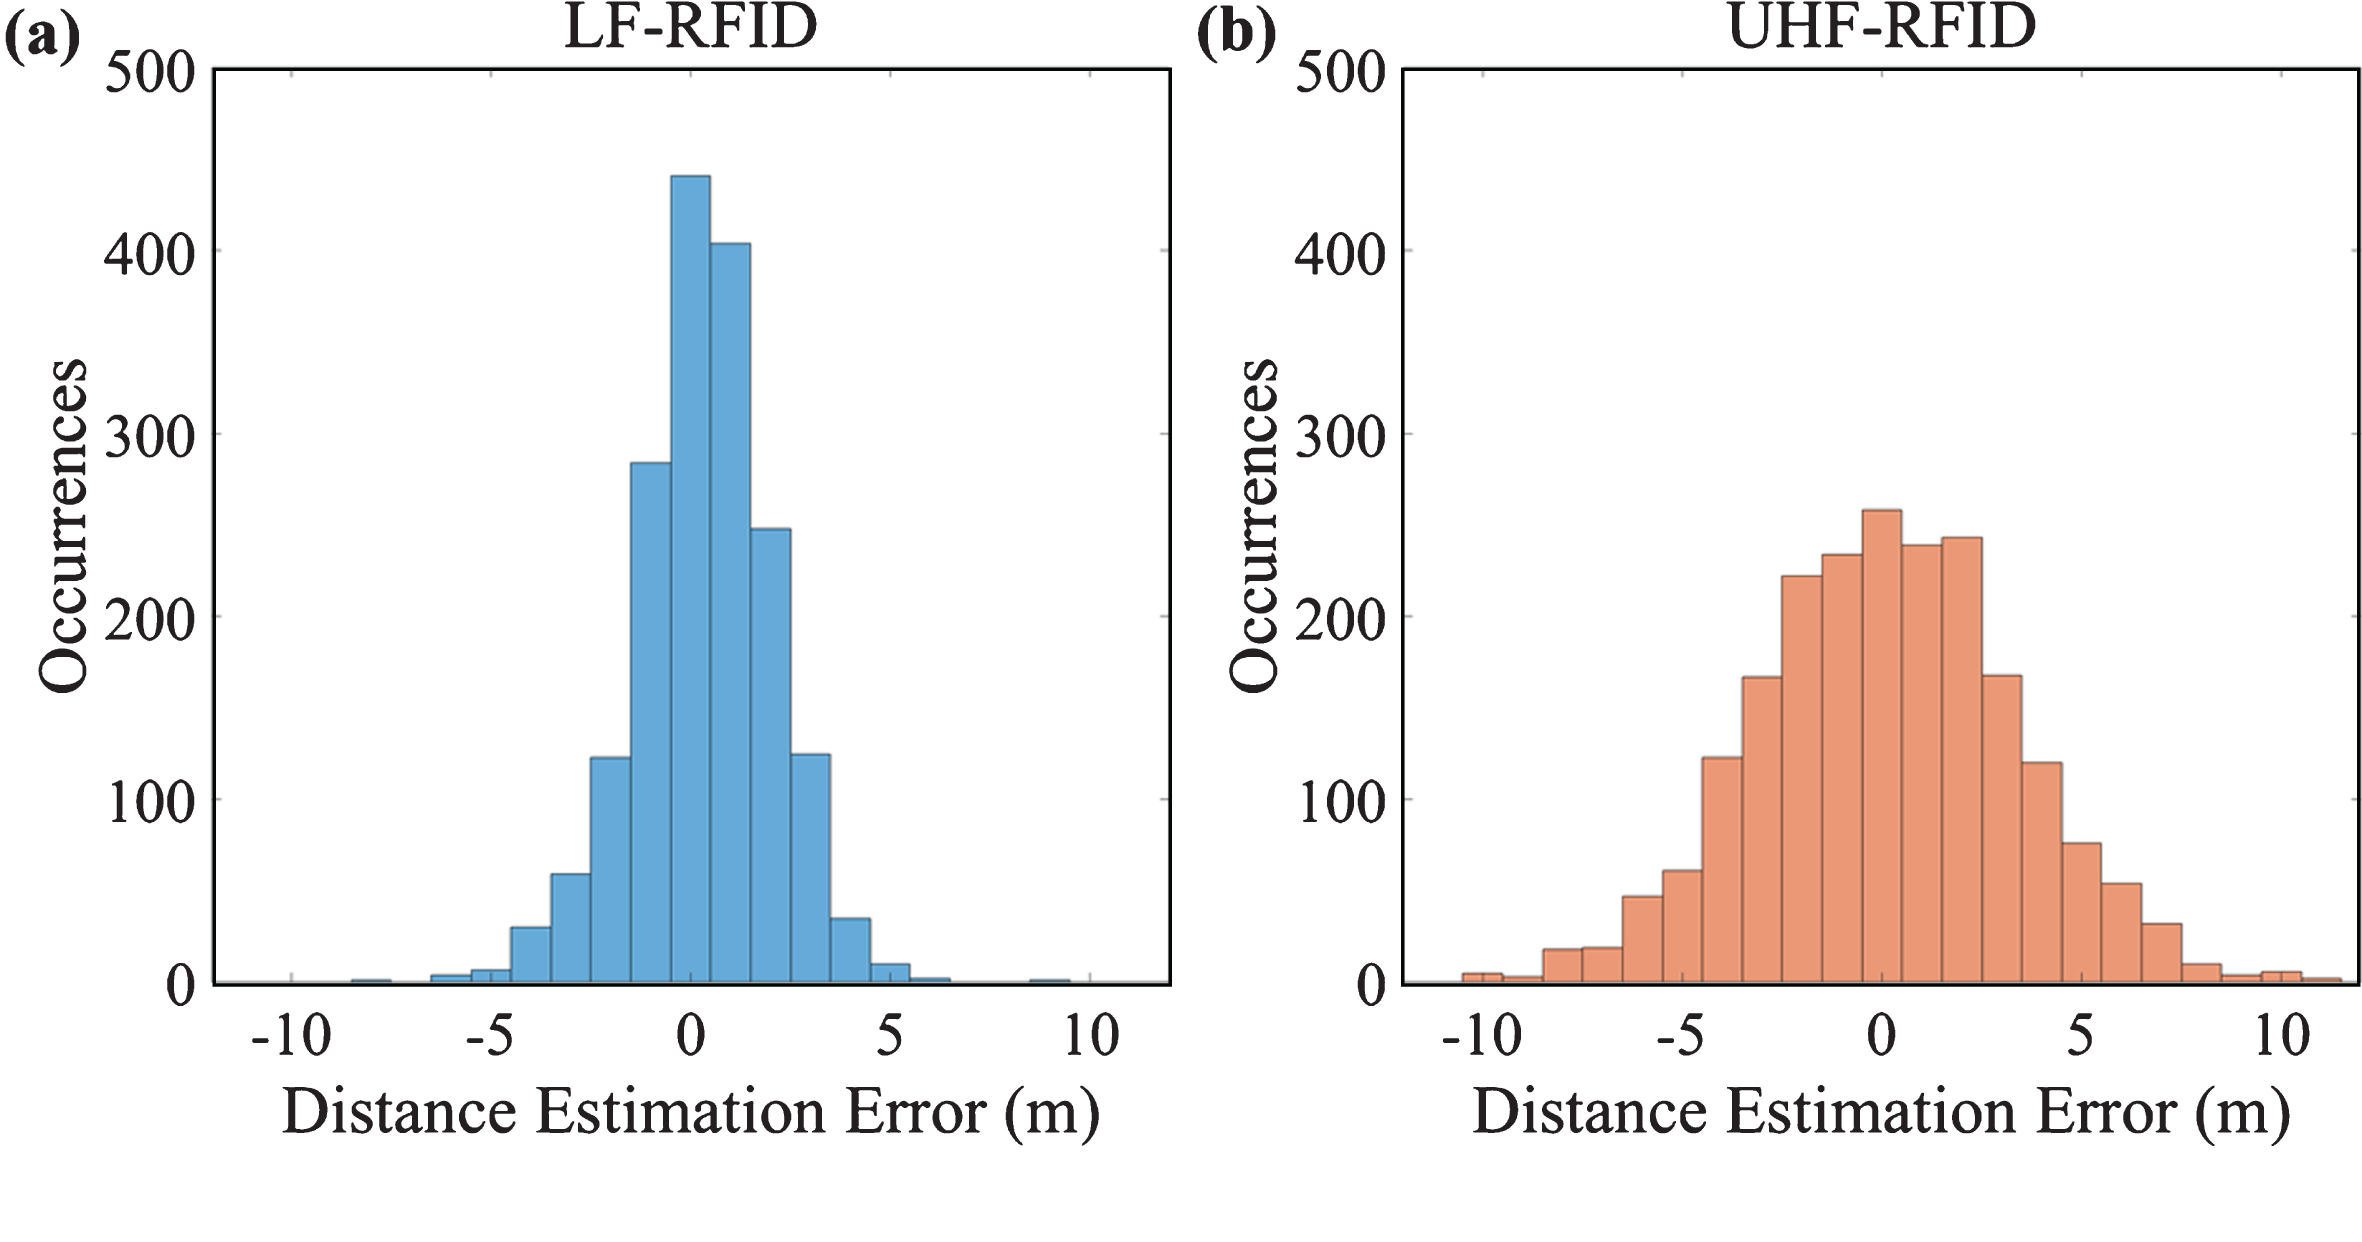
Histogram of distance estimation error for LF-RFID and UHF-RFID systems.
Table 3 compares the 2D localization performance of the two systems. Performance of UHF-RFID system with only four UHF reader is also presented for comparison. Figure 17 shows the cumulative distribution function for positioning errors in both experiments. These results highlight the overall superiority in localization performance of LF-RFID. Performance of UHF-RFID system with six UHF reader is slightly better compared to that with only four UHF readers for localization. Out of 352 estimated location, 90% of the locations were estimated with error less than 2.62 m using LF-RFID while using UHF-RFID, the error is below 5.41 m and 5.68 m with all six UHF readers and only 4 readers respectively. Figure 18a-c show the magnitude of 2D positioning error in meters at each measurement position of the experimental area for both experiments. These error maps show the robustness of the LF-RFID system over entire 315 square-meters area. The performance of UHF-RFID system is worse in the office environment #2 where the density of obstacles and people is more. On the other hand, performance of LF-RFID is not varied by large margin depending on the environment. WCL algorithm has a systematic error which impacts the positioning accuracy at the edges of the regarding environment (Fink et al., 2014). The magnitude of this impact is less for LF-RFID system because of more accurate distance estimations. The performance of UHF-RFID system with only four UHF readers, suffers from low positioning accuracy near the edges where the two readers that form the edge are separated by more than 20 m. When localization is performed with all six readers, the accuracy near the longer edges is improved.
2D Localization error performance
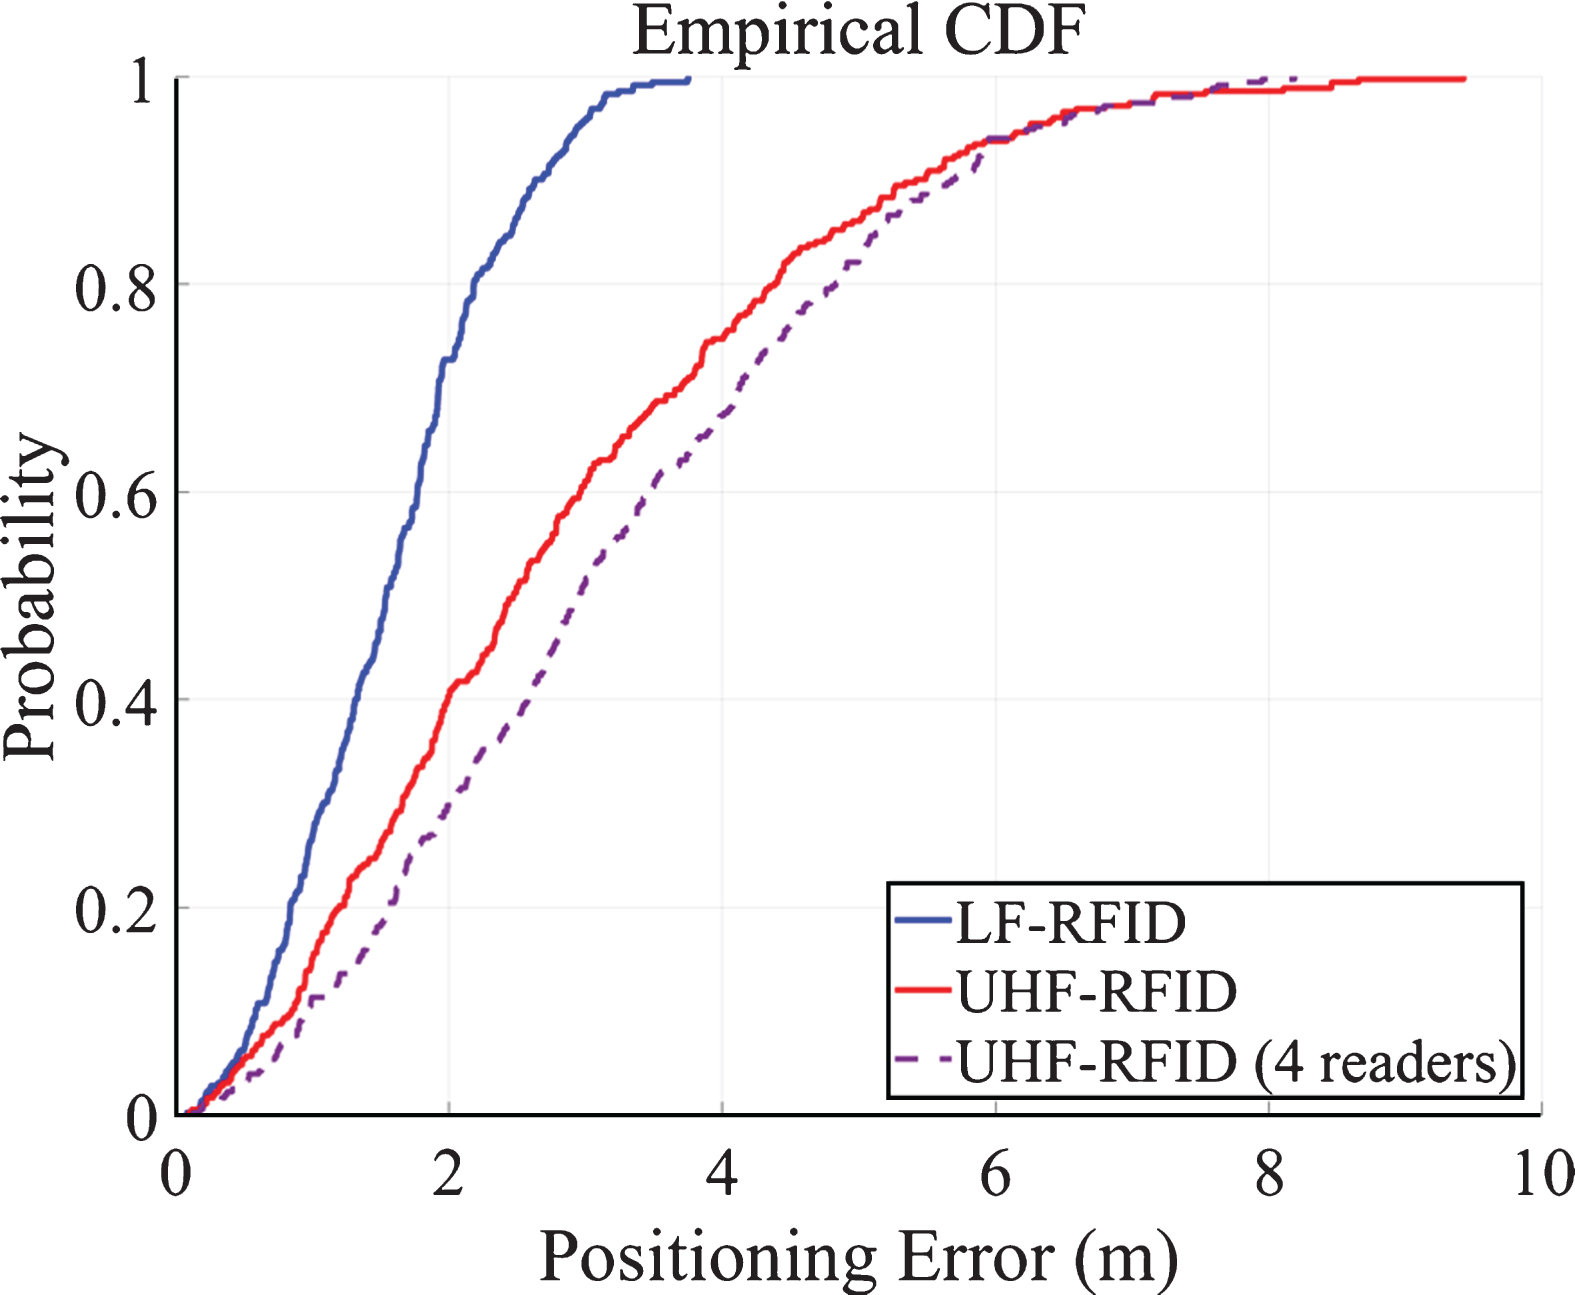
Cumulative distribution function for positioning errors of LF-RFID and UHF-RFID systems.
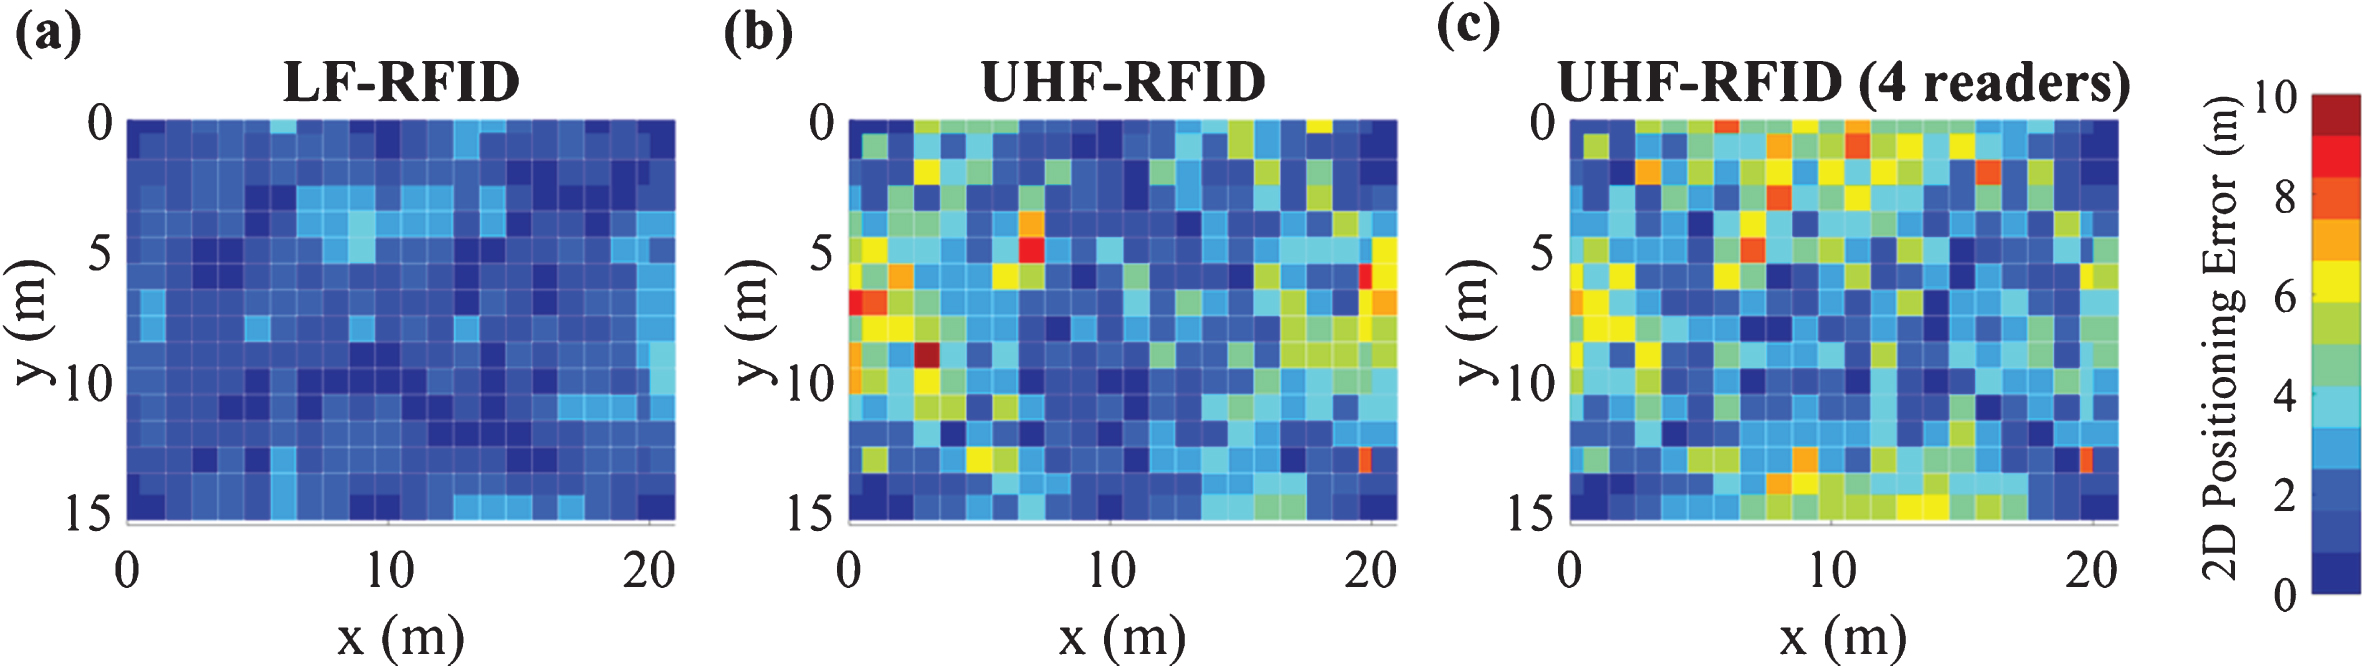
2D Position estimation error map for (a) LF-RFID based localization and (b) UHF-RFID based localization (c) UHF-RFID based localization using four UHF readers in the corners.
Constraints of presented LF-RFID system
Presented LF-RFID system consists of COTS components e.g. tag, activators,
UHF-reader. These devices are also designed using electronic components
available in the market and they are not specifically designed for localization
applications. Thus, there are some limitations to the system because of these
components. LF-RSSI resolution: The LF wake
receiver, AS3933, on the tag has a limitation in terms of LF-RSSI
resolution as it generates 5-bit LF-RSSI. The quantization error
introduced in the process of estimating the distance from real time
LF-RSSI and the attenuation model affects the distance estimation
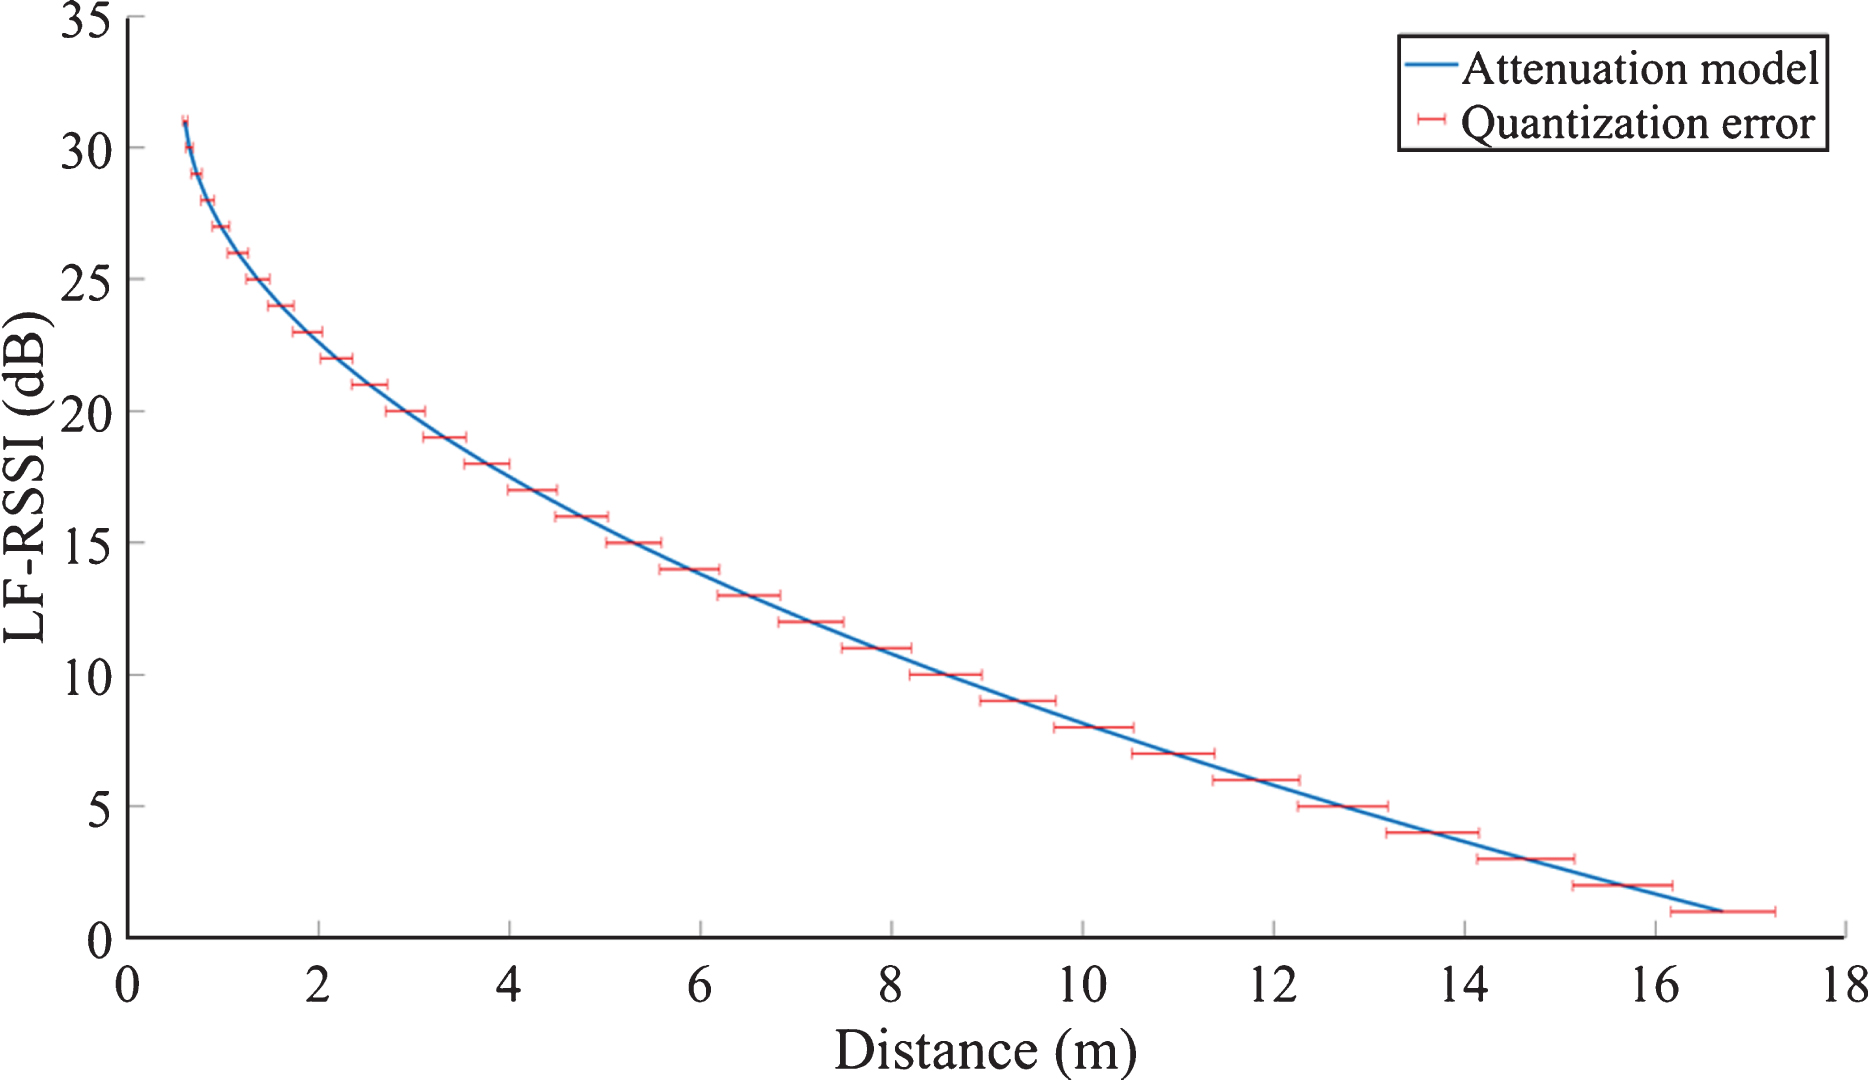
performance. Also, as the LF-RSSI value decreases nonlinearly with
the increase in distance between the tag and the activator, the
impact due to the quantization error varies with the distance. As
the distance from the activator is increased, quantization error
becomes larger (Fig. 19), thus the larger distance estimations are less
accurate. These errors in distance estimation affect the overall
localization performance. In order to minimize the impact on
localization performance, WCL algorithm is used as it is less
sensitive to distance estimation errors compared to triangulation
techniques. Better LF-RSSI resolution will improve the distance
estimation accuracy, more importantly it will reduce the large
quantization errors introduced for longer distance
estimations. Effect of tag Orientation: AS3933 generates
LF-RSSI values form induced voltage for each of the three channels
and then selects a channel with highest LF-RSSI value. This leads to
variation in LF-RSSI when the orientation of the tag is differed
while its position is unchanged. This impact is maximum when the
LF-RSSI values of other two channels are closer to the highest
LF-RSSI value of the selected channel. In order to obtain this
LF-RSSI value the gain of the VGA corresponding to the channel
having highest induced voltage is considered. Ideally, in order to
eliminate the effect of tag orientation, the absolute value of the
voltages induced across all three individual channels should be
applied to the VGA and calculation of LF-RSSI should be done based
on corresponding gain of the VGA. Tag-activation range: Presented
system makes use of resonant inductive coupling in rapidly decaying
near-field magnetic field. The tag-activation range mainly depends
on the sizes of transmitter and receiver coils. In order to make the
tag compact, receiver antenna with bigger loops and higher number of
turns cannot be used, which limits the tag-activation range. The
tag-activation range in the case of presented system is
approximately 16 m which is short compared to the coverage of
UHF-RFID system and other localization technologies such as
Bluetooth, Wi-Fi, UWB etc. Low coverage of single activator affects
the scalability of the system. Collisions: Collisions occur at
two different levels in the presented LF-RFID
system. Collisions at tag: This type of collisions
arises when a tag is present within the tag-activation range of
multiple activators where the tag receives multiple activation
signals from different activators. In this case, the current version
of the LF-RFID tag is not capable of handling the request
sequentially and the activation is done in random order. Thus, the
LF data required for localization are also sent randomly to the
reader. This can delay the information required for positioning
calculation and eventually delay the real-time
localization. Collisions at reader: When there are large
number of tags present in the system, collisions at the reader cause
considerable delay in real time localization of individual tag as
the necessary information arrives to the reader randomly in addition
to the randomness observed at the tag. Variation in quantization error (with
distance) introduced when the attenuation model of an activator is
used to estimate the distance based on real-time LF-RSSI
value.
Based on the results obtained from presented work, we can say that the potential applications of LF-RFID localization within a smart city will be in the cluttered environments where traditional radio technologies are less reliable. LF-RFID combines accurate and robust localization within cluttered environments with its identification capability, thus using this technology, existing applications of RFID localization can be enhanced, and also new applications can be developed for this technology.
Indoor environments within public buildings such as hospitals, airports, shopping malls, etc., which have large public presence, are very challenging for any UHF based localization technique as UHF signals are highly attenuated by water (present inside the human body). On the other hand, LF-RFID tags can be attached directly to the human as attenuation of LF signals due to water is negligible (Chatterjee et al., 1985). Thus, LF-RFID can be used as accurate and reliable human tracking or keyless access technology within aforementioned environments of smart cities. Apart from public buildings, this technology can also be applied effectively within smart home infrastructures. Conclusively, robustness of this technology will ensure improved security, guidance and direct support services within smart cities.
Another potential application field of this technology can be asset tracking within environments with higher metallic presence. In the industrial world, the use of Internet of Things (IoT) is growing considerably for which identification and location information is very important. RFID is an efficient and robust identification technology with the ability to have secure and dynamic data. LF-RFID makes it superior also in terms of localization in presences of metallic obstacles generally present within industrial environments. This technology can be used for IT/data center asset tracking, tracking of machinery, tools and vehicles at manufacturing or construction sites, tracking of equipment inside hospitals, etc. Accurate location information provided by LF-RFID will help to achieve accurate real-time monitoring, increased efficiency for production and shipping as well as improved loss prevention of important assets. In addition to this technology will also ensure added security by recording asset movement and creation of alarms and notifications when the asset moves from a controlled location.
Conclusions
This paper presents an LF-RFID based indoor localization system implemented using COTS components. 2D localization performance of the proposed system in a challenging indoor environment is presented and it is compared with the performance of UHF-RFID based localization system in exactly same environment. Within an environment having surface area of 315 square meters with strong NLOS and multipath conditions and human presence, using simple WCL algorithm based on estimated distance, an accuracy of 1.58±0.76 m for 352 position estimations is achieved. Considerably better positioning accuracy is observed with the LF-RFID system compared to the UHF-RFID system (2.94±1.87 m). The results proved that the proposed technique is less sensitive to the environment.
Superior localization performance in cluttered environment of LF-RFID technology in addition to its identification capability makes it more useful for LBSs such as security, guidance and asset tracking within smart cities.
The constraints of the presented system which negatively affect its performance, are listed and discussed in this paper. Constraints such as LF-RSSI resolution, effect of tag orientation and collisions can be solved with hardware design efforts and the performance of the system can be further improved.