
Abstract
With the rapid growth of e-commerce, logistics companies face challenges in efficient routing and scheduling to meet dynamic delivery demands. This paper proposes a novel logistics scheduling model to optimize vehicle routing using Radio Frequency Identification (RFID) technology. A vehicle scheduling model is developed. The random customer demand and service time are solved using an adaptive taboo search algorithm combined with a nearest neighbor algorithm. Comparative experiments demonstrate the performance of the improved method in completing tasks and reducing queueing time compared to other methods. A case study of route optimization for a logistics company shows the model can recommend optimized routes that reduce total transportation cost by over 25% compared to using RFID alone. The results highlight the potential of the proposed technique to enhance logistics efficiency. Limitations and future work are discussed.
Introduction
Internet of Things (IoT) is drawing a new operational blueprint for the logistics industry. The core value of this technology lies in providing real-time data and an interconnected device network. It facilitates logistics enterprises to digitize and automate every step of transportation, achieving unprecedented operational efficiency and transparency. The current wave of e-commerce is constantly driving consumers’ demand for fast and reliable delivery services. To meet this demand, the logistics industry adopts more intelligent scheduling systems that can analyze data from vehicles, goods, and traffic flow in real-time, providing fleet managers with more insightful information. This reform not only requires vehicle scheduling to be more flexible and responsive, but also minimizes latency and costs of goods from the warehouse to consumers as much as possible. The modernization of logistics transportation and scheduling is not only reflected in enhancing operational efficiency and reducing costs, but also in improving the quality of service. IoT enables customers to accurately know the location and estimated arrival time of goods through real-time tracking, greatly improving customer experience and trust (DiNatale, DiCarlofelice & DiGiampaolo, 2021). Radio Frequency Identification (RFID) technology has become the focus of researchers due to its advantages in data collection and processing (Yao et al., 2021). Although RFID has achieved some results in the logistics field, how to utilize it to achieve optimal routing and efficient scheduling remains an unresolved issue (Zan, 2022). Therefore, this study focuses on how to choose the best transportation path, ensuring transportation efficiency and maximizing resource utilization while minimizing time and cost. Under this background, this research aims to propose a logistics transportation route optimization and scheduling model based on RFID technology. The research adopts a logistics vehicle scheduling model based on random demand and service time (namely VRPSDSST-STW). It is combined with an adaptive taboo search algorithm and a nearest neighbor algorithm for model solving. Taboo search algorithm is a meta heuristic random search method. For logistics scheduling, each cargo needs to be transported along a certain path. Taboo search algorithm can avoid duplicate paths during the search process by constraining conditions, thereby improving the efficiency of logistics scheduling (Li et al., 2022). The nearest neighbor algorithm is a classification method based on data feature similarity, which determines the category of data points by calculating their distance. The optimization and scheduling of logistics transportation paths can play an important role in improving the accuracy and efficiency of goods classification, optimizing transportation paths, and others (Zhai, Qi & Zhang, 2021). The originality of this study lies in building a scheduling model with RFID technology, which has advantages such as non-contact recognition, fast batch processing, and high reliability. Its application in logistics transportation path optimization and scheduling is a relatively new research field. The significance of this study lies in responding to the changing demands of e-commerce, promoting the application of IoT technology in logistics. It also demonstrates how RFID technology can improve the efficiency and accuracy of logistics transportation and scheduling. The study fills the gap in vehicle scheduling in the logistics field. It provides a new perspective to address the changing needs of e-commerce, promotes the application of IoT technology in logistics. And it shows how RFID technology can improve the efficiency and accuracy of logistics transportation and scheduling. Therefore, this study not only proposes solutions to the advanced challenges of logistics scheduling and route optimization, but also improves the operational efficiency and customer service quality in the logistics industry. This research is divided into four parts. The first part summarizes the research results of domestic and foreign scholars on RFID technology and vehicle scheduling algorithms. The second part introduces RFID-related concepts, constructs the vehicle scheduling model, and analyzes the model solving algorithms. The third part tests the performance of the constructed model and verifies its authenticity and feasibility through comparative experiments and practical applications. The fourth part summarizes the experimental results, analyzes the shortcomings of the current research, and points out future research directions.
Related works
RFID technology has significantly impacted logistics operations. It enhances item tracking, inventory management, and process optimization. Critical studies in this domain include:
Application Trends and Overview: Casella et al. reviewed a large number of studies to provide comprehensive insights into RFID applications in logistics, identifying trends and potential fields for future works (Casella, Bigliardi & Bottani, 2022). Indoor Vehicle Positioning: Motroni et al. focused on the utilization of RFID in indoor vehicle positioning. They studied its integration with other technologies and assessed deployment costs and infrastructure requirements (Motroni, Buffi & Nepa, 2021). Transportation and Warehousing Logistics: Popova et al. investigated RFID’s characteristics within logistics information systems, demonstrating through experiments that RFID markedly elevated logistics process efficiency (Popova et al., 2021). Accuracy in Shipping: Popescu MC applied quantitative methods to evaluate the impact of RFID on logistics transportation accuracy. They confirmed RFID’s positive influence on supplier delivery operations (Popescu, 2019). Supply Chain Strategy: Zhang et al. explored the strategic interplay between manufacturer encroachment, RFID adoption, and supply chain dynamics. They found crucial interactions influenced by channel competition and technology costs (Zhang, Tian & Chang, 2022).
Vehicle scheduling is an essential aspect of logistic operations. The studies about it aim to optimize routes, maximize efficiency, and reduce costs. Here are some of the notable contributions:
Dynamic Scheduling for Pickup and Delivery: Su et al. developed a model for maximizing profit in dynamic scheduling scenarios and proposed solution methods that demonstrated substantial improvements in total distance and vehicle usage (Su et al., 2022). Genetic Algorithm for Efficient Logistics: Zhang introduced a genetic algorithm to enhance supply chain distribution scheduling, with case studies showing the approach’s effectiveness in reducing costs and improving computational speed (Zhang, 2022). Heterogeneous Drone Scheduling: Yuan et al. tackled the scheduling of diverse drones in urban settings. They developed a genetic algorithm framework that included specialized genetic operations and a weight-based loading method to improve the efficiency (Yuan et al., 2021). Collaborative Ground and Air Delivery: Bansal et al. conceptualized a cooperative system for ground vehicles and drones to minimize delivery times. Their approach utilized cluster analysis and heuristic algorithms, exhibiting potential over other truck-drone models (Bansal, Goel & Maini, 2022). Shoukat R et al. proposed an economic and environmental planning for transportation, beneficial for understanding of multi-objective optimization problem planning. Their research results show that compared to road freight, multimodal transportation improved the profit of logistics transportation by 82.6% (Shoukat & Zhang, 2023). Liu S established an objective function comprehensively considering the carbon emission cost, transportation cost, penalty cost exceeding time window, and damage cost of cold chain goods to solve the multimodal transportation path optimization problem considering carbon emissions. The model was solved using the hummingbird evolutionary genetic algorithm. The results indicated that it could meet the efficiency requirements of multimodal refrigerated containers (Liu, 2023). To cope with the increasingly personalized logistics distribution and high distribution costs, Cui H et al. proposed a large neighborhood search algorithm and established a soft time window urban logistics distribution constrained model. The results showed that it achieved the optimal transportation cost (Cui et al., 2023).
RFID technology has been instrumental in advancing vehicle scheduling solutions within logistics. However, there is potential to be optimized. Therefore, this study presents a novel approach based on these technologies and proposes a VRPSDSST-STW model. It aims to enhance the reliability and efficiency of logistics vehicle scheduling operations.
Research methods
This research aims to address the logistics vehicle scheduling problem using RFID technology and proposes a real-time scheduling framework based on it. In this framework, the decision component and VRP solver are the core. The real-time status of the current distribution vehicles in the logistics system and the queuing status of real-time requests are introduced to arrange scheduling in a reasonable manner and respond to demands as early as possible.
Real-time scheduling framework based on RFID
The proposed real-time scheduling framework based on RFID consists of five components: task request, real-time data management, decision, VRP solver, and execution (Kgobe & Ozor, 2021). The task request component, composed of request generator and task queue, is used to simulate the generation of real-time task requests and store tasks. The real-time data management component is composed of RFID data generator and management. It is used to simulate the generation of real-time RFID data and manage the data, assisting the decision component (Raad, Deriche & Sheltami, 2021). The decision component is composed of decision maker and real-time scheduling algorithm. It is used to determine whether the system can handle tasks at the current time and schedule the task queue, passing the processed tasks to the execution component and the scheduled tasks to the VRP solver. The execution component is composed of performance evaluation and execution display. It is used to evaluate the processing results and the display. The real-time scheduling framework based on RFID is shown in Fig. 1.
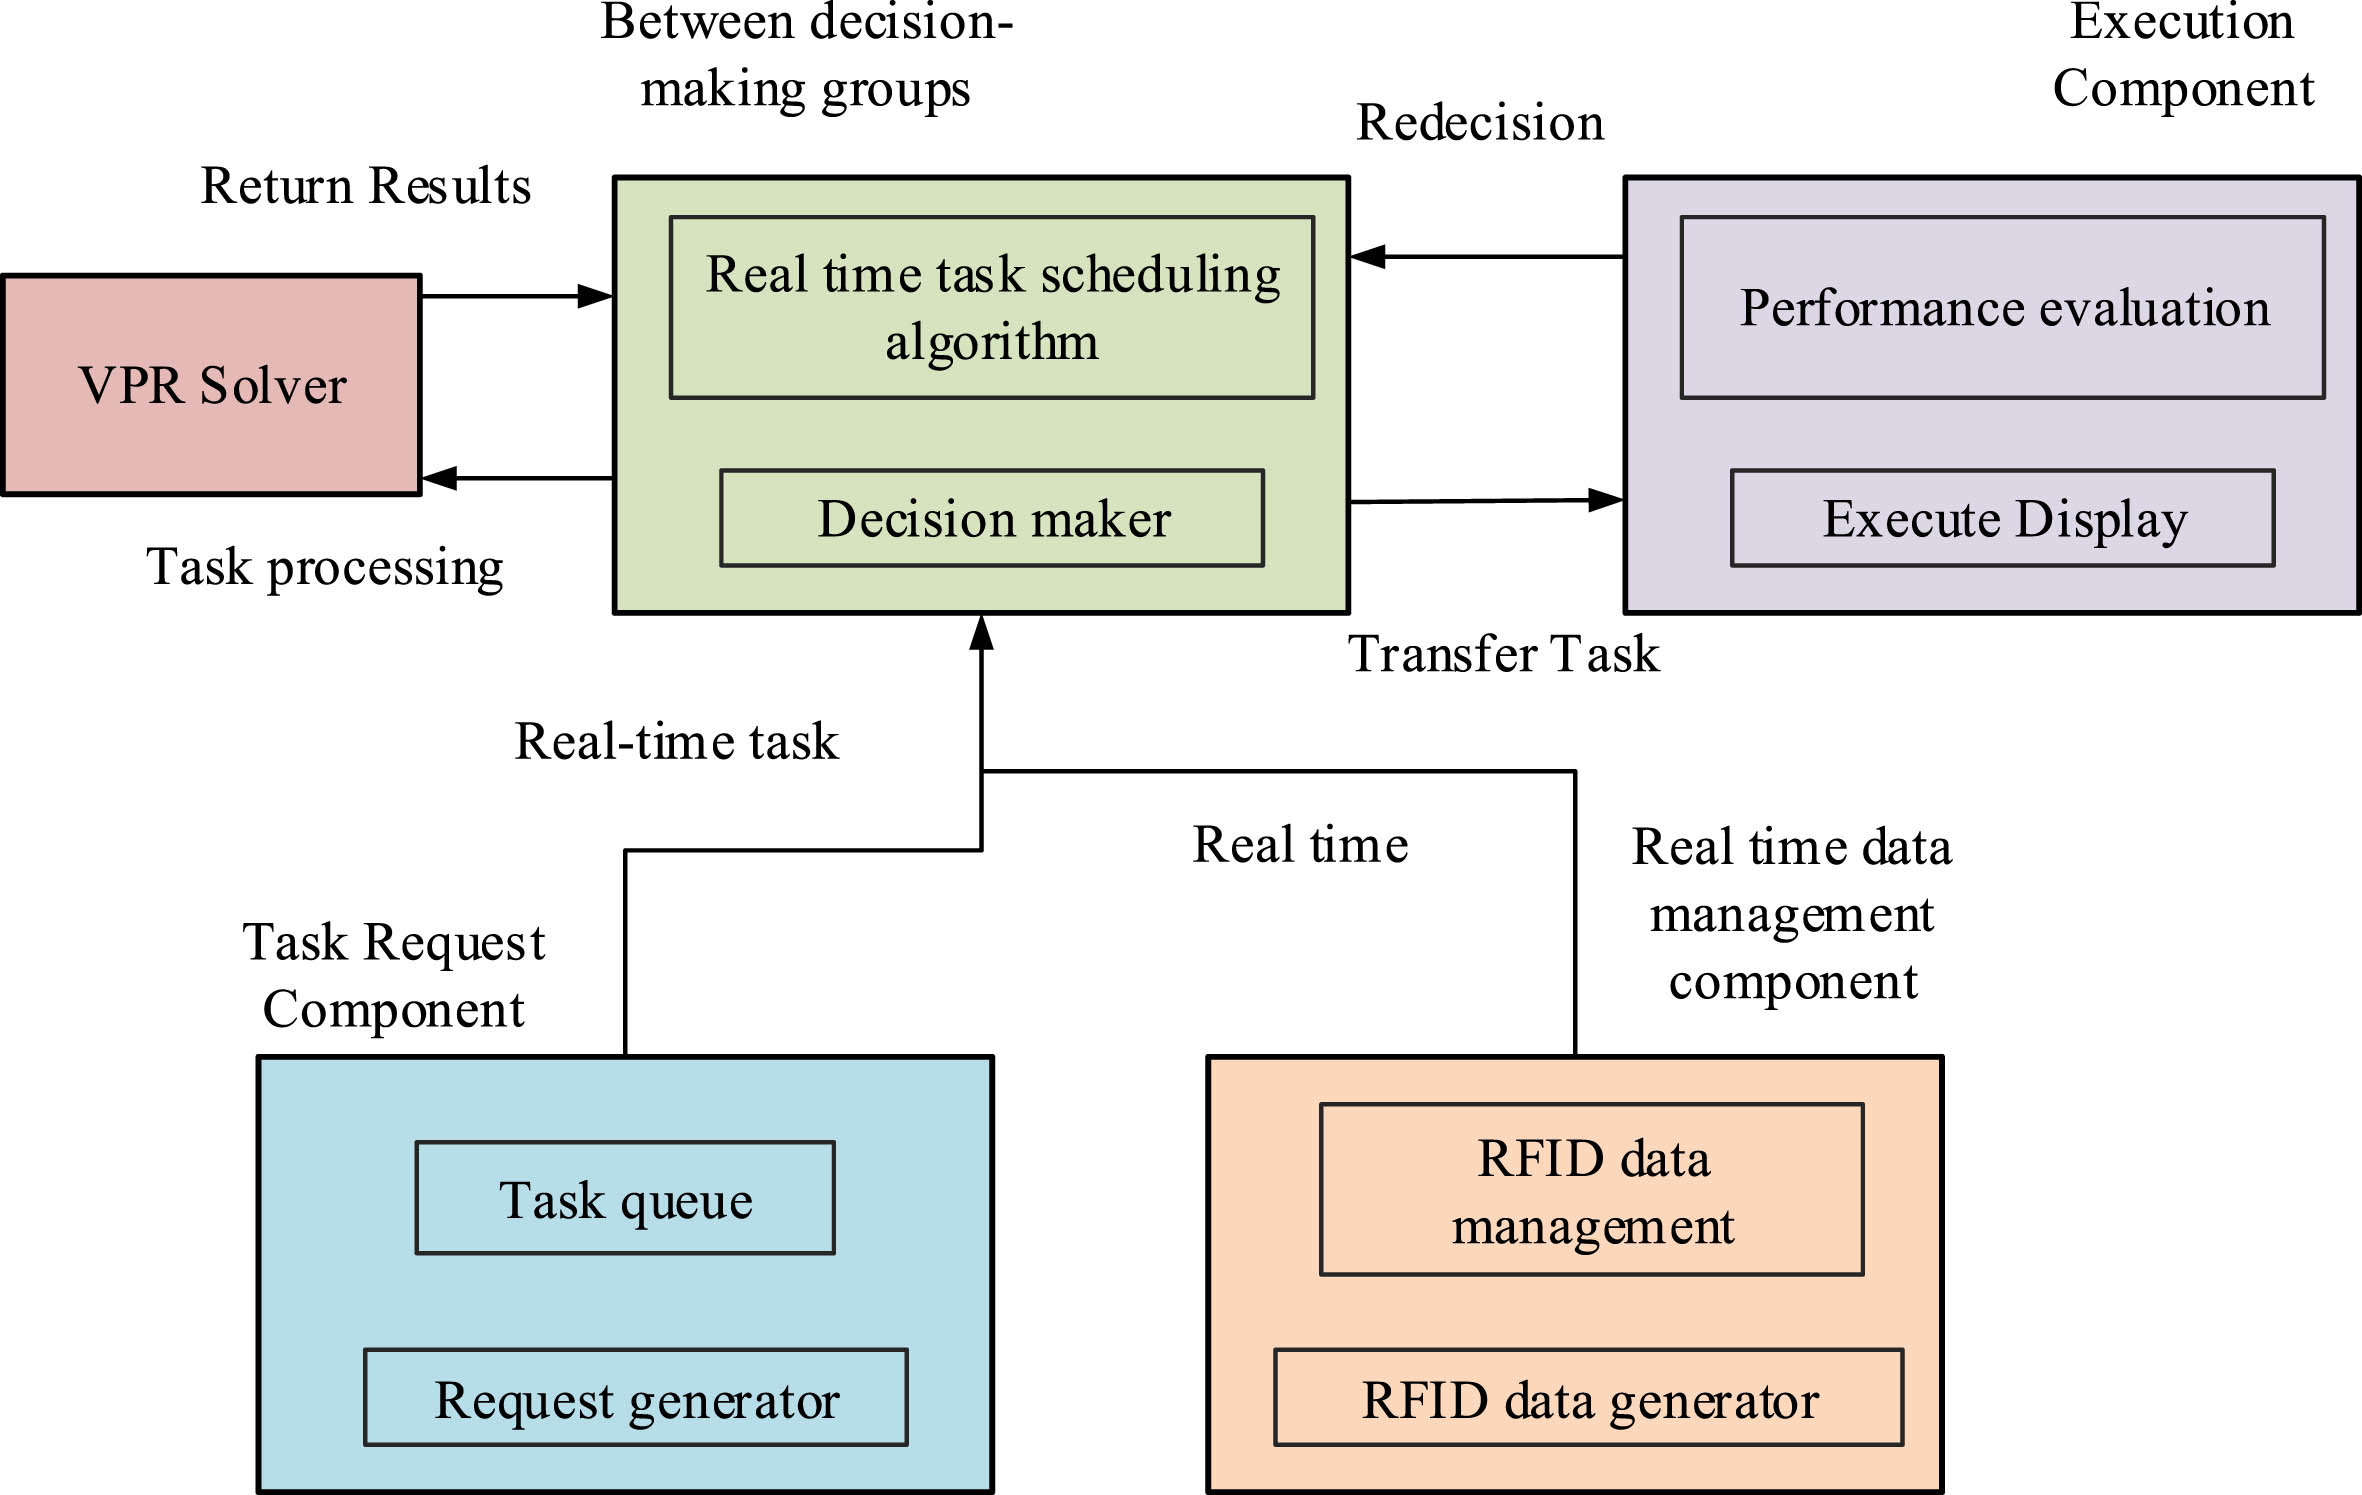
Real-time scheduling framework based on RFID.
Based on the modules and related functions in Fig. 1, the research analyzes the RFID data generator and decision maker. In the RFID data generator, the effective distance of the RFID system is set as r. It can affect the probability of the tag being recognized and read by the reader. The larger the value of r, the higher the probability of the tag being read by the reader, indicating that the RFID system has fewer limitations. The probability of the tag being read can be simulated and calculated by establishing a data generator model based on a normal distribution. The research assumes that the reader coordinates are (x1, y1, z1) and the tag coordinates are (x2, y2, z2). The external factor influencing the probability is denoted as P random , and the self-factor influencing the probability is denoted as P self . The mathematical model for the probability of the tag being read is shown in Equation (1).
In Equation (1), P represents the probability of the tag being recognized and read by the reader, and distance represents the distance between the tag and the reader. If P is greater than or equal to P random , the tag is recognized and read by the reader, resulting in RFID data being generated. If P is less than P random , it means that the tag cannot be recognized and read by the reader, because it is too far away or external factors.
The decision maker in the decision component is the core module of the entire real-time scheduling framework, responsible for coordinating and interacting with various components in the framework. The main function of the decision maker is to use the real-time scheduling algorithm at an appropriate time and select a number of tasks from the task queue. Then it calls the VRP solver to process these tasks, and finally updates the system status. In general, each decision action of the decision maker occurs after a system polling interval following the end of the previous decision action. The specific decision process is shown in Fig. 2.

Decision process and decision system of the decision maker.
In Fig. 2, the decision system consists of three layers: presentation, action, and data. The decision process belongs to the key part of the decision maker in the action layer. Besides the decision maker, there is a logistics movement algorithm in the action layer, which has a significant impact on the decisions made by the decision maker. A good algorithm can achieve better logistics movement. Therefore, this study focuses on how to the research analyzes the real-time scheduling algorithm.
Vehicle routing problem model based on VRPSDSST-STW refers to a variant of the vehicle routing problem that takes into account the randomness of demand and service time. This means that when planning the route and scheduling of logistics vehicles, it is necessary to take into account the possible changes in the demand and service time of each distribution point. Also, it is necessary to consider how to efficiently and economically complete the entire distribution task. This model is often used to solve more complex and uncertain logistics planning problems. In VRPSDSST-STW, the customer demand and vehicle service time are unknown, and customers have requirements for the delivery time of goods. Vehicles can arrive at the customer’s specified time, but there will be a penalty before delivering the goods to the customer (Hamadneh et al., 2021). The research assumes that customer demand follows a random variable that obeys a normal distribution, and the actual customer demand is only revealed when the vehicle arrives at the location of customer. The vehicle service time is related to the customer demand, where larger customer demand results in longer service time. When planning the vehicle’s travel path from the distribution center, the range of customer demand variation and the vehicle service time need to be considered (Lian, 2021). Therefore, the main issue with this model is the additional cost of vehicle failure during the driving path. The specific value of additional costs is the time cost, maintenance cost, and labor cost incurred by the vehicle in the formal path of failure. Reducing the probability of vehicle failure in the driving path is a key issue of this algorithm.
Vehicle fault correction costing
In the VRPSDSST-STW algorithm, the vehicle capacity is denoted as Q. The number of distribution vehicles is denoted as K. The customer demand is denoted as q, which follows a random variable that obeys a normal distribution. The vehicle service time is denoted as R. Since the vehicle service time is directly related to the customer demand, it also follows a random variable that obeys a normal distribution. Therefore, the calculation function for the corrective cost when a vehicle encounters a breakdown is shown in Equation (2).
In Equation (2), c
ij
represents the distance between customers. x
ijk
represents the decision variable. λ
jk
represents the penalty coefficient for delayed arrival. E (D
jk
) represents the expected delay arrival time of the vehicle, and g (x) represents the total corrective cost when breakdown occurs. The expressions for x
ijk
, (D
jk
), and g (x) in Equation (2) are shown in Equation (3).
In Equation (3), k i → k j represents the continuation of service. A jk represents the arrival time of the vehicle. W jk represents the arrival time after the travel path is corrected. P jk represents the corrected delay arrival time, and l j represents the right boundary of the logistics delivery time interval.
The calculation of the vehicle’s peak arrival time can be expressed by Equation (4).
In Equation (4), ej-1 represents the left boundary of the logistics delivery time interval, and tj-1,j represents the required travel time between customers. The research assumes that the vehicle travels at a unit speed, so there are three possible situations for the vehicle’s arrival time at the customer, as shown in Fig. 3.
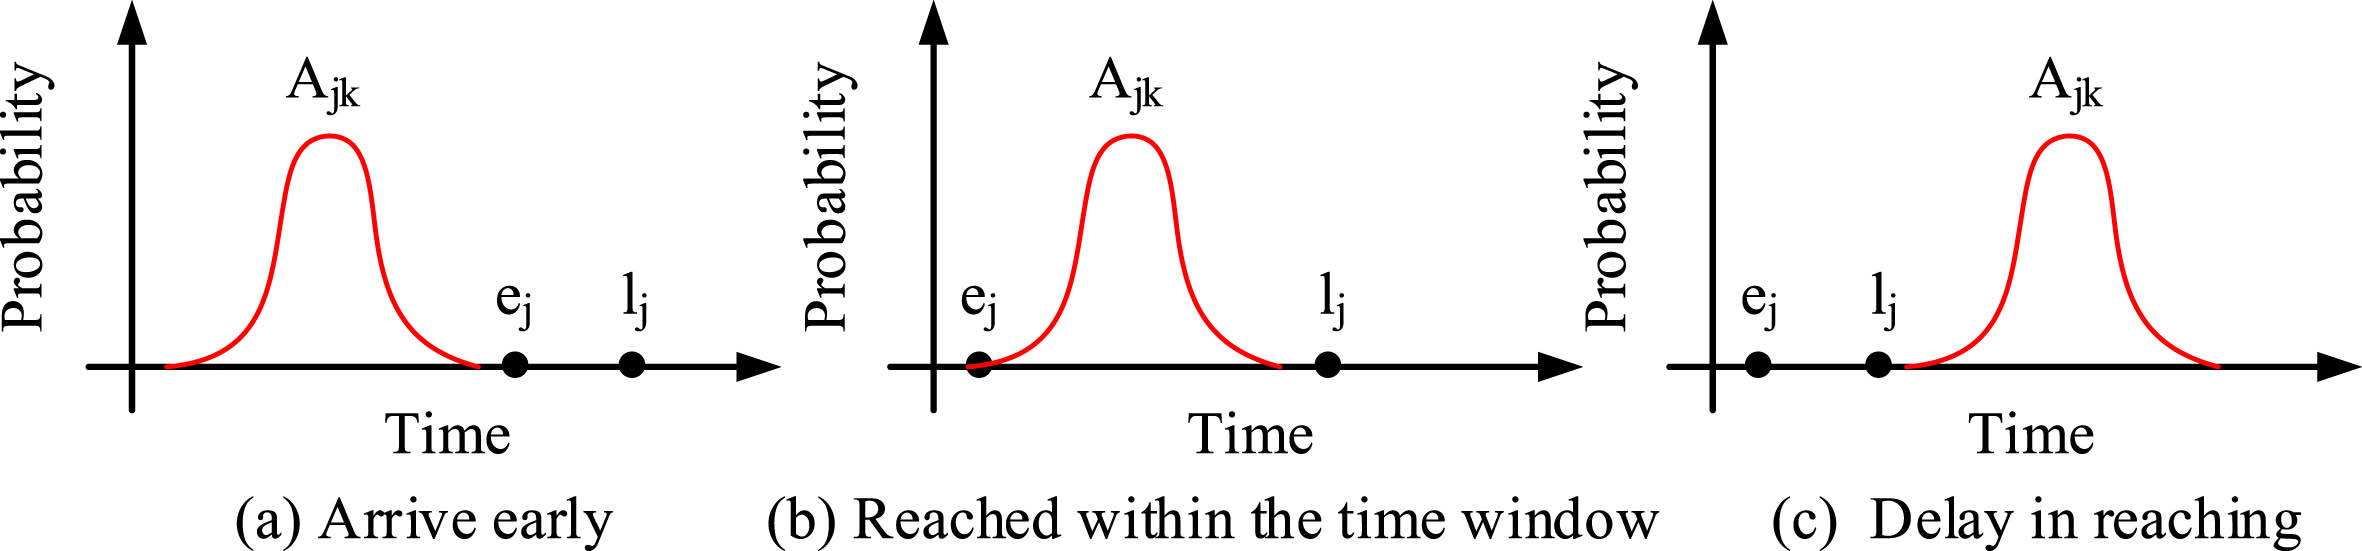
Distribution of vehicle arrival time at the customer.
Figure 3 represents the three possible situations, including the vehicle arriving early, arriving within the time window, and arriving late. Arriving early requires waiting time before providing service. Arriving within the time window allows for immediate service. Arriving late allows for service but with a certain penalty. To make the vehicle’s path more aligned with the actual demand, the research adds relevant constraints on the vehicle’s travel path, capacity, and soft time window of the model.
VRPSDSST-STW belongs to the NP-Hard combinatorial optimization problem, where customer demand and vehicle service time are random variables that follow a normal distribution, resulting in high computational complexity. To address this problem, an Improved Hybrid Taboo Search Algorithm (IHTS) is proposed. This algorithm combines the taboo search algorithm with the nearest neighbor algorithm, using time window width and distance as node selection criteria. It also adjusts factors such as taboo length and neighborhood structure and introduces an adaptive penalty coefficient.
The research introduces the Nearest Neighbor Heuristic (NNH) to generate initial solutions, which is improved too. NNH is mainly to quickly generate starting solutions, provide quality references for solutions, and simplify problem complexity. The search space for logistics scheduling problems is large, and directly starting from a random state may be very inefficient. The nearest neighbor algorithm can quickly provide a relatively reasonable initial solution, which helps subsequent algorithms search for improved solutions more efficiently. The initial solution generated by NNH can provide a baseline for subsequent hybrid taboo search algorithms to compare and evaluate whether their improvement process has made progress. Due to the high computational complexity of VRPSDSST-STW, the nearest neighbor algorithm is used to simplify the problem size to a more manageable level, thereby improving the overall solving efficiency of the algorithm [Abosuliman & Almagrabi, 2021; Bhargava et al., 2022].
Transportation cost solution
When constructing the initial travel path for logistics vehicles, the initial node selection starts from the distribution center, and the next node is selected based on the customer with the minimum Shipping Cost (SC), as expressed in Equation (5).
In Equation (5), B represents the weight coefficient. If the customer’s service time window is small and the distance to the node is great, SC is small, and the priority of the current customer as a node is high.
To prevent the VRPSDSST-STW model from being trapped in local optima, a taboo list is used. The length of the taboo list has a direct impact on the model’s search. A short taboo length limits the search space, while a longer taboo length increases the runtime of the model. Therefore, an adaptive taboo length is proposed, where the taboo length changes during the search process. When searching for the best solution, the current solution is compared with the searched solution. If the searched solution is better, the taboo length is increased. If the searched solution is worse, the taboo length is decreased.
To handle the constraints in the VRPSDSST-STW model, a specific neighborhood structure is designed in the domain structure. Randomly selected customers are inserted into randomly selected paths. If a path conflicts with the capacity constraint, the customer is inserted into the next path. Four general neighborhoods are used for alternating search, including the 2-opt, cross, shift, and exchange neighborhoods. The changes in the aforementioned neighborhoods are shown in Fig. 4.
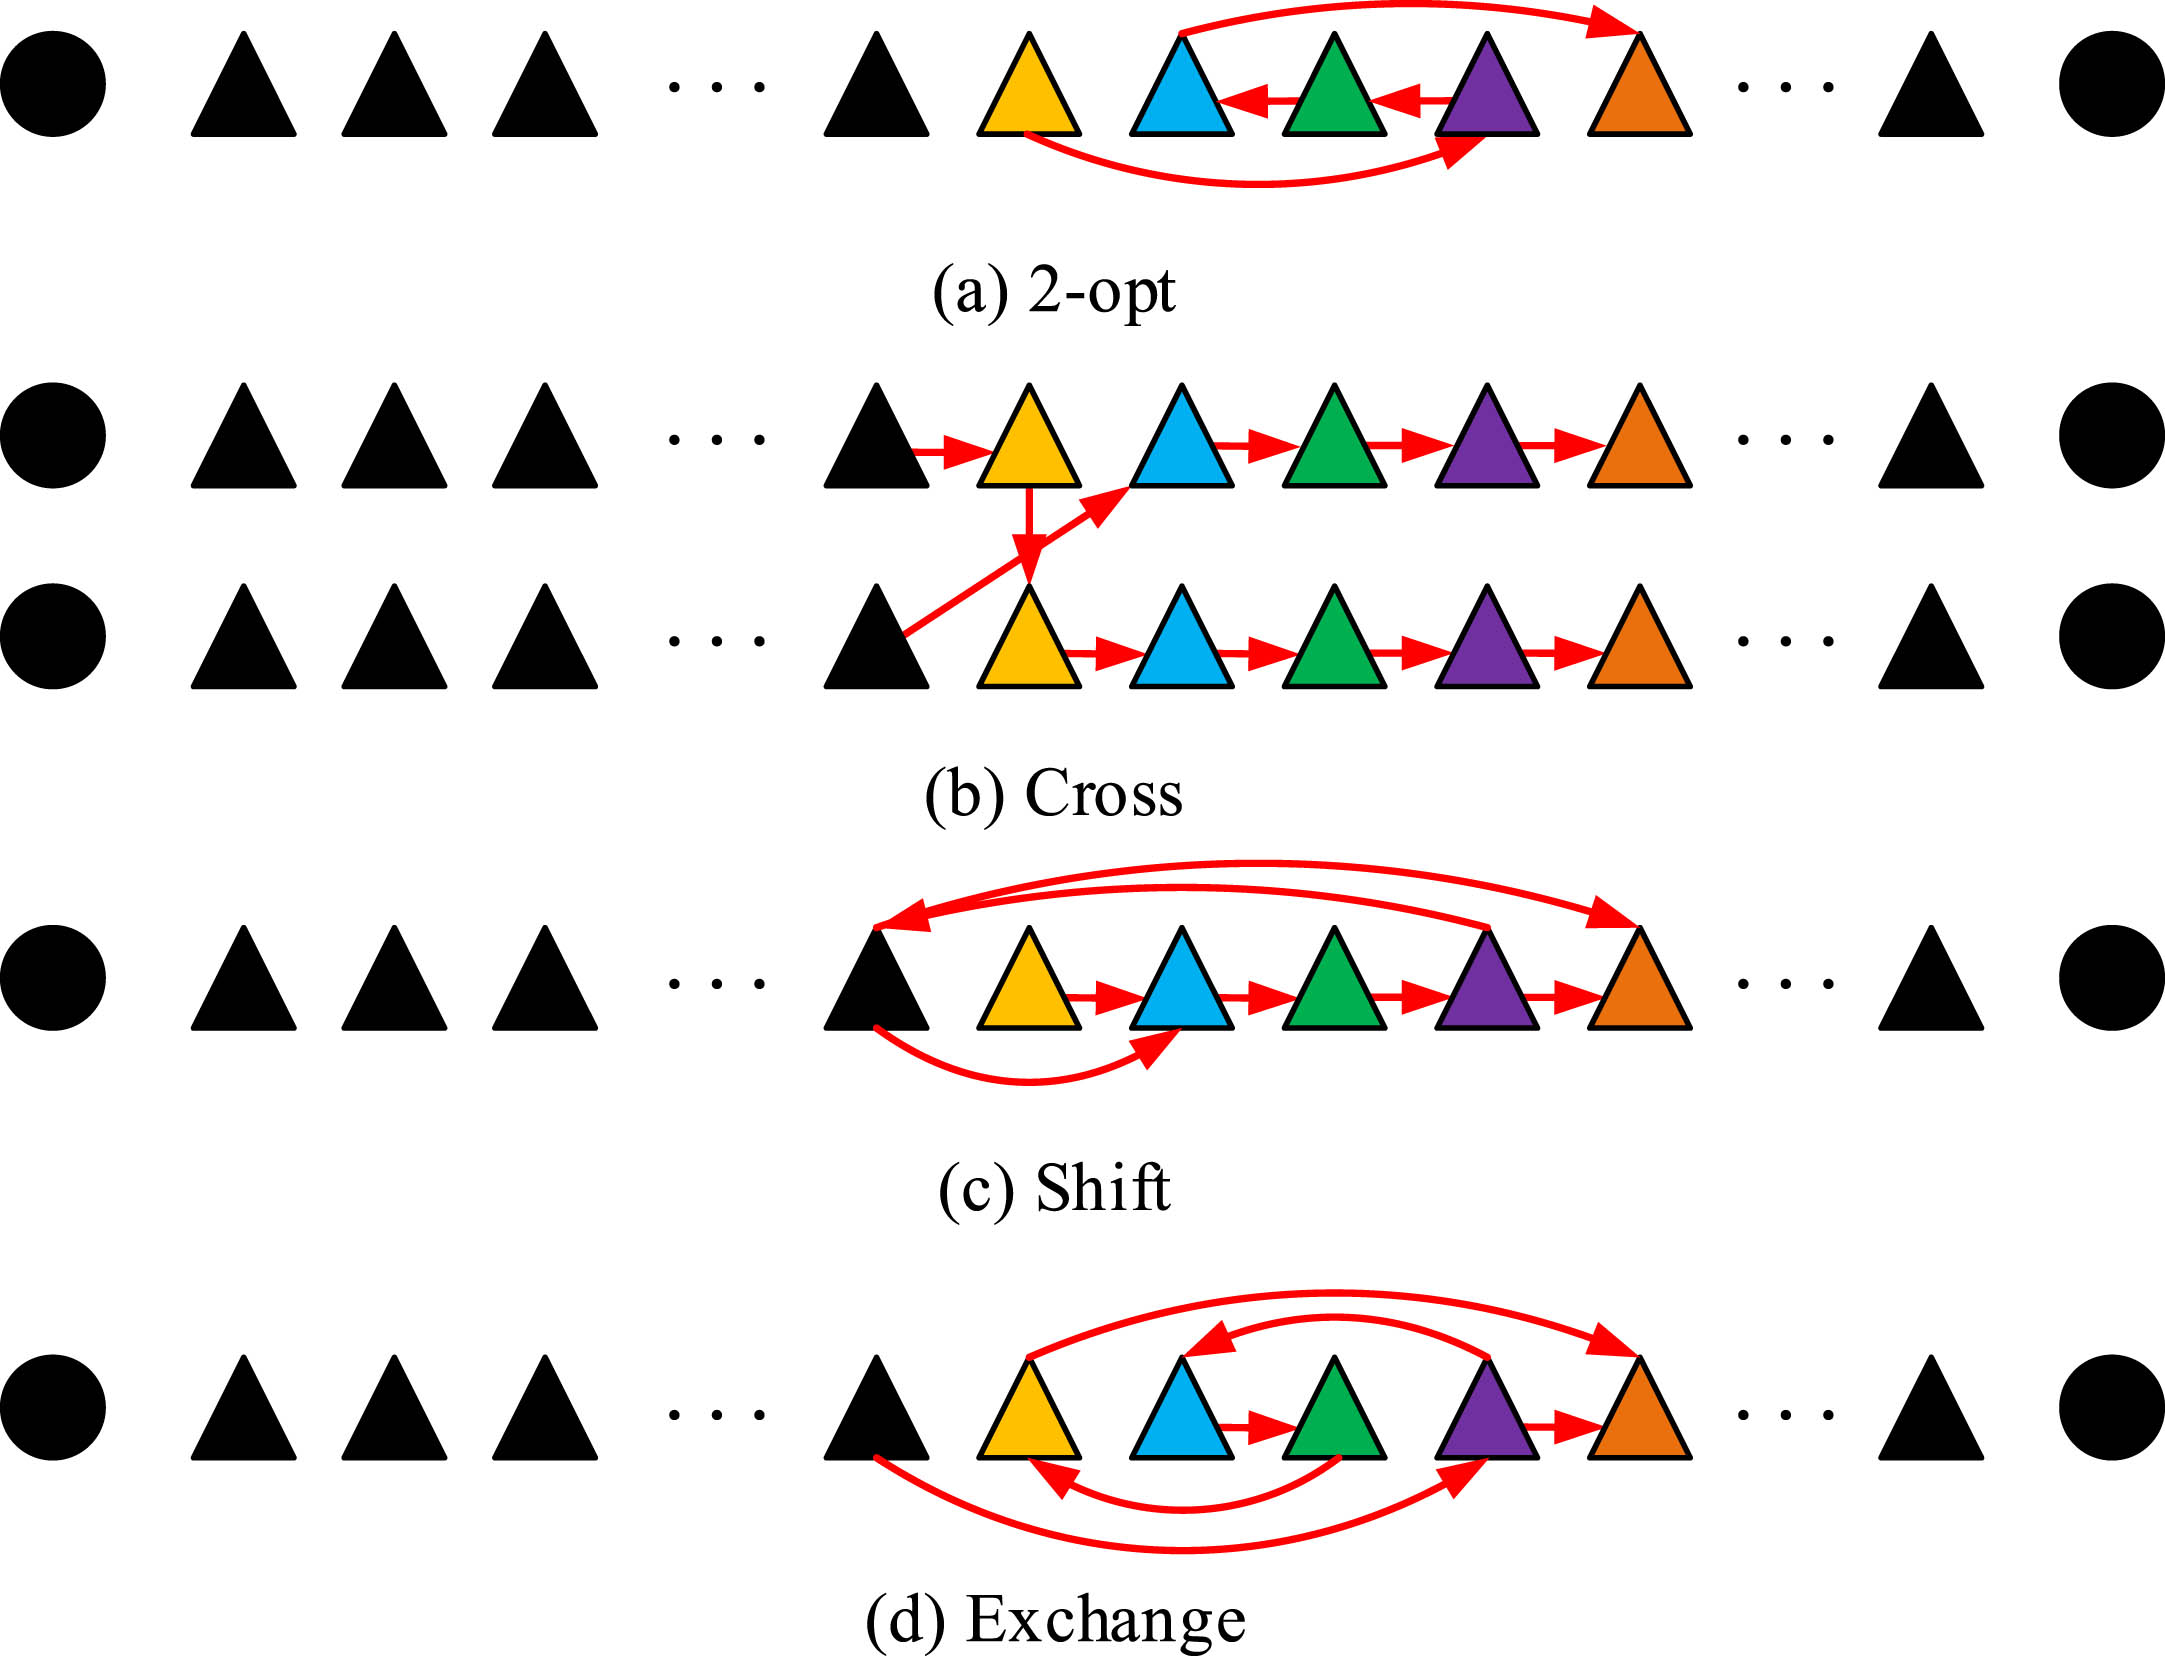
Illustration of different neighborhood structure variations.
In Fig. 4, the 2-opt neighborhood structure variation randomly selects a customer in the path and performs arbitrary reordering. The cross neighborhood structure variation randomly selects two paths and exchanges randomly selected customers between the paths while keeping their positions unchanged. The shift neighborhood randomly selects a customer in the path and inserts it at another position. The exchange neighborhood randomly selects two customer nodes in the path and exchanges their positions.
During the iterations of the taboo search algorithm, the current solution is denoted as s. The set of neighborhood solutions is denoted as N (s). The cost of vehicle travel is denoted as c (s). The penalty coefficient when capacity constraint is violated is denoted as α. The total capacity when capacity constraint is violated is denoted as q (s). The penalty coefficient when soft time window constraint is violated is denoted as β, and the total time when soft time window constraint is violated is denoted as t (s). The quality of the model solution can be represented by Equation (6).
In Equation (6), the two penalty coefficients vary during the search process. Therefore, the initial values of the penalty coefficients are set to 1, and they are adjusted during the model iteration. If the current solution does not violate the capacity constraint, Equation (7) holds.
In Equation (7), ξ represents a random variable that follows a uniform distribution. If the current solution does not violate the soft time window constraint, Equation (8) holds.
The research combines the nearest neighbor algorithm with the adaptive taboo search algorithm to obtain an IHTS algorithm. The specific process is shown in Fig. 5.
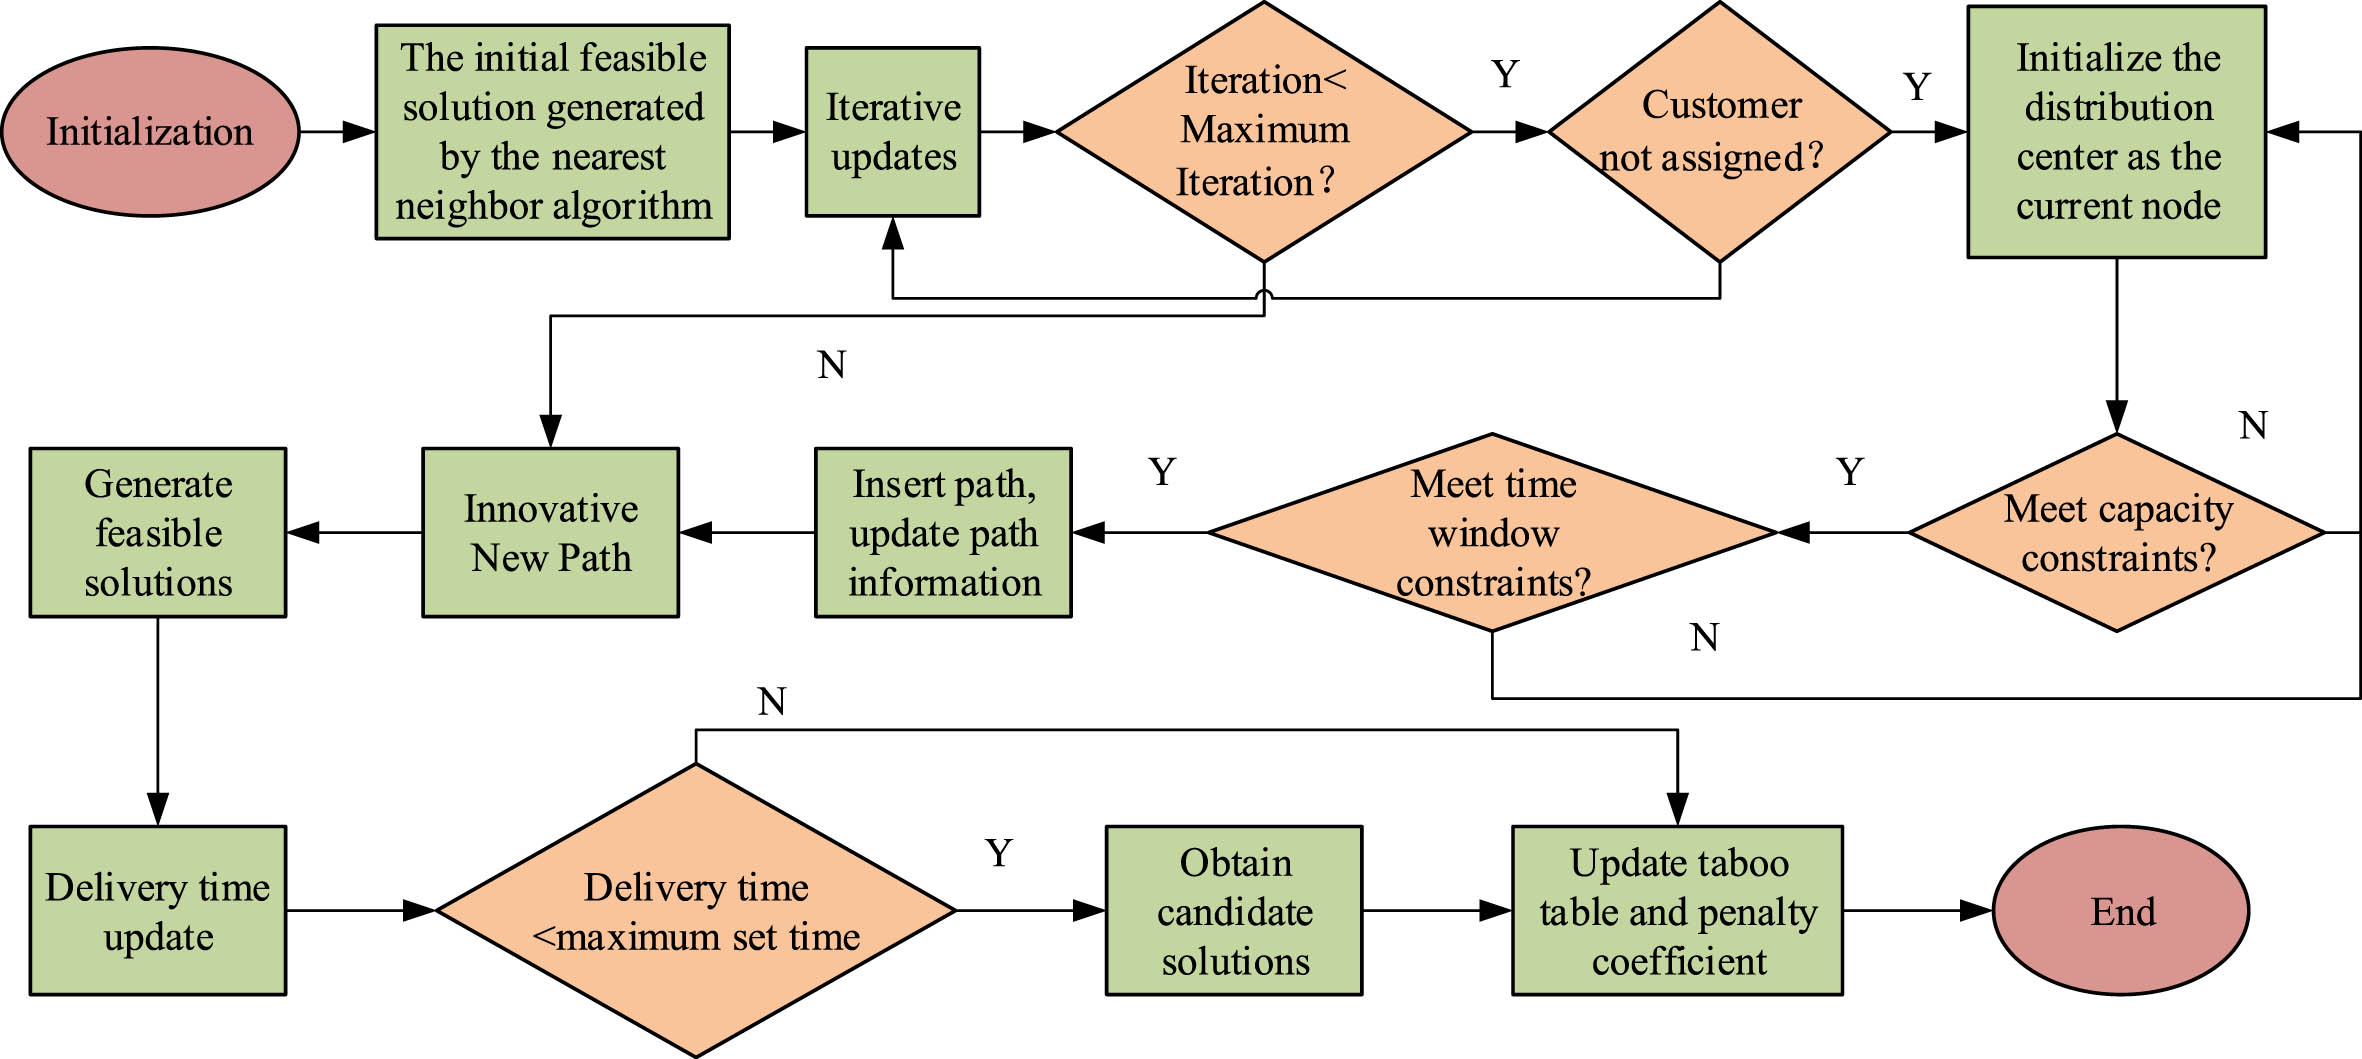
Flowchart of the hybrid taboo search algorithm.
Based on the analysis above, the nearest neighbor algorithm and the adaptive taboo search algorithm are used to solve the logistics vehicle scheduling model in the real-time scheduling framework based on RFID. The data acquisition method used in the research can be obtained through deploying RFID tags on various locations and items that need to be tracked. For example, in the logistics industry, RFID tags may be installed in warehouses, distribution points, and on each delivery vehicle. The RFID reader emits radio frequency signals, and when these signals encounter RFID tags, the tags return a unique serial number. The RFID reader then reads the data stored in the tag, which may include information such as travel distance, speed, and loading condition. After reading the data, the RFID reader immediately transfers the data to the main database or application. This enables real-time tracking and scheduling of logistics vehicles.
The research analyzed the performance of the logistics transportation routing optimization and scheduling model based on RFID technology and verified it through case studies. The specific experimental environment was as follows. CPU frequency was 2.80 GHz, memory was 8GB, and the operating system was Windows 10. The research evaluated the model performance based on indicators such as task completion, task queueing time, total transportation resources, number of unfinished tasks, and transportation cost. The technology was also applied in practical logistics applications. Comparative experiments were conducted by comparing the results of the First-Come, First-Served (FCFS) algorithm with the Self-Adaptive Back-Propagation Neural Network (SABP) algorithm to validate the advancement of the model [Reinegger et al., 2021; Chen et al., 2021].
Performance analysis of the logistics transportation scheduling model
The main station was located at the logistics hub of the city, while the sub-stations were distributed in different areas of the city, including commercial, residential, and industrial areas. Some of these sub-stations were located at the city boundary and were responsible for handling the transfer of goods between the city and suburban areas. All vehicles were equipped with advanced GPS tracking and navigation systems, which could achieve real-time route optimization. RFID readers were installed inside the vehicle to track cargo information in real-time. The specific settings of the stations and the decision-making operation effect of RFID are shown in Fig. 6.

Station settings and decision system operation.
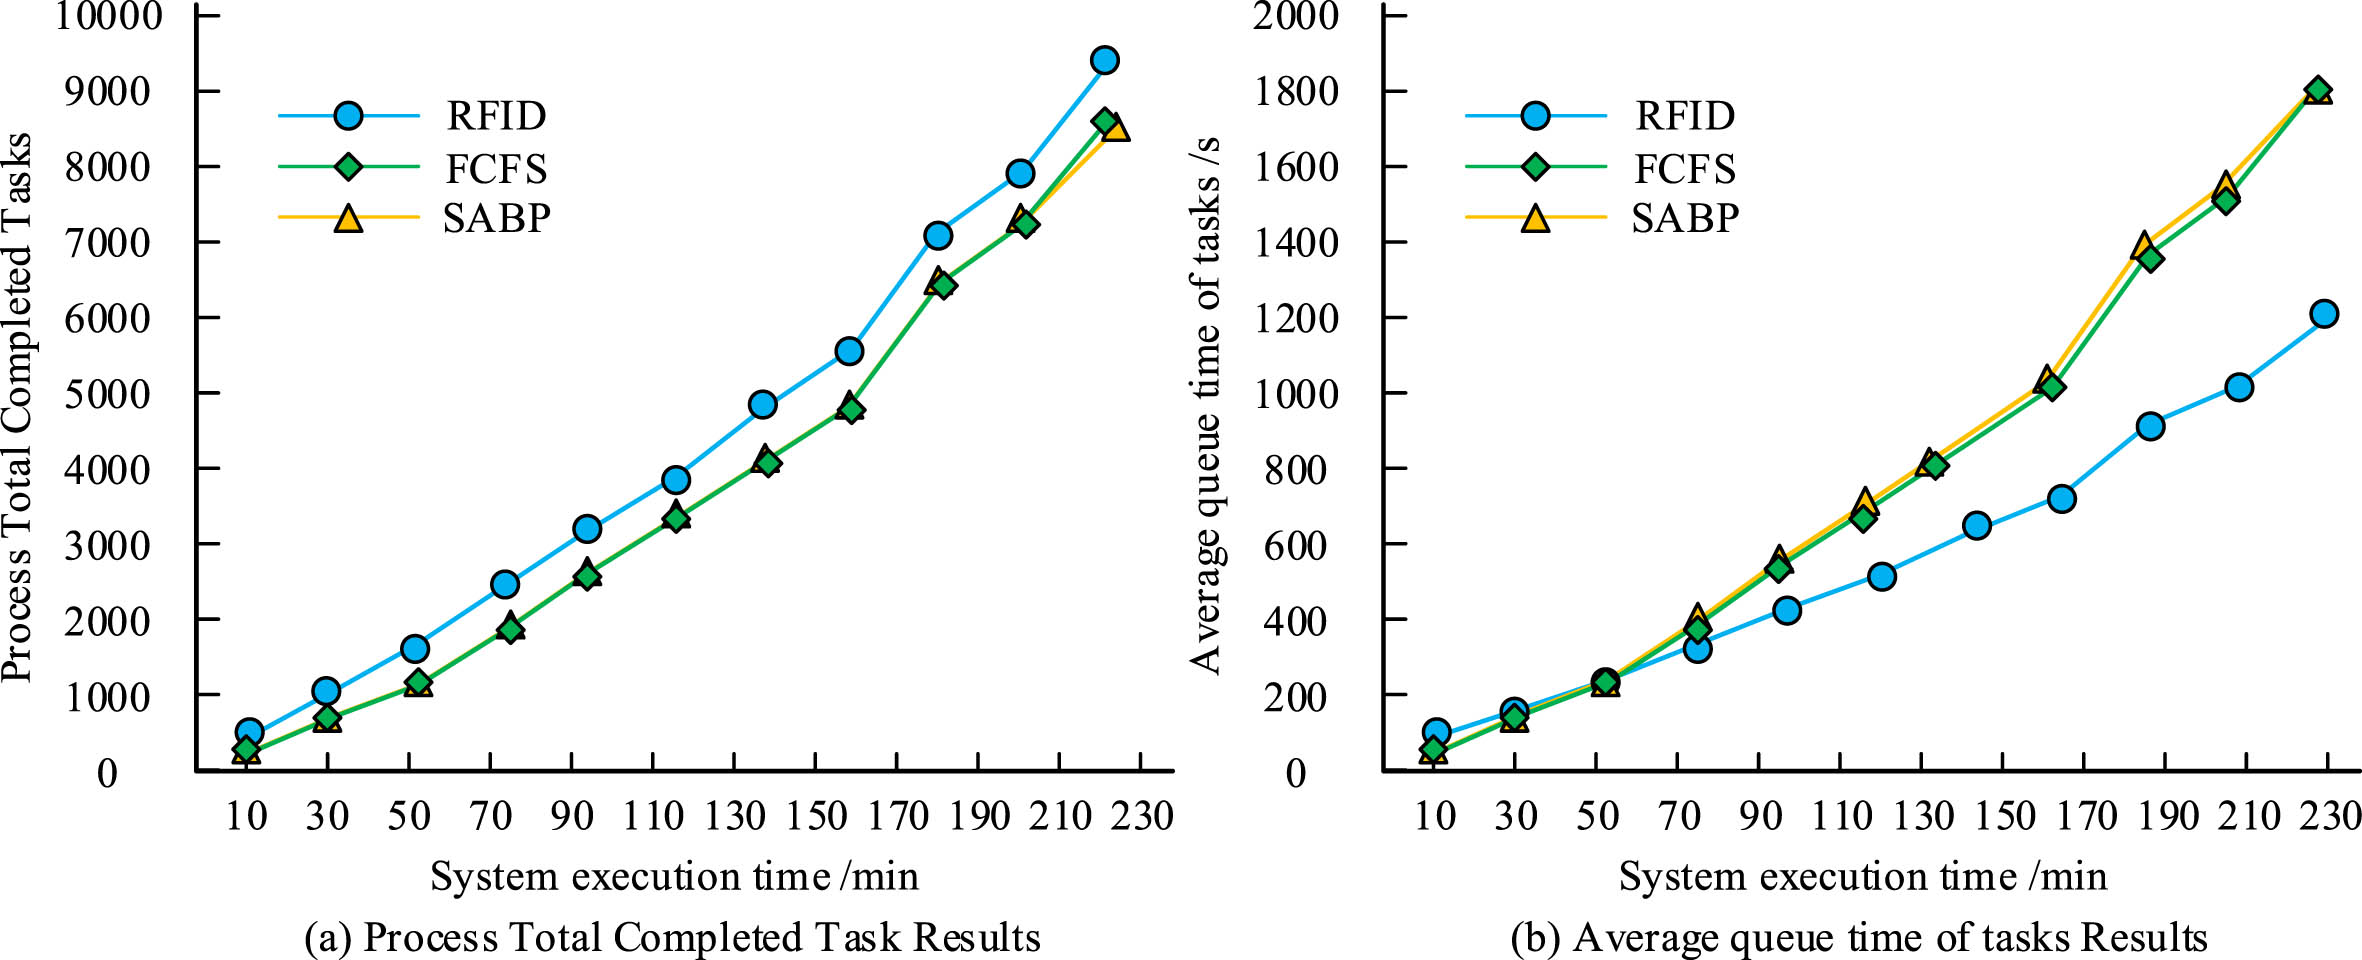
The experiment was conducted based on the station settings in Fig. 6. The logistics distribution had a continuous working time of 4 hours, and tasks were selected from the queue for processing using the scheduling algorithm. The results of the model in terms of the number of completed tasks and the average queueing time are shown in Fig. 7.
Performance analysis of task scheduling algorithm.
Figure 7(a) shows the total number of tasks processed by the model over a certain period of time. With the increase in system execution time, the number of tasks processed by the RFID technology proposed in the research also increased. When the system execution time was 230 s, the number of tasks processed was around 9200, which was the highest among the compared algorithms in terms of processing efficiency. Figure 7(b) shows the average queuing time for task completion over a certain period of time. The RFID technology proposed in the research had the least queuing time compared to the compared algorithms, with a reduction of approximately 600 s compared to the compared algorithms. The results showed that the scheduling algorithm using RFID technology had significant advantages in handling tasks and reducing queuing time, showing higher efficiency and better performance. This indicated that in practical applications, the use of RFID technology for task scheduling might greatly improve the processing capacity of the system and the overall quality of service. To further validate the feasibility of the model, the total transportation resources and the number of unfinished tasks were analyzed, as shown in Fig. 8.

Results of transportation resources and unfinished tasks in the scheduling model.
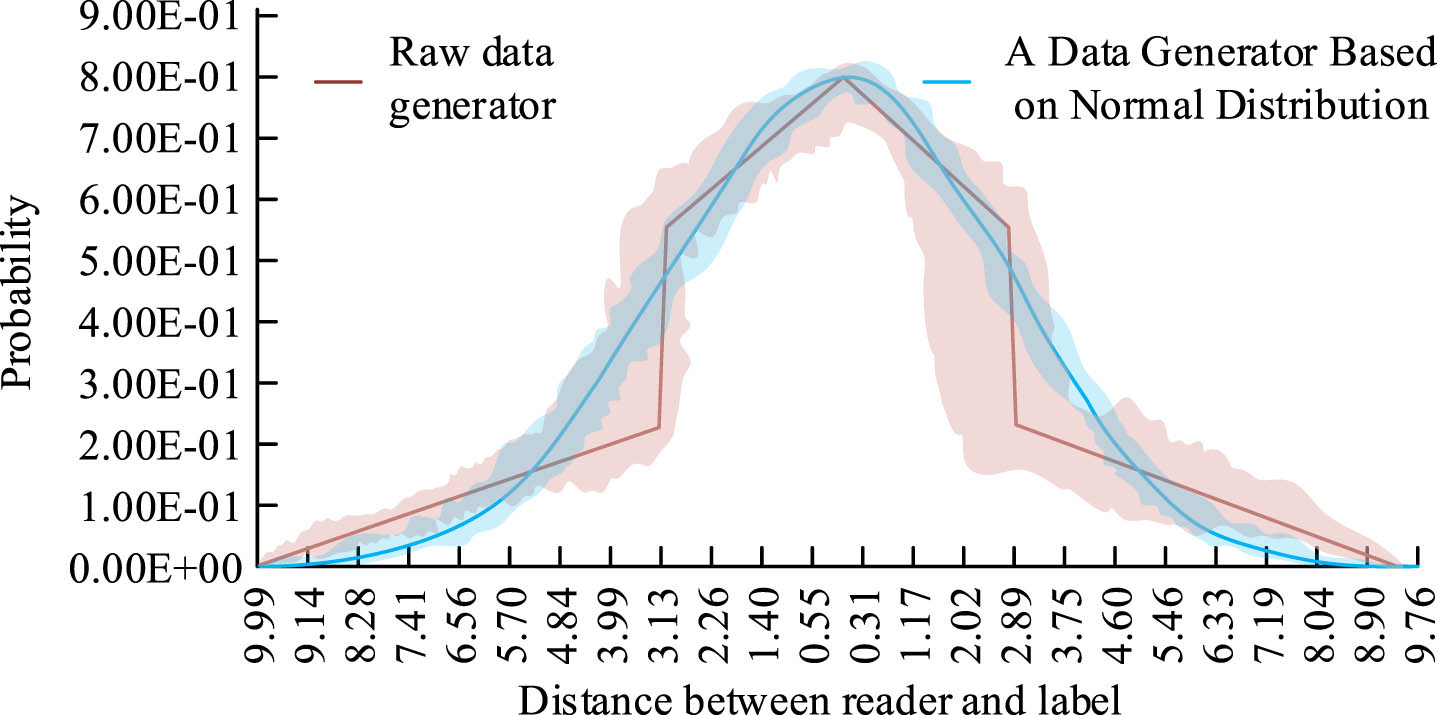
Figure 8(a) shows the results of transportation resources in the model. The total transportation resources for FCFS and SABP were almost the same, while the research method had a clear advantage. When the system execution time was around 230 s, the model’s total transportation resources reached around 23500 units, compared to around 22000 units for other algorithms. Figure 8(b) shows the results of the unfinished tasks in the model. The research method reduced the unfinished tasks by approximately 700 compared to other algorithms. In the performance analysis of the model, the research also conducted a validity analysis of the data generator model. As described in the method, the reader was used as a deployed coordinate point, with a reading range of 10 m and an interrogation cycle of 25 ms. The results showed that the model had significant advantages in the utilization efficiency of transportation resources and task processing efficiency, especially in reducing unfinished tasks and improving the utilization of transportation resources. The tag’s movement speed was 0.0005 m/ms, and the probability of tag recognition was 0.8 due to its own factors. The probability of the reader recognizing moving tags is shown in Fig. 9.
Results of the data generator model’s validity.
In Fig. 9, the probability variation of the original data generator showed a linear change with two segments exhibiting vertical changes, indicating significant fluctuations in the data generator. The research used a data generator with a normal distribution, which showed a curved change with a slow and small fluctuation, indicating a more realistic data generation method. The key difference between the two methods was that the data generated by the original data generator had great fluctuation and instability, while the data generated by the normal distribution could produce the data that changed more smoothly and were closer to reality. This is very valuable for improving the authenticity and reliability of the data model.
The research selected the logistics transportation of a well-known logistics company and conducted an instance analysis in City C. The area selected had 15 sub-stations served by a distribution center. The constraints under this condition included capacity and soft time window. The distribution center was set as point 0, and the other sub-stations were represented by points 1 to 15. The specific logistics distribution and service information are shown in Fig. 10.
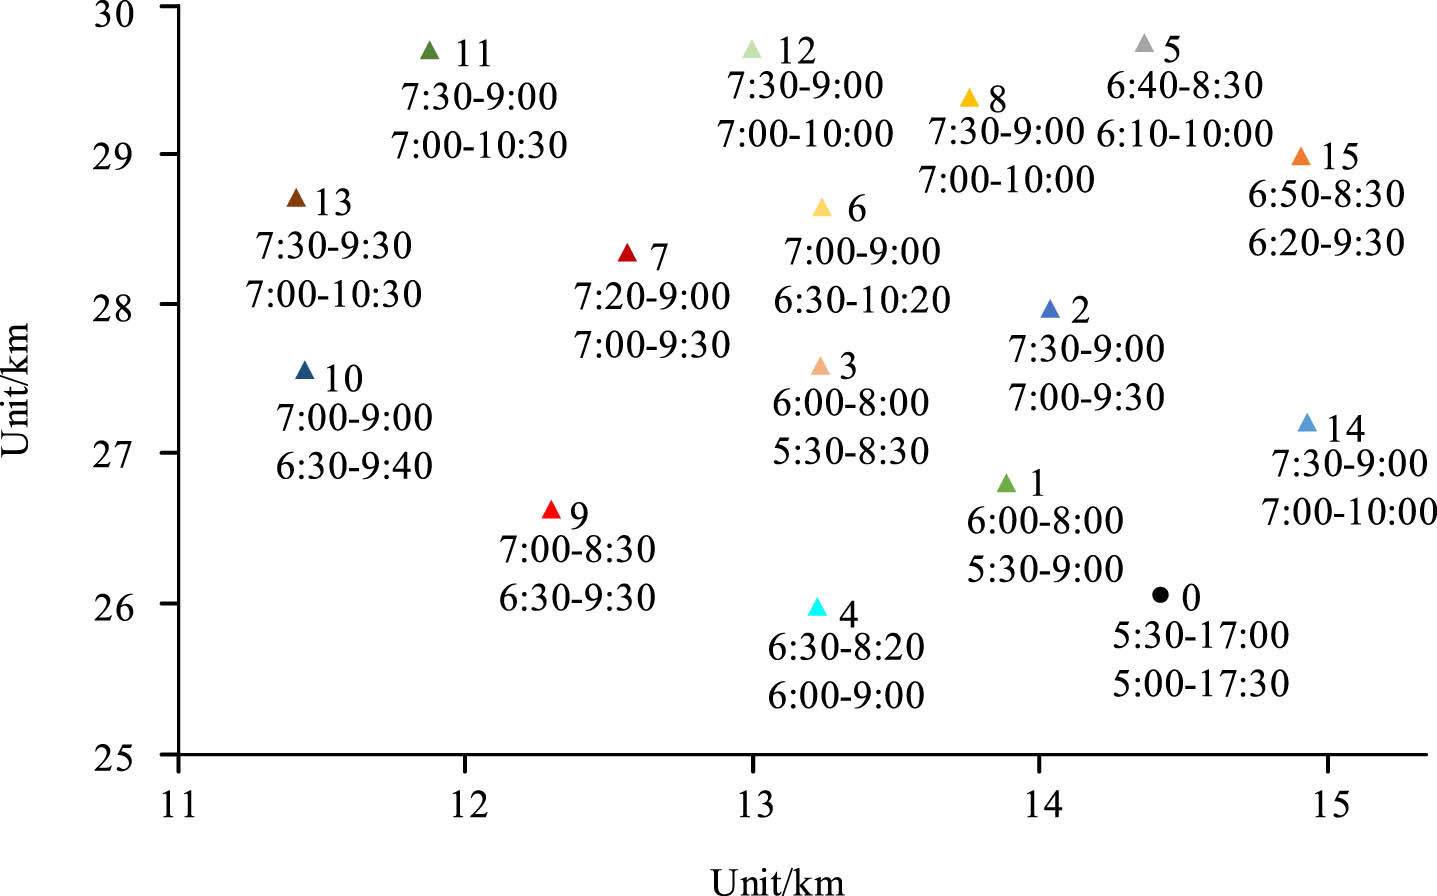
Distribution map of logistics stations and soft time window constraints.
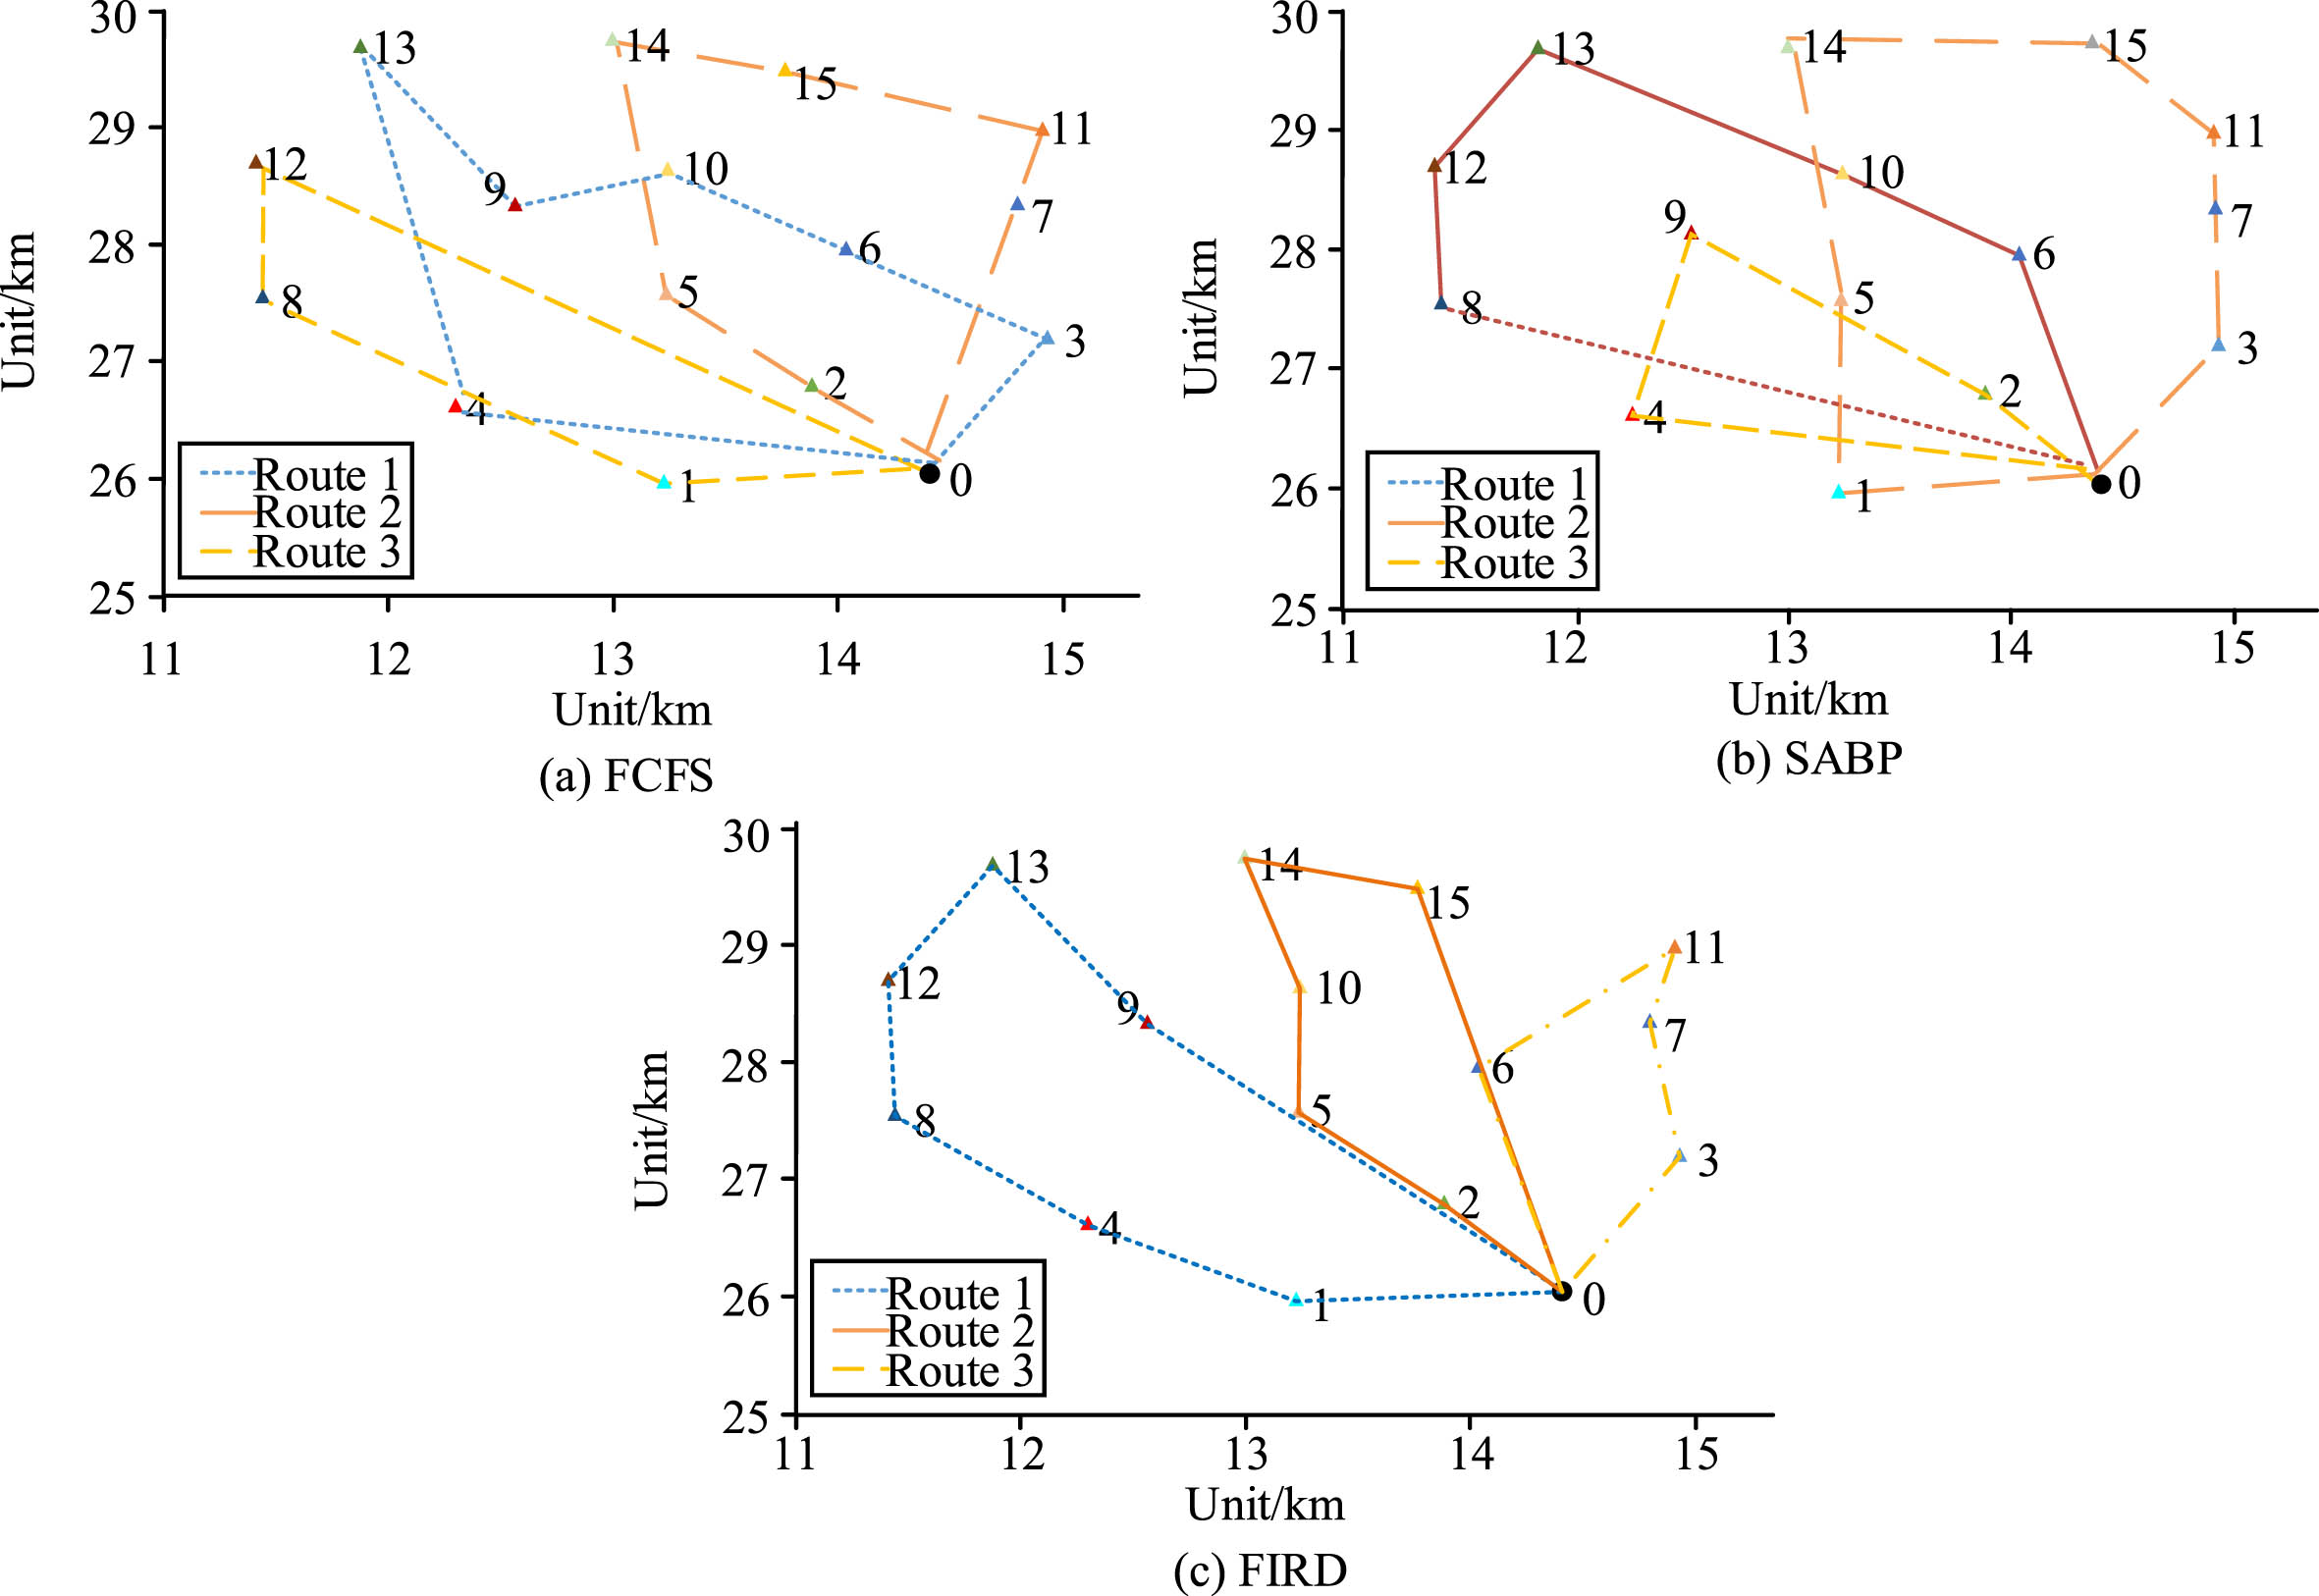
In Fig. 10, the numbers represented sub-stations, and the labeled information represented the desired and acceptable time windows. The logistics delivery speed was set at 40 km/h, the transportation cost was 1 yuan/km, the labor cost was 300 yuan/day, the cargo damage ratio during transportation was set at 0.014, and the penalty cost was 100 yuan/h. The research calculated and analyzed the optimal route and transportation cost using three different algorithms, as shown in Fig. 11.
Optimal route planning and transportation cost under different algorithms.
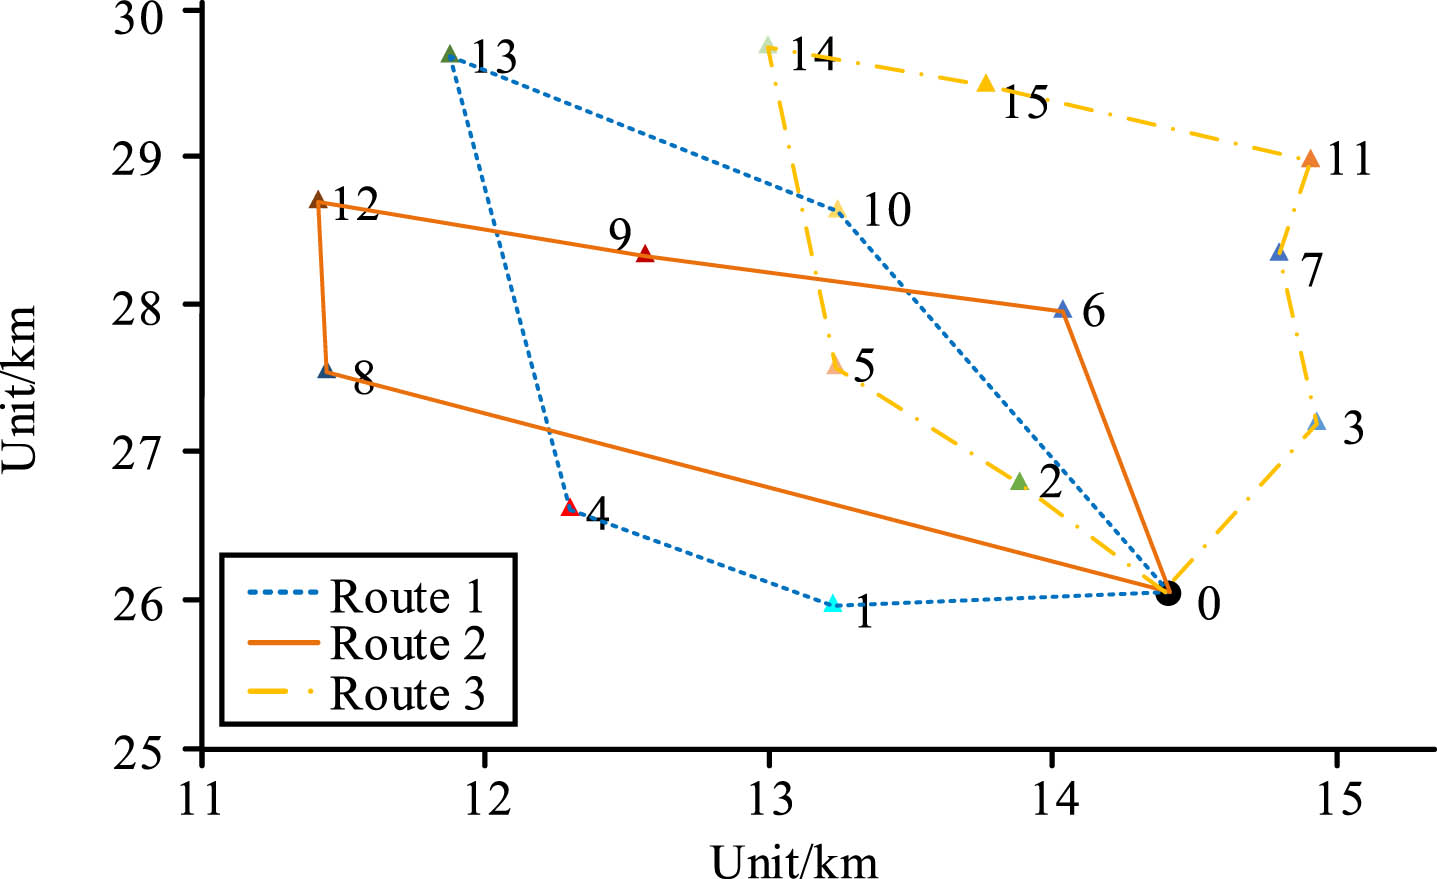
In Fig. 11, path 1 represented the path of logistics vehicle 1, path 2 represented the path of logistics vehicle 2, path 3 represented the path of logistics vehicle 3, and the cost sum of the three paths reflected the effect of model path planning. Figure 11(a) showed the optimal logistics delivery routes using the FCFS algorithm, which were 0-1-8-12-0, 0-4-13-9-10-6-3-0, and 0-2-5-14-15-11-0. In this solution, the total transportation cost was 5450.9 yuan. Figure 11(b) showed the optimal logistics delivery routes using the SABP algorithm, which were 0-4-9-2-0, 0-8-12-13-10-6-0, and 0-1-5-14-15-11-7-3-0. In this solution, the total transportation cost was 5362.7 yuan. Figure 11(c) showed the optimal logistics delivery routes using the RFID technology, which were 0-1-4-12-13-9-0, 0-2-5-10-14-15-0, and 0-6-11-7-3-0. In this solution, the total transportation cost was 4655.8 yuan. The results indicated that the research method had fewer overall routes and more organized and concise route planning compared to other algorithms. The research conducted the same analysis for the model with the introduction of RFID technology, and the comparative results were shown in Fig. 12.
Performance analysis of the model without RFID technology.
Figure 12 represents the logistics results without the introduction of RFID technology. The optimal logistics delivery routes were 0-1-4-13-10-0, 0-8-12-9-6-0, and 0-2-5-14-15-11-7-3-0. In this solution, the total transportation cost was 6257.6 yuan. Comparing these results, the use of RFID technology effectively controlled the total transportation cost and allowed for more reasonable planning of logistics delivery routes, bringing practical commercial value to the logistics field.
In conclusion, this paper presented a logistics scheduling model with an RFID framework to optimize routing using adaptive metaheuristics. Experiments have shown the proposed techniques can handle increased tasks with lower queueing time compared to other algorithms. In the case study, the model optimizes the routes to reduce costs by over 25% compared with the route with RFID only. The results demonstrate promising capabilities to improve logistics efficiency through integrating RFID data with intelligent optimization algorithms. Overall, this research provides an important step toward leveraging emerging technologies like RFID to tackle logistics challenges. The proposed technique offers valuable insights for both researchers and logistics companies. However, in logistics transportation, due to various reasons, such as traffic congestion, equipment failures, emergencies, etc., the original route may not be implemented, which is precisely the limitations of this study. Therefore, the future development direction can be to study methods for dynamic path adjustment, that is, to adjust the path based on real-time conditions to ensure the smooth progress of logistics transportation.
Footnotes
Acknowledgment
Henan Province Science and Technology Research Project.
Project number: 222102210221.