
Abstract
Background:
Many studies are currently researching the effects of video games, particularly in the domain of cognitive training. Great variability exists among video games however, and few studies have attempted to compare different types of video games. Little is known, for instance, about the cognitive processes or brain structures that underlie learning of different genres of video games.
Objective:
To examine the cognitive and neural underpinnings of two different types of game learning in order to evaluate their common and separate correlates, with the hopes of informing future intervention research.
Methods:
Participants (31 younger adults and 31 older adults) completed an extensive cognitive battery and played two different genres of video games, one action game and one strategy game, for 1.5 hours each. DTI scans were acquired for each participant, and regional fractional anisotropy (FA) values were extracted using the JHU atlas.
Results:
Behavioral results indicated that better performance on tasks of working memory and perceptual discrimination was related to enhanced learning in both games, even after controlling for age, whereas better performance on a perceptual speed task was uniquely related with enhanced learning of the strategy game. DTI results indicated that white matter FA in the right fornix/stria terminalis was correlated with action game learning, whereas white matter FA in the left cingulum/hippocampus was correlated with strategy game learning, even after controlling for age.
Conclusion:
Although cognition, to a large extent, was a common predictor of both types of game learning, regional white matter FA could separately predict action and strategy game learning. Given the neural and cognitive correlates of strategy game learning, strategy games may provide a more beneficial training tool for adults suffering from memory-related disorders or declines in processing speed, particularly older adults.
Video games have generated a lot of interest in recent years as a potential tool for cognitive training, yet little is known about how these video games are associated with various cognitive functions and underlying brain structure. When researchers use video games as a tool for cognitive enhancement, they assume that game performance relies on specific cognitive/brain functioning, yet there is little evidence that establishes such connection between video game performance, cognitive functioning, and brain structure. This is an important gap in the literature that needs to be addressed before video games are used as cognitive training tools. Moreover, different researchers use different genres of video games, which makes this game-cognition-brain relationship even more complicated. Therefore, the aim of the current study was not only to evaluate the three-way game-cognition-brain relationship, but also to assess this relationship for two different types ofgames.
Action games were among the first to be studied and have dominated the literature so far. Green and Bavelier (2003) discovered that action video game players outperformed novices on a range of visual attention tasks, a finding now well replicated (Chisholm, Hickey, Theeuwes, & Kingstone, 2010; Clark, Fleck, & Mitroff, 2011; Feng, Spence, & Pratt, 2007; Green & Bavelier 2006a, 2006b, 2007; Li, Polat, Makous, & Bavelier, 2009; Li, Polat, Scalzo, & Bavelier, 2010; West, Stevens, Pun, & Pratt, 2008). In addition, non-gamers trained to play action video games have been shown to improve on untrained tasks of visuo-spatial attention (Feng et al., 2007; Li et al., 2009; Green & Bavelier 2003, 2006a, 2006b, 2007; Green, Pouget, & Bavelier, 2010; Li et al., 2010), though some studies have failed to find such transfer effects (e.g. Boot, Kramer, Simons, Fabiani, & Gratton, 2008; see Boot, Blakely, & Simons, 2011 for a review) and others suffer from methodological issues (see Simons et al., 2016 for a review).
Before they were considered for their cognitive benefits, video games were hypothesized by many researchers to be linked with aggression (e.g., Dominick, 1984; Lin & Lepper, 1987), though evidence for such an association was highly mixed (Griffiths, 1999; Sherry, 2001). In an ongoing debate that has now raged for three decades, some studies have found a relationship between “violent video games” and aggressive behavior/affect (see Anderson et al., 2010; also note the APA’s policy statement on violent video games; American Psychological Association, 2015), while others argue that the relationship is minimal or non-existent (see Ferguson, 2015; also note the open statement signed by 230 scholars in opposition to the APA’s policy statement on violent video games; Przybylski, 2016). Most games that would be classified as “violent” would also be categorized as action (e.g. “beat ’em ups,” “shoot ’em ups,” and “platform blasters”; Griffiths, 1999). It is interesting that the same games are referred to as “violent”, when being discussed in a negative context (i.e. aggression literature), and “action”, when being discussed in a positive context (i.e., training literature). This varied use of emotional language when categorizing similar games may reflect a bias by researchers in both respective fields.
All games are not created equal. Many different genres of games exist, each utilizing a range of diverse mechanics. Some genres, although less studied, may provide a more viable means of cognitive improvement. Strategy games, for example, have been linked with better problem-solving skills and higher grades in adolescents (Adachi & Willoughby, 2013). Players of real-time strategy (RTS) games had faster reaction times than FPS players and non-gamers during a task-switching task (Dobrowolski et al., 2015). Novices trained on real-time strategy (RTS) games have shown improvements in higher-order cognitive skills, such as, cognitive flexibility in younger adults (Glass, Maddox, & Love, 2013), and executive control, reasoning and working memory in older adults (Basak, Boot, Voss, & Kramer, 2008).
Interestingly, older adults show marked deficits, compared to younger adults, in many higher-order cognitive skills (e.g., processing speed; Schaie, 1996; episodic memory; Nilsson, 2003; Salthouse, 2003; working memory; Bopp & Verhaeghen, 2005; spatial orientation; Schaie, 1996; Sliwinski & Hall, 1998; reasoning; Schaie, 1996; and task switching; Verhaeghen, Steitz, Sliwinski, & Cerella, 2003). Out of all computerized training approaches, video game training showed the largest effects on improving cognition in the elderly (Hedge’s g = 0.22; Lampit et al., 2014), although there were only four studies reported in this meta-analysis. A recent strategy game training study on older adults also found benefits to working memory and episodic memory (Toril et al., 2016). These data suggest that video games are gaining popularity as training tools in older adults, yet not much is known about the underlying brain structure and cognition that influence learning of these complex games.
Based on these findings, we hypothesize that the different mechanics employed while playing different types of video games engage an equally diverse range of cognitive processes. Yet few attempts have been made to compare the cognitive mechanics involved in playing different types of games. One such attempt has explored the game-cognition relationship, where younger adults briefly played (∼10–15 mins for each game) twenty different casual games and performed cognitive tasks (Baniqued et al., 2013). The 20 games separated on five components of a principal components analysis, each emphasizing different cognitive constructs. Moreover, training on different games has shown to improve different cognitive skills in younger adults (Oei & Patterson, 2013). The current study examined complex skill learning in two different types of video games, one action and one strategy, over a longer period of time (1.5 hours for each game) compared to Baniqued et al. Also, unlike the previously mentioned studies, our sample spans the adult lifespan, including both younger and older adults. In addition to cognition, the current study also examined the relationship between game learning and brain structure (i.e., white matter integrity). We used fractional anisotropy (FA), obtained by diffusion tensor imaging (DTI), as a measure of white matter integrity.
The main goal of this study was to dissociate the cognitive and structural mechanisms related to action game learning from those related to strategy game learning, with the intent of informing future training interventions. We hypothesized that action games rely more on visual attention and perceptual detection based on prior studies (Green & Bavelier, 2003, 2006a, 2006b, 2007). In contrast, we hypothesized that strategy games require more cognitive control, a higher-order cognitive skill, not only in younger adults based on their cognition-game relationships (Baniqued et al., 2013) and on their training-related gains to these skills (Glass et al., 2013), but also in older adults based on the randomized controlled trials using strategy games (Anguera et al., 2013; Basak et al., 2008; Toril et al., 2016). Therefore, we included three tasks each of cognitive control (random 2-update, task switching, and backward span) and visual attention/perception (cued-discrimination, DSST, and enumeration) to test ourhypotheses.
To our knowledge, this is the first study to evaluate the relationship between white matter integrity, cognition and complex learning of not one, but two types of video games.
Methods
Participants
The Lifespan Neuroscience and Cognition (LiNC) Laboratory at the University of Texas at Dallas recruited both younger and older adults to participate in a video game study. Data analyses were conducted on 62 adults, 31 younger (18 females; M age = 25.84, SD age = 4.52; M education = 16.85, SD education = 2.08) and 31 older (19 females; M age = 65.84, SD age = 6.77; M education = 15.77, SD education = 1.88), who had completed all cognitive tasks, learned both games, and were scanned using DTI.
Because we are assessing game learning in this study, we specifically recruited novice gamers who had minimal gaming experience at baseline. All participants completed an extensive survey (Basak et al., 2008) on their video game playing habits during the past year. On average, the older adults reported playing less than 1 hour of video games per week, and reported playing action and strategy games with similar frequency (i.e., never). The younger adults reported playing 1–3 hours of video games per week on average, and likewise reported playing action and strategy games with similar frequency (i.e., seldom). Participants were also asked about the frequency with which they played other types of video games, such as casual, simulation, role-playing, sports, and traditional (Tetris, solitaire, free cell, etc.) games. Young adults reported playing these genres either seldom or never on average, and older adults reported playing all categories never onaverage.
All participants were right handed, had normal or corrected-to-normal vision (minimum visual acuity of 20/30), and were required to pass the Ishihara Color Vision test. All participants were highly proficient in speaking and reading English. No participants reported a history of stroke and older participants had a Mini Mental Status Examination (MMSE; Folstein, Folstein, & McHugh, 1975) score of more than 26, indicating normal cognitive functioning.
Procedure
Participants learned to played two different types of short video games, an action game and a strategy game, with each game taking about 7 mins to play. Participants played these games for 3 hours (1.5 hours/game), resulting in about 27 games on average (∼13 games for action, and ∼14 for strategy). The participants also completed an extensive cognitive battery, which constituted of paper and pencil surveys and computerized assessments. Game playing and computerized cognitive assessments were conducted on a Dell computer running Windows 7 Professional 64-bit Operating System with an Intel 5-core processor, 4 GB of ram, and an attached Dell monitor with 1920×1080 pixel resolution and a 21.5 inch LCD display. Before the game learning and cognitive assessment sessions occurred, MRI scans were collected for each participant. These scans included diffusion-weighted images from a 30-direction DTI scan.
Measures used
Video games
The two games used, one action and one strategy, are free-to-play flash games that can be found on miniclip.com. Tank Attack 3D is an action game where the player operates a tank. The objective is to survive until you reach the rendezvous point. To do so the player must aim and shoot at the enemy targets whilst avoiding to shoot civilians. See Fig. 1A for a screenshot from this game.

(A) A screenshot from Tank Attack 3D (miniclip.com). Enemy targets are marked with red arrows. Neutral targets are marked with white arrows. The objective is to destroy all enemy targets. Bonus points are awarded for destroying satellites, one of which is shown in the screenshot above. (B) A screenshot from Sushi-Go-Round (miniclip.com). Customers come in and sit at the bar as shown. The sushi they desire is shown above their heads. The ingredients used to make the sushi are on the bottom left of the screen. The recipe book is shown in pink on the bottom right of the screen, and can be used to identify which ingredients make which type of sushi. When the ingredients run out, the blue phone in the bottom right of the screen must be used to order more. The dishes shown in front of each customer may be filled with soy sauce, and must be cleaned after the customer leaves.
Sushi-Go-Round is a strategy game where the player takes on the position of a sushi chef. As the customers arrive and place orders, the player must mix the proper ingredients to make the desired sushi rolls. As customers leave, the player must remember to clean up after them so that new customers can take their place. When ingredients run out, the player must call and order additional supplies. Customers arrive quickly so the game requires the player to act fast in order to keep up; remembering the ingredients to the different types of rolls aids the player immensely, as looking up the recipes can be cost the player much needed time. See Fig. 1B for a screenshot from this game.
Playing time for the individual games are quite short (∼7 min), which allowed participants to play many games in the allotted time. The total number of games played for Tank Attack 3D (M overall = 13.18, SD overall = 2.97; M young = 11.48, SD young = 1.18; M old = 14.93, SD old = 3.26) was comparable to the total number of games played for Sushi-Go-Round (M overall = 14.23, SD overall = 3.37; M young = 11.45, SD young = 1.21; M old = 17.10, SD old = 2.28). The average amount of time spent on each game of Tank Attack 3D (M overall = 7.14 min, SD overall = 1.47 min; M young = 7.92 min, SD young = 0.90 min; M old = 6.33 min, SD old = 1.51 min) was comparable to the average amount of timespent on each game of Sushi-Go-Round (M overall = 6.68 min, SD overall = 1.58 min; M young = 7.96 min, SD young = 1.02 min; M old = 5.35 min, SD old = 0.71 min). The order in which the participants played each game was counterbalanced across participants.
Two outcome measures were observed for each game. The first was the highest level reached by the participant in the specific game (higher levels provided increased difficulty in both games). The second was the participant’s learning rate for each game, which was calculated by fitting a logarithmic function to each participant’s scores (higher scores reflected better performance in each game) for each game played (y = b * ln(x) + a, where b is the learning rate). The slope (b) was used as an index of learning, where shallow slopes meant the participant improved little after 1.5 hours of gameplay and steeper slopes were indicative of greater improvement and faster learning. Past research has conducted similar treatment to calculate learning rates in both commercial (Basak et al., 2011) and experimenter-developed video games (e.g., Boot et al., 2010), as well as in experimenter-developed working memory tasks (Basak & O’Connell, 2016).
The average learning curves for younger and older adults on both games are plotted in Fig. 2. On average, the younger adults learned how to play both Tank Attack 3D and Sushi-Go-Round much faster than the older adults. Older adults incurred more losses, which resulted in shorter time spent on each game on average and more games played on average because it generally takes longer to win a game than it does to lose one.
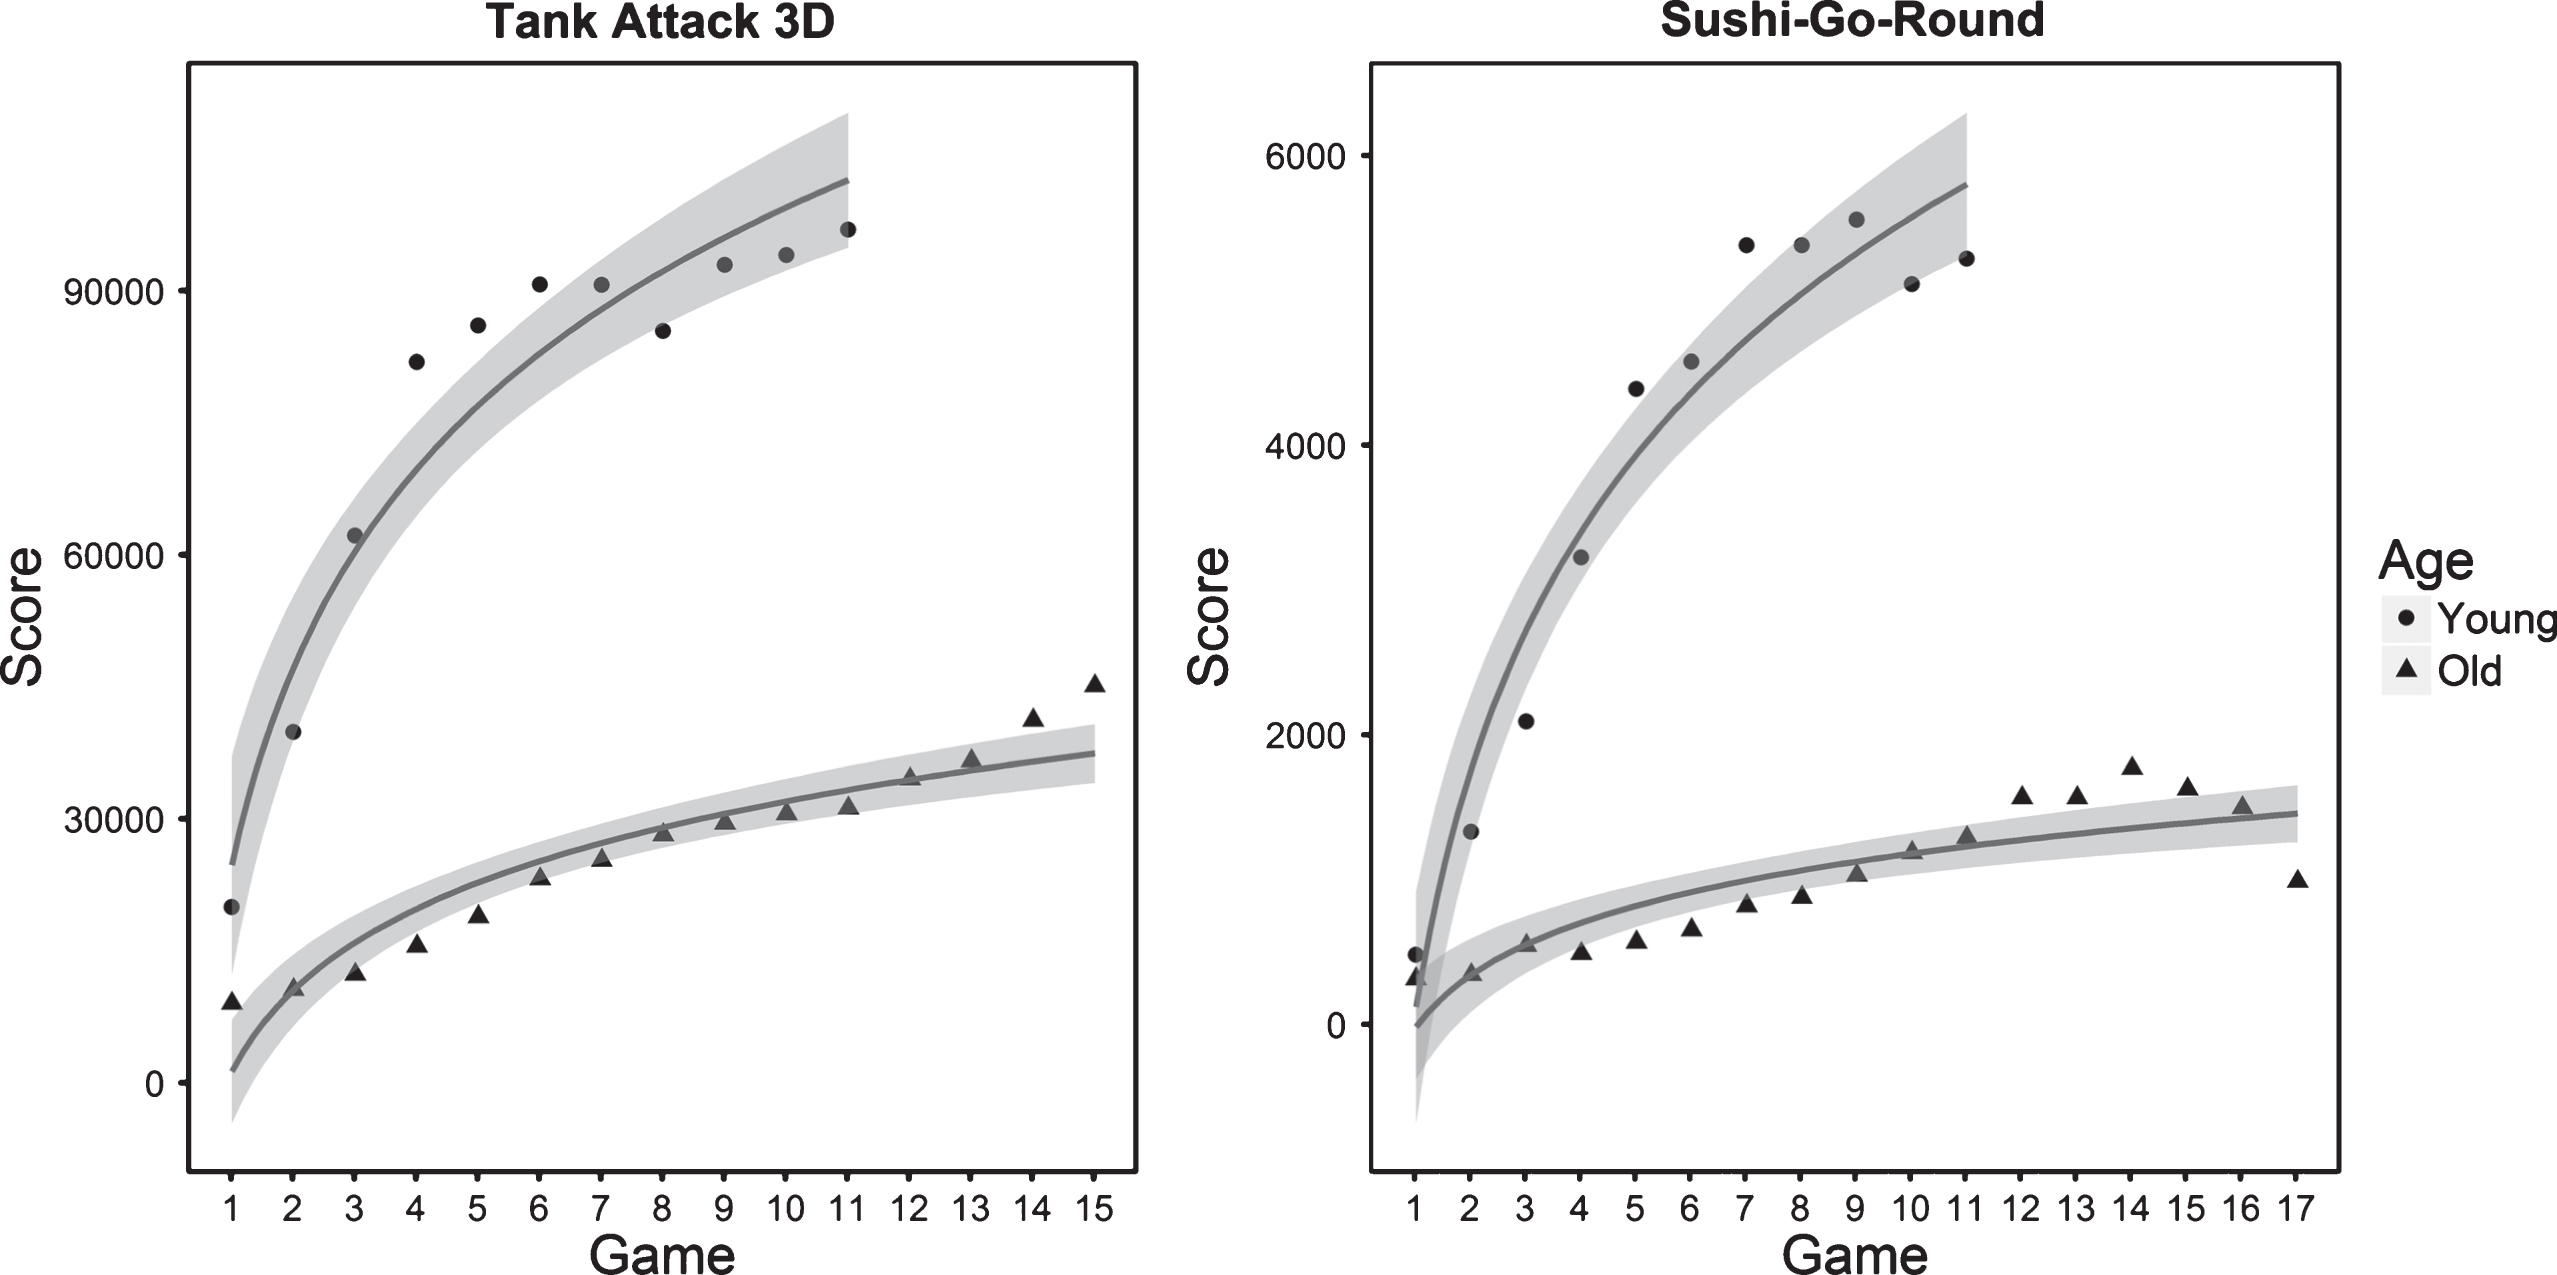
Average scores for each game of Tank Attack 3D and Sushi-Go-Round played by younger and older adults. Lines were fitted to each age-group’s scores using a logarithmic function (y = b * ln(x) + a), with b representing the slope of the function. Younger adults displayed greater learning than older adults, indicated by the steeper slopes. Note that the score values are relative to each game and should not be compared across games.
1. Cued-discrimination
In this spatial cued-discrimination task (Posner, 1980), participants responded to arrows on the screen. They were told to press the “Q” button if the arrow was pointing left or to press the “P” button if the arrow was pointing right. In valid trials, the arrow would appear on the left side of the screen while pointing left or on the right side of the screen while pointing right. In invalid trials the arrow would appear on the left side of the screen while pointing right or on the right side of the screen while pointing left. Additionally, in neutral trials, the arrow would appear in the middle of the screen. Participants were asked to fixate their eyes in the center of the screen. Covert shifts of spatial attention were measured by subtracting the average reaction time (RT) on the valid trials from the average RT on the invalid trials. RTs were only analyzed from trials where the participant responded correctly.
2. Random 2-Update
In this version of the random n-back task, used by Basak and Verhaeghen (2011), participants were presented with single digits, in either yellow or pink font, for 1450 ms and had to compare each digit to the last digit seen in the same color. This version of the task is unpredictable because the digits were presented in a random color order, meaning that either of the two colors could show up in any temporal order within the block (after the initial items for each color); there is no discernable pattern. This task was completed during the MRI scan. Accuracies were observed for switch trials (when the color of the previous digit was different from the color of the current digit) and nonswitch trials (when the color of the previous digit was the same as the color of the current digit).
3. Task Switching
Participants were shown a single digit on the screen for 1.5 s and were asked to make one of two judgments via button presses. If the digit appeared on a blue background the participant had to decide whether the digit was higher or lower than 5. If the digit appeared on a pink background the participant had to decide whether the digit was odd or even. The digit “5” was never shown. In the two single task blocks, participants saw the digit in only one of the two background colors. In the two dual task blocks, the background color switched throughout the task so that the participant had to switch back and forth between the two tasks. This task was also completed in the scanner. A local switch cost was calculated for each participant by subtracting his/her RT on nonswitch trials in the dual task blocks (when the background color of the previous digit was same as the background color of the current digit) from his/her RT on switch trials in the dual switch blocks (when the background color of the previous digit was different from the background color of the current digit). RTs were only analyzed from trials where the participant responded correctly.
4. Forward Span
Participants were verbally presented with a list of digits, which they repeated back to the experimenter in the exact order in which they were presented. The set size started at four digits and increased by one after every two sets until the participant missed two sets in a row. Forward span was measured as the largest set size to which the participant was able to accurately respond.
5. Backward Span
Participants were verbally presented with a list of digits, which they repeated back to the experimenter in the reverse order in which they were presented. The set size started at two digits and increased by one after every two sets until the participant missed two sets in a row. Backward span was measured as the largest set size to which the participant was able to accurately respond.
6. Digit Symbol Substitution Test (DSST)
A test used in the Wechsler Adult Intelligence Scale (WAIS; Wechsler, 1958), where a set of symbols was shown at the top of a page of paper, each with its own corresponding digit (0–9). Boxes were shown on the remainder of the page. The top of each box contained a digit whereas the bottom of each box was empty. Participants were given 30 seconds to complete as many of the lower boxes as they could by filling in the corresponding symbol.
7. Enumeration
In this perceptual task (Basak et al., 2008), one to eight dots were presented on the computer screen, after which participants reported as rapidly as possible how many dots they saw by pressing the corresponding number key on the numerical keypad. Subitizing speed, indicative of automatic or nearly-automatic perception of items in the focus of attention (Basak & Verhaeghen, 2003), was calculated by averaging each participants RT for 1, 2, and 3 dots. Counting speed, a measure of controlled processing, was calculated by averaging each participants RT for 6, 7, and 8 dots.
Diffusion tensor imaging and analysis
Participants were scanned using a 3 Tesla MRI magnet. DTI scans were performed using a single-shot spin-echo echo planar imaging sequence with the following parameters: scan duration = 217 sec; repetition time = 4410 ms; echo time = 51 ms; flip angle = 90°; scan resolution = 112×110; field of view = 224 mm×224 mm; number of slices = 50; slice thickness = 2 mm; voxel size = 1.75 mm×1.75 mm×2 mm. The diffusion-sensitizing gradients were applied along 30 non-collinear directions with a b value of 1000 s/mm2, and one volume was acquired without diffusion weighting (b = 0).
The DTI data was preprocessed using FSL (Jenkinson, Beckmann, Behrens, Woolrich, & Smith, 2012; Smith et al., 2004). The images were first brain extracted using the BET command (Smith, 2002) with a fractional intensity threshold of 0.3. We corrected the data using an open-source quality-control software called DTIprep (Liu et al., 2010), which performs several steps (for a detailed outline see Oguz et al., 2014) including an eddy-current and motion artifact correction. We then ran the DTIFIT command (part of the FMRIB’s Diffusion Toolbox; Behrens, 2003) in FSL, which fits a diffusion tensor model at each voxel. The data were then subjected to Tract-Based Spatial Statistics (TBSS, Smith 2006), which aligns all subjects’ FA data into a common space using the nonlinear registration tool FNIRT (Andersson 2007a, 2007b), creates a mean FA image, thins the mean FA image to create a mean FA skeleton which represents the centres of all tracts common to the sample, and then projects each subject’s aligned FA data onto this skeleton. Regional FA values for each participant were later extracted using the JHU ICBM-DTI-81 white-matter labels atlas (Mori, Wakana, & Van Zijl, 2005).
Multiple factor analysis
Multiple factor analysis (MFA) is a multivariate technique used to analyze multiple sets of data that are measured across the same set of observations (Abdi, Williams, & Valentin, 2013; Escofier & Pagès, 1990; Pagès, 2014). MFA is an extension of principal component analysis (PCA; see Abdi & Williams, 2010). PCA reduces a dataset into a set of orthogonal components that capture shared variance in the original data. The singular values of components calculated by PCA are similar to the concept of standard deviation in that they are the square root of each component’s captured variance (i.e., eigenvalue). MFA conducts a PCA on each distinct data table entered into the analysis, and then normalizes each table by dividing its elements by the singular value of its first component. This standardizes the length of the first component of each table to one, ensuring that no data table explains more variance simply because it contains more measures (i.e. columns) than the other data tables. The data tables are then combined and submitted to another PCA to obtain a common representation of all the data, known as the compromise solution.
Results
To evaluate the relationship between white matter integrity, cognition, and game learning, regional FA values, cognitive measures, and game scores were submitted to subsequent analyses using R 3.2.0 (R Core Team, 2015). Significance was determined using an alpha level of 0.05.
Relationship between game learning, cognition, and white matter integrity: A multiple factor analysis
An exploratory MFA was conducted to examine the relationship between behavioral performance on the cognitive tasks, white matter integrity as measured by FA, and outcome measures associated with two different types of game learning. Three data tables, one corresponding to each factor (cognition, white matter, and game learning), were entered into a MFA using the MExPosition package (Beaton et al., 2014) in R, after covarying out the effects of age because increasing age detrimentally affects all three factors. Significance of the components was determined by a permutation test (1000 permutations) and significance of the loadings for each variable was determined by a bootstrap resampling technique (1000 resamples with replacement).
Means and standard deviations of all the variables entered into the MFA are separated by age group and shown in Table 1. The loadings of the variables on the first two components are plotted in Fig. 3. Variables displayed in a darker font (as opposed to those which are barely visible) have bootstrap ratios greater than 2 on component 1 (and can therefore be argued to be significantly contributing to this component at α= 0.05; see Abdi & Williams, 2013) 1 . The outcome measures for both types of game learning (indicated by squares) were significant on component 1 only, and so we focused only on this component. For a complete list of eigenvalues, percentages of variance explained, and p-values for all components, refer to Table 3.

Components 1 and 2 from a multiple factor analysis conducted on Game Learning, Cognition, and White Matter FA.
Means and standard deviations (in parentheses) for younger and older adults for all variables entered into the MFA
Bootstrap ratios of variables on component 1 of multiple factor analysis
Note. Variables with positive bootstrap ratios are contributing to one end of component 1 while variables with negative bootstrap ratios are contributing to the other end. Variables with bootstrap ratios greater than 2 are contributing significantly to the components.
Eigenvalues, variance explained, and p-values (from permutation test) of all components from multiple factor analysis
Note. *p < 0.05.
The bootstrap ratios for all variables on component 1 are shown in Table 2. All significant variables are contributing to the same end of component 1, meaning they are positively related to one another. All game-related variables (highest level reached and learning rate for both games) were contributing significantly to this component. Most of the cognitive variables were also contributing significantly to this component; specifically, 2-update accuracy (both switch and nonswitch), cued-discrimination, backward span, subitizing speed, and DSST. Furthermore, FA in five white matter regions significantly contributed to this component; these regions were the cerebral peduncle, medial lemniscus, fornix/stria terminalis, external capsule, and cingulum/hippocampus.
Together these results suggest a relationship between the two types of game learning, white matter integrity, and cognitive performance. However, we are unable to define distinct relationships for action vs. strategy game learning from these results, thus the following subsequent analyses were warranted.
Pearson product-moment correlation coefficients and associated confidence intervals were calculated between age and the three regions of the corpus callosum in the JHU atlas (genu, body, and splenium). A negative correlation was found between age and FA in the genu of the corpus callosum r(59) = –0.62, p < 0.001, 95% CI [–0.75, –0.44] (see Fig. 4A). A weaker negative correlation was found between age and FA in the body of the corpus callosum, r(59) = –0.52, p < 0.001, 95% CI [–0.69, –0.32] (see Fig. 4B). No correlation was found between age and FA in the splenium of the corpus callosum, r(59) = –0.04, p = 0.76, 95% CI [–0.29, 0.21] (see Fig. 4C). We therefore saw evidence of an anterior-posterior gradient in age-related decline in FA. This evidence is in line with previous findings (Sullivan & Pfefferbaum, 2006) and suggests that our sample was representative of the population.
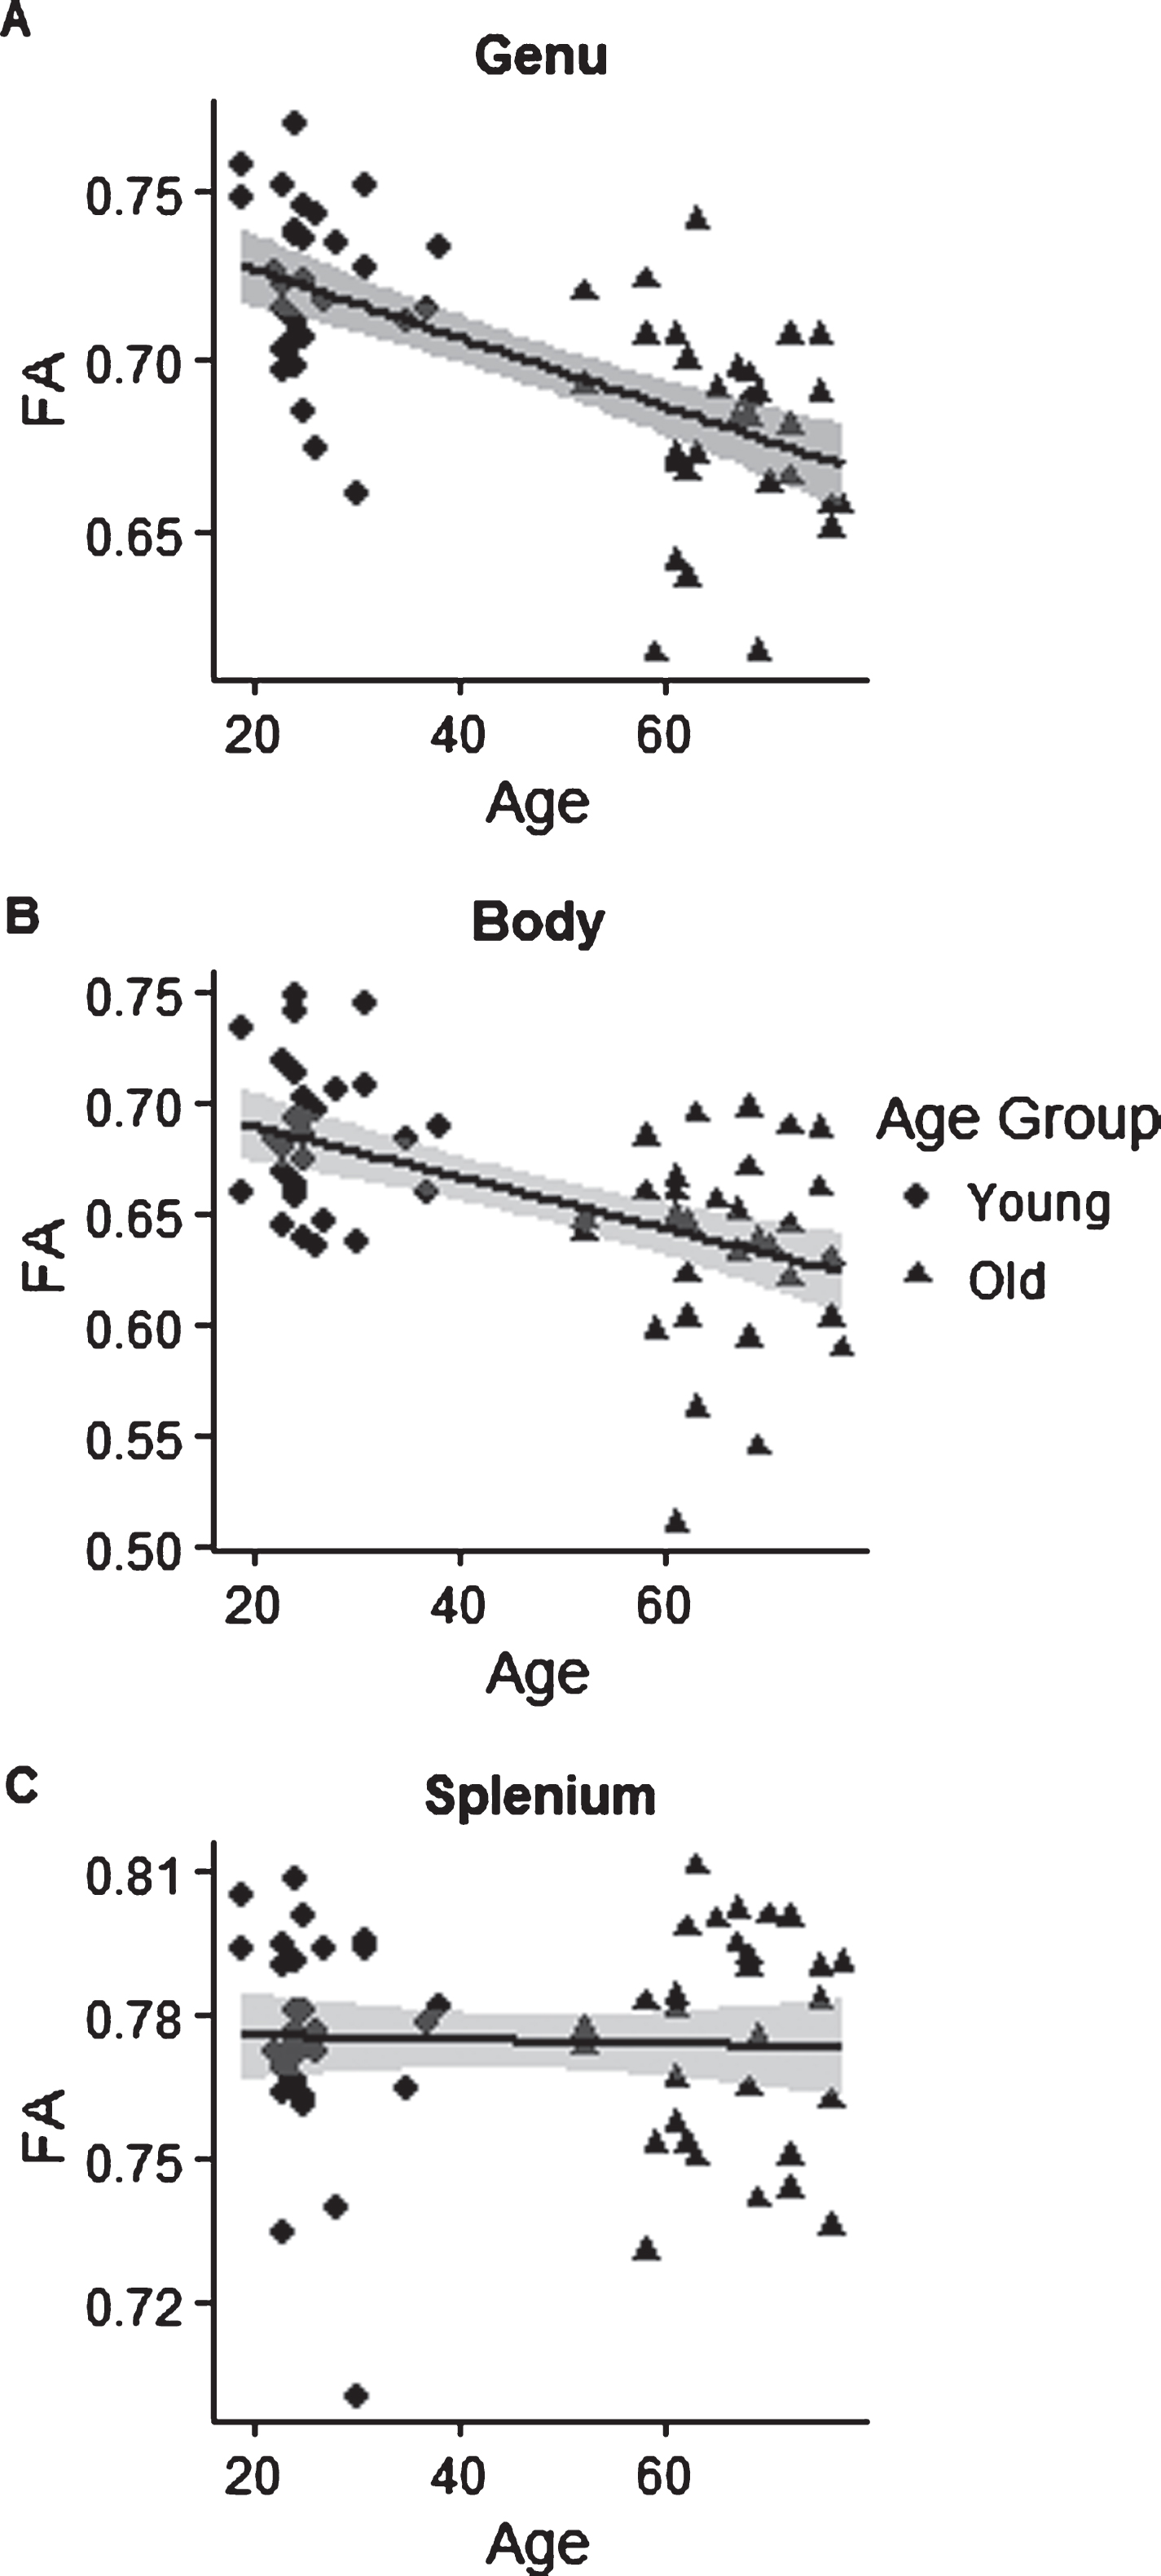
(A) Negative correlation between age and FA in the genu of the corpus callosum, r = –0.62, p < 0.001, 95% CI [–0.75, –0.44]. (B) Negative correlation between age and FA in the body of the corpus callosum, r = –0.52, p < 0.001, 95% CI [–0.69, –0.32]. (C) No correlation between age and FA in the splenium of the corpus callosum, r = –0.04, p = 0.76, 95% CI [–0.29, 0.21].
Regarding measures of game learning, a composite learning score for each game was calculated by averaging the z-scored values for both outcome measures (highest level reached and learning rate) associated with each game type. The variables with bootstrap ratios greater than 2 on component 1 of the aforementioned MFA were extracted for further analysis. Pearson’s product-moment partial correlations between these variables and the composite scores for each game, after controlling for age, were calculated using the RVAideMemoire package in R (Hervé, 2016). If FA in a particular white matter region of one hemisphere was significant on component 1 of the MFA, then correlations were conducted on the FA values from both the left and right hemispheres for that region. Results for all partial correlations are shown in Table 4.
Partial correlations between variables that were significant on component 1 of MFA and composite scores for Tank Attack 3D and Sushi-Go-Round(controlling for age)
Note. **p < 0.01, *p < 0.05, †p < 0.10.
Cued-discrimination, r(59) = –0.27, p = 0.04, 95% CI [–0.48, –0.02], subitizing speed, r(59) = –0.28, p = 0.03, 95% CI [–0.50, –0.03], 2-update switch accuracy, r(59) = 0.30, p = 0.02, 95% CI [0.05, 0.51], backward span, r(59) = 0.39, p = 0.002, 95% CI [0.15, 0.58], and FA in the right fornix/stria terminalis, r(59) = 0.27, p = 0.03, 95% CI [0.02, 0.49], were significantly correlated with the composite learning scores of Tank Attack 3D, after controlling for age. Cued-discrimination, r(59) = –0.32, p = 0.01, 95% CI [–0.53, –0.07], subitizing speed, r(59) = –0.28, p = 0.03, 95% CI [–0.50, –0.03], 2-update switch accuracy, r(59) = 0.40, p = 0.002, 95% CI [0.16, 0.59], backward span, r(59) = 0.29, p = 0.02, 95% CI [0.04, 0.51], DSST, r(59) = 0.31, p = 0.01, 95% CI [0.07, 0.52], and FA in the left cingulum/hippocampus, r(59) = 0.28, p = 0.03, 95% CI [0.03, 0.50], were significantly correlated with the composite learning scores of Sushi Go Round, after controlling for age.
These results suggest that most of the cognitive variables were common predictors of the two types of game learning, with only DSST (processing speed) uniquely predicting the strategy game. In addition, different regions of white matter integrity were related to the two varieties of game learning. It should be noted that right fornix/stria terminalis ROI of the JHU atlas does not include the entirety (or even the majority) of the tracts along the fornix nor the stria terminalis. It is an ambiguous region that contains probable tracts from both structures. The same can be said of the left cingulum/hippocampus ROI. It does not contain the entire tract along the cingulum nor hippocampus, but rather parts of both. Both of these ROIs are shown in Fig. 5. Figure 5A shows the right fornix/stria terminalis and its relationship with action game learning, after controlling for age. Figure 5B shows the left cingulum/hippocampus and its relationship with strategy game learning, after controlling for age.
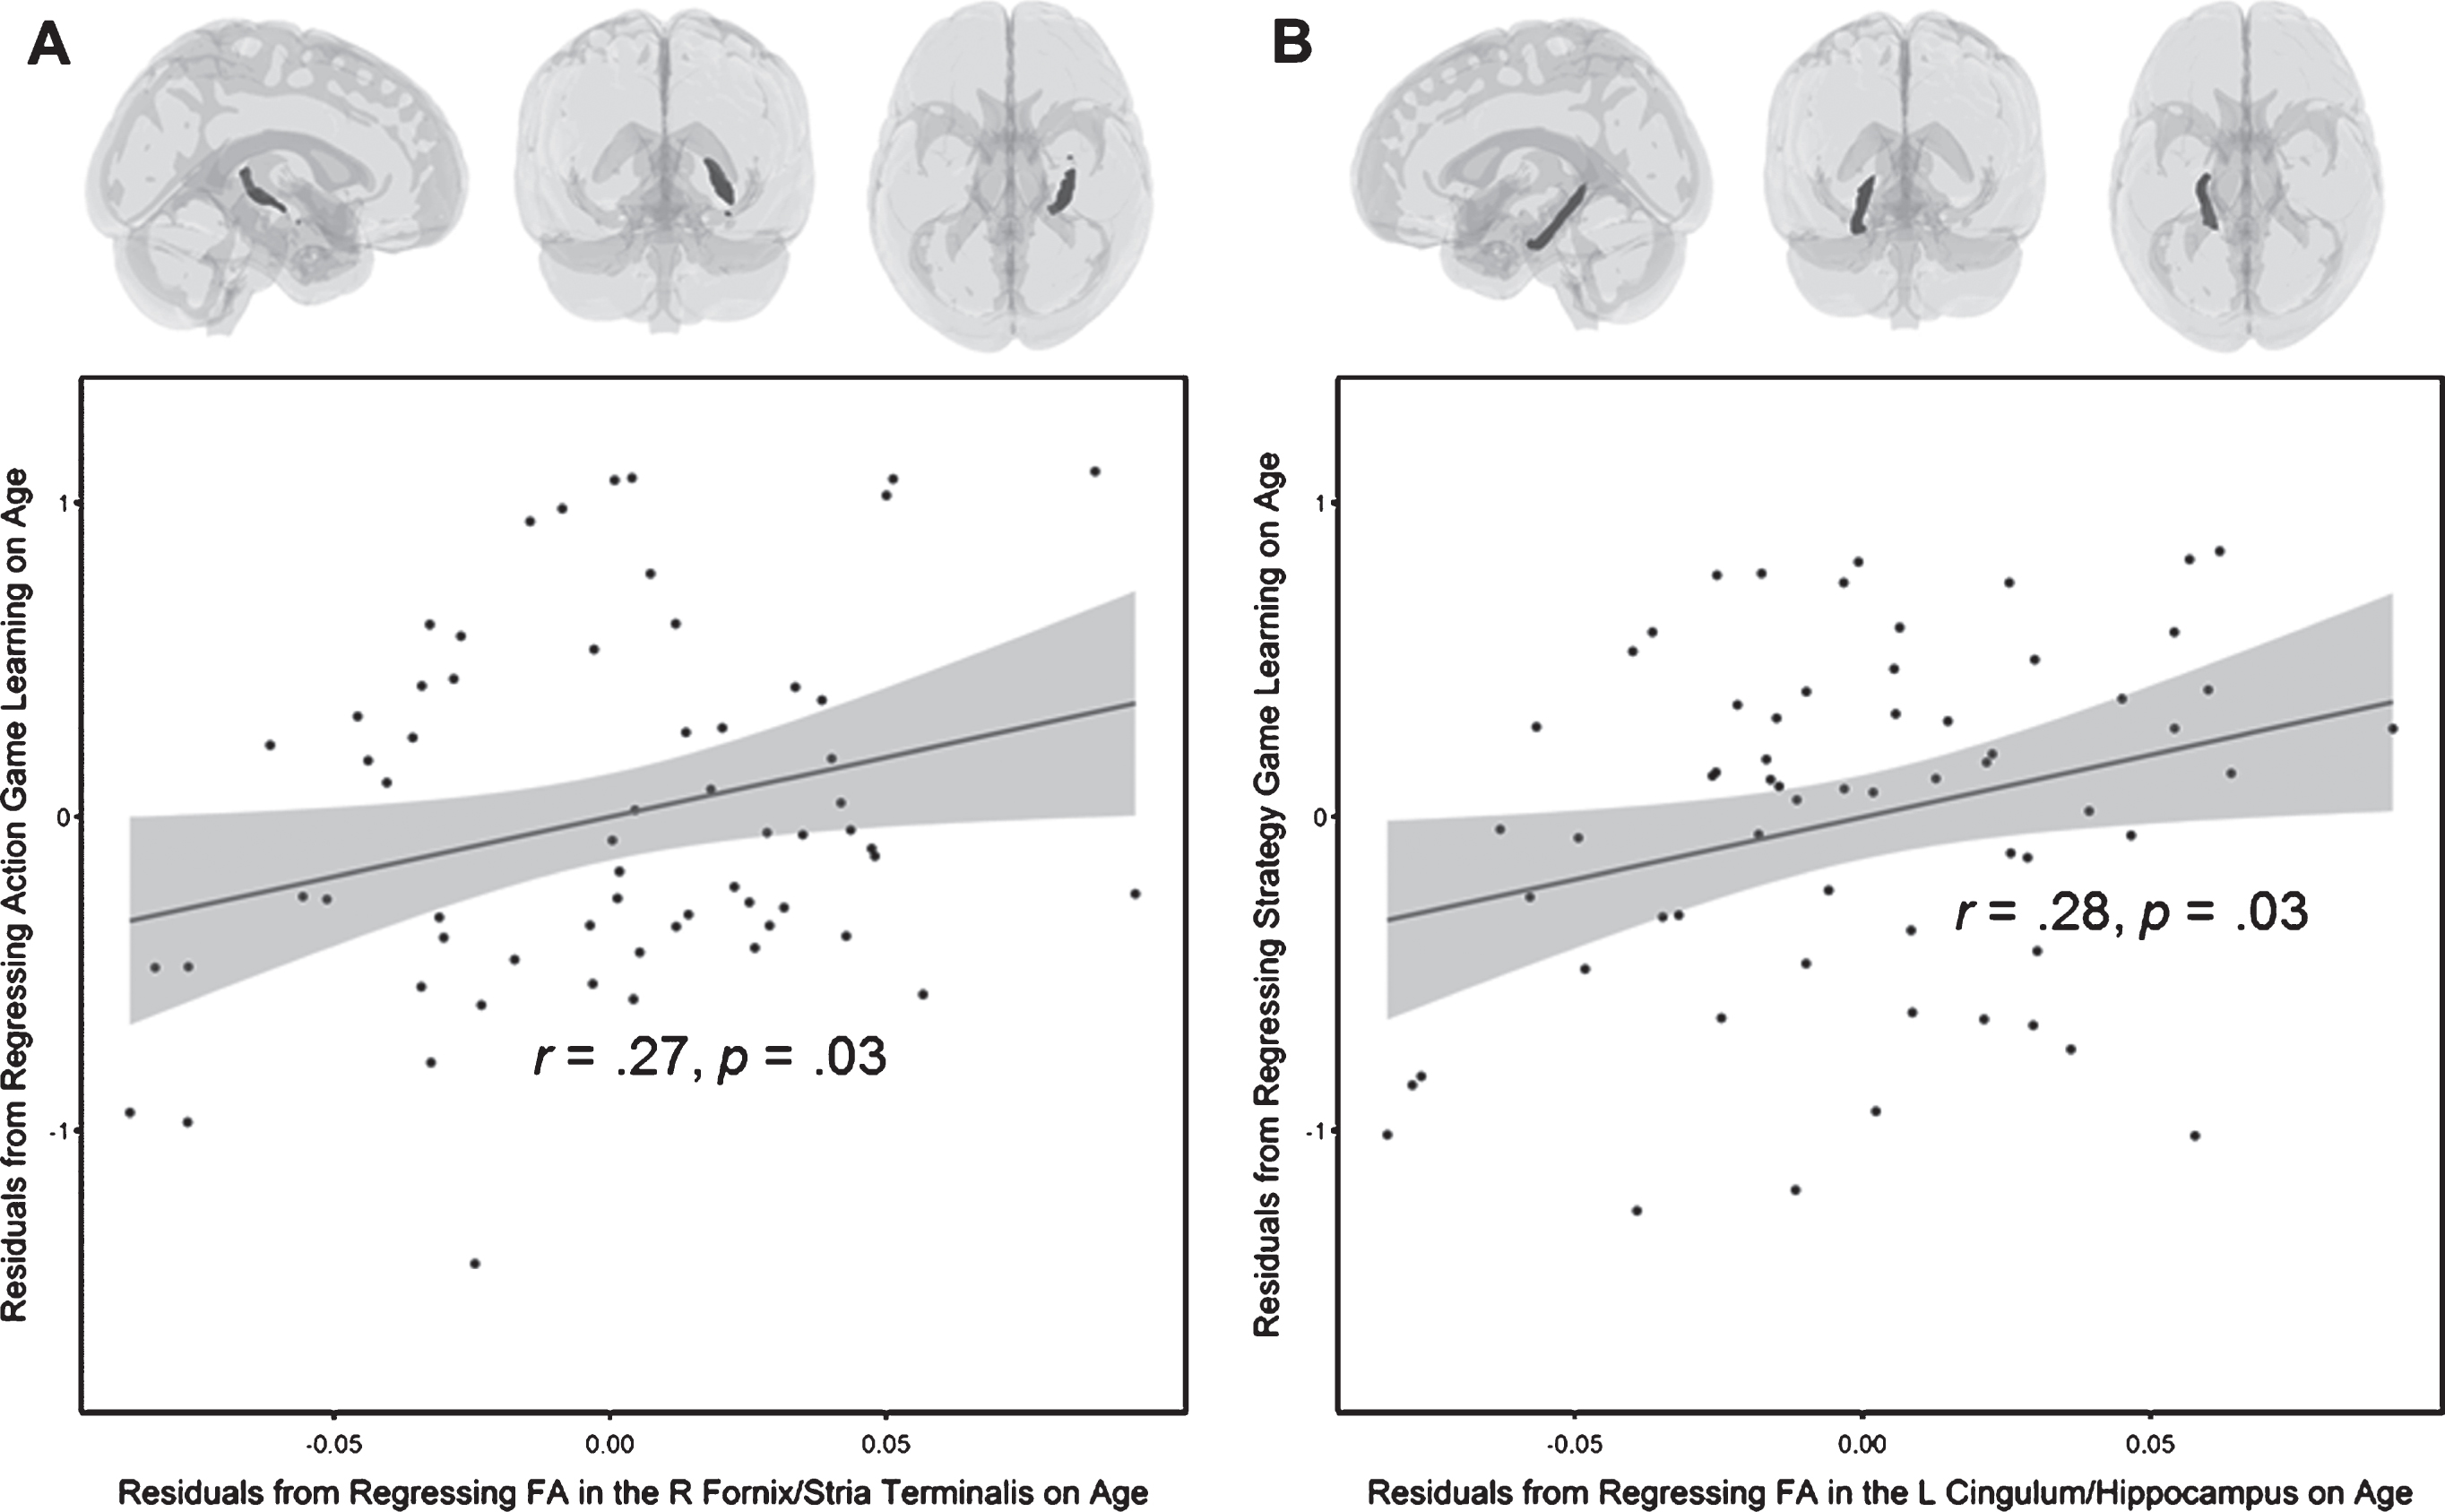
ROIs from the JHU ICBM-DTI-81 white-matter labels atlas (Mori, Wakana, & Van Zijl, 2005). (A) The right fornix/stria terminalis and a scatterplot showing the partial correlation between FA in this region and action game learning, after controlling for age. (B) The left cingulum/hippocampus and scatterplot showing the partial correlation between FA in this region and strategy game learning, after controlling for age.
It is possible that the relationships observed from the above partial correlations are driven by the strong correlation between the two types of game learning. In other words, these relationships may not be unique to a specific game type. To evaluate the specificity of the brain-cognition relationship, four three-stage hierarchical regressions were conducted using the composite score for each game as the dependent variable (two regressions were conducted for each type of game). Only those variables that had a significant relationship with the game score in the partial correlation analyses were extracted for these hierarchical regressions. Age was entered into the first stage as a control variable. The composite score for the opposing game type was entered into the second stage (if the composite score for Sushi-Go-Round was the dependent variable, then the composite score for Tank Attack 3D was entered at this stage, and vice versa). The final stage included either the cognitive variables that were correlated with the dependent variable or the white matter variables that were correlated with the dependent variable. These analyses were conducted in R using the lm.beta (Behrendt, 2014) package to calculate the standardized coefficients and the lmSupport (Curtin, 2016) package to calculate change in R2. The results are reported in Table 5.
Hierarchical regressions using game learning as the dependent variable and inputting either cognitive scores or white matter FA into the final stage
Hierarchical regressions using game learning as the dependent variable and inputting either cognitive scores or white matter FA into the final stage
Note. Reported R2 values are adjusted; Reaction time measures (including costs) are reverse coded; n = 62; ***p≤0.001, *p < 0.05, †p < 0.10.
In the first hierarchical regression, the composite score for Tank Attack 3D was used as the dependent variable and the cognitive measures that were partially correlated with Tank Attack 3D (2-update switch accuracy, cued-discrimination, subitizing speed, and backward span) were entered into the final stage of the analysis. Age, which was entered into the first stage of the analysis, accounted for a significant amount of variance in Tank Attack 3D composite scores, R2= 0.66, F(1, 60) = 118.90, p < 0.001. The composite score for Sushi Go Round, which was entered into the second stage, accounted for a significant amount of variance above and beyond age, ΔR2= 0.13, F(1, 59) = 37.63, p < 0.001. The cognitive measures did not account for a significant amount of variance above and beyond age and Sushi Go Round, ΔR2= 0.02, F(4, 55) = 1.42, p = 0.24.
The composite score for Tank Attack 3D was again used as the dependent variable in the second regression, and FA in the right fornix/stria terminalis was entered into the final stage of the analysis. As expected, results from the first two stages of this regression were identical to the those from the first regression analysis. Results from the final stage suggest that white matter FA in the right fornix/stria terminalis accounted for a marginally significant amount of variance above and beyond age and Sushi-Go-Round, ΔR2= 0.01, F(1, 58) = 3.84, p = 0.06.
In the third regression, the composite score for Sushi-Go-Round was used as the dependent variable and the cognitive measures that were partially correlated with Sushi-Go-Round (2-update switch accuracy, cued-discrimination, subitizing speed, backward span, and DSST) were entered into the final stage. Age, which was again entered into the first stage of the analysis, accounted for a significant amount of variance in Sushi-Go-Round composite scores, R2= 0.68, F(1, 60) = 132.40, p < 0.001. Composite scores for Tank Attack 3D, entered into the second stage, accounted for a significant amount of variance above and beyond age, ΔR2= 0.12, F(1, 59) = 37.63, p < 0.001. The cognitive measures did not account for a significant amount of variance above and beyond age and Tank Attack 3D, ΔR2= 0.03, F(5, 54) = 1.75, p = 0.14.
The composite score for Sushi-Go-Round was again used as the dependent variable in the fourth regression, and FA in regions that were partially correlated with Sushi-Go-Round (left cingulum/hippocampus) was entered at the end. Results from the final stage suggest that white matter FA in the left cingulum/hippocampus accounted for a marginally significant amount of variance above and beyond age and Tank Attack 3D, ΔR2= 0.01, F(1, 58) = 3.42, p = 0.07.
To see if the relationship between game learning and white matter FA still existed after controlling for age and cognition, another set of hierarchical regressions were conducted. See Table 6 for the standardized regression coefficients of all predictors entered into these analyses.
Hierarchical regressions with game learning predicting white matter after controlling for age and cognition
Hierarchical regressions with game learning predicting white matter after controlling for age and cognition
Note. Reported R2 values are adjusted; Reaction time measures (including costs) are reverse coded; n = 62; ***p≤0.001, **p < 0.01, *p < 0.05, †p < 0.10.
In the first hierarchical regression, action game learning predicted FA in the R Fornix/Stria Terminalis (as we had previously shown that FA in this region was partially correlated with the composite score for Tank Attack 3D). FA was entered as the dependent variable. Age, which was entered into the first stage of the analysis, accounted for a significant amount of variance, R2= 0.29, F(1, 60) = 26.30, p < 0.001. The cognitive variables that were partially correlated with Tank Attack 3D (2-update switch accuracy, cued-discrimination, subitizing speed, and backward span) were entered into the second stage of the analysis and did not account for a significant amount of variance above and beyond age, ΔR2= 0.03, F(4, 56) = 0.54, p = 0.70. The composite score for Tank Attack 3D was entered into the final stage of the analysis and accounted for a marginally significant amount of variance above and beyond age and cognition, ΔR2= 0.04, F(1, 55) = 3.76, p = 0.06.
In the second hierarchical regression, strategy game learning predicted FA in the L Cingulum/Hippocampus (as we had previously shown that FA in this region was partially correlated with the composite score for Sushi-Go-Round). FA was entered as the dependent variable. Age, which was entered into the first stage of analysis, did not account for a significant amount of variance, R2= –0.02, F(1, 60) = 0.06, p = 0.81. The cognitive variables that were partially correlated with Sushi-Go-Round (2-update switch accuracy, cued-discrimination, subitizing speed, backward span, and DSST) were entered into the second stage of analysis and accounted for a significant amount of variance above and beyond age, ΔR2= 0.20, F(5, 55) = 2.82, p = 0.02. The composite score for Sushi-Go-Round was entered into the final stage of the analysis and accounted for a significant amount of variance above and beyond age and cognition, ΔR2= 0.11, F(1, 54) = 8.53, p = 0.005.
To assess differences between the two age groups, a series of individual multiple regressions were conducted to see if any of the cognitive or white matter variables of interest (those extracted from the MFA above) interacted significantly with age while predicting game learning. Composite scores for Tank Attack 3D and Sushi-Go-Round were used as dependent variables. Age was entered as a predictor, along with either a cognitive score or white matter FA and the interaction term between the two predictors (both of which were mean centered). Standardized coefficients and p-values from all regressions have been reported in Table 7.
Standardized regression coefficients of age X variable interaction terms, predicting either action game learning or strategy game learning
Standardized regression coefficients of age X variable interaction terms, predicting either action game learning or strategy game learning
Note. *p < 0.05.
None of the interaction terms between age and cognitive variables or age and white matter variables significantly predicted action game learning, implying that the relationships between action game learning and cognition, and between action game learning and white matter integrity, were similar across the two age groups. On the other hand, two variables significantly interacted with age to predict strategy game learning. That is, interactions between age and 2-update nonswitch accuracy, β= –0.39, t(58) = –2.85, p = 0.01, and between age and FA in the right medial lemniscus, β= 0.16, t(58) = 2.23, p = 0.03, significantly predicted strategy game learning. However, 2-update nonswitch accuracy was not correlated with strategy game learning in older adults, r(29) = 0.12, p = 0.52, 95% CI [–0.25, 0.45], and was only marginally correlated with strategy game learning in younger adults, r(29) = 0.33, p = 0.07, 95% CI [–0.03, 0.61]. FA in the right medial lemniscus was neither correlated with strategy game learning in younger, r(29) = –0.28, p = 0.12, 95% CI [–0.58, 0.08], nor older adults, r(29) = 0.14, p = 0.47, 95% CI [–0.23, 0.47]. Therefore, it seems that the relationships between strategy game learning and cognition, and between strategy game learning and white matter integrity, were also similar across age groups in the current sample.
Older adults show a drastic decrease in frontal white matter FA, with a relative sparing of posterior white matter structure (O’Sullivan et al., 2001; Pfefferbaum & Sullivan, 2003; Head et al., 2004; Salat et al., 2005; see Sullivan & Pfefferbaum, 2006, for a review). Consistent with previous findings, we found evidence for an anterior-posterior gradient in age-related white matter decline, with the genu of the corpus callosum suffering more than the body, and the body in turn suffering more than the splenium. Contrary to our hypothesis however, we did not find any evidence to support the claim that action games rely more on perceptual processing whereas strategy games rely more on higher order executive functioning. Instead we found that cognitive performance seemed to be a common predictor of both types of game learning, while measures of white matter integrity were able to distinguish between the two types of game learning.
Using an exploratory multivariate approach, we were able to determine that both types of game learning were contributing significantly along one end of the first component of an MFA. Performance on most of the cognitive tasks also contributed to the same end of the component. Of the 48 regions in the JHU white matter atlas, only 5 significantly contributed to this component. The two types of game learning did not separate along components however, therefore further analyses were conducted in attempt to distinguish between them.
Of the cognitive constructs implicated by the exploratory analysis, nearly all were correlated with both types of game learning. Working memory(2-update, backward span, and subitizing speed) and perceptual discrimination (Cued-discrimination) predicted both action and strategy game learning; only processing speed (DSST) correlated with performance on Sushi-Go-Round but not with performance on Tank Attack 3D. White matter seemed to tell a different story however, as separate regions were correlated with the two game types. FA in the right fornix/stria terminalis region was predictive of action game learning, while FA in the left cingulum/hippocampus region was predictive of strategy game learning.
To further explore this contrast, cognition and white matter were entered into two different hierarchical regressions predicting each type of game learning, above and beyond the other type of game learning. After controlling for performance on the strategy game, cognition no longer predicted action game learning, while white matter integrity of the right fornix/stria terminalis was still predictive. Strategy game learning showed a similar pattern of results. That is, cognition did not predict strategy game learning over and beyond the effect of action game learning, but white matter FA in the left cingulum/hippocampus did. In addition, game learning was predictive of white matter integrity, even after controlling for cognition. This relationship seems to be stronger for strategy game learning than for action game learning. That is, strategy game learning shared 11% of variance with FA in the left cingulum/hippocampus after controlling for age and cognition (p = 0.005), while action game learning shared only 4% of shared variance with FA in the fornix/stria terminalis after accounting for cognition and age (p = 0.06).
In light of these results, it seems that cognition may be a common predictor of both types of game learning (except DSST), while white matter FA may be a more sensitive measure that allows us to distinguish between skill learning of the two games. This highlights the importance of neural correlates of game learning. There are many tasks underlying each cognitive construct. Evaluation of all possible cognitive correlates of learning would require a humungous battery of cognitive tasks and hundreds of participants to justify the sample size. In contrast, results from the current study, which yields specific neural correlates for each type of game learning, guides us about the possible cognitive and psychosocial constructs that may be linked to a specific game type. We should not, therefore, rely solely on behavioral tasks to measure cognition, but also attempt to measure the underlying neural activations and structures on which cognition relies.
In addition to anterior brain regions, FA in medial temporal regions, including portions of the cingulum, has been shown to decrease with age (e.g. Bendlin et al., 2010). Decreased FA in the cingulum has also been found in patients with mild cognitive impairment (MCI) and Alzheimer’s disease (AD; Bozoki, Korolev, Davis, Hoisington, & Berger, 2012; Liu et al., 2011; Mielke et al., 2009; Zhang et al., 2013; Zhuang et al., 2012, 2013). Age-related declines are marked in cognitive control and episodic memory, which are served by fronto-parietal and medial temporal brain networks, respectively. Because FA in a medial temporal region predicted strategy game learning, and strategy game learning uniquely predicted the FA of this medial temporal region, it is possible that playing such strategy video games may engage memory and cognitive control processes, and could therefore provide a more effective training tool for older adults, who are specifically vulnerable to deficits in these processes and medial temporal regions. The current study is not an intervention study however, and future training studies are required to support this hypothesis.
The current study found that FA in a limbic area was predictive of action game learning. Korgaonkar et al. (2011) found decreased FA in this same region (the right fornix/stria terminalis) in depressed patients. Action games may therefore involve more emotional arousal (Ravaja, Saari, Salminen, Laarni, & Kallinen, 2006; Ravaja et al., 2004; Ravaja, Turpeinen, Saari, Puttonen, & Keltikangas-Järvinen, 2008) and could be used as a potential training tool in certain clinical populations (i.e., mood disorders). The fornix, being an efferent pathway of the hippocampus, is also implicated in memory, and decreased FA in the fornix has also been found in patients with MCI and AD (Mielke et al., 2009, 2012; Bozoki et al., 2012; Liu et al., 2011; Zhuang et al., 2012, 2013; Zhang et al., 2013; Kantarci, 2014). Therefore, it is conceivable that training in either type of game could be beneficial to an aging population suffering from memory problems. It is important to keep in mind that the ROI associated with action game learning in this study is not measuring FA in the fornix specifically, but rather in an ambiguous region containing tracts from both the fornix and stria terminalis.
Very few studies have attempted to explore the differences between various types of video games. Much more work is therefore needed in this area, especially if games are to be understood as a tool for cognitive intervention strategies. The current study is exploratory and correlational in nature. In order to determine if learning either type of game can actually impact cognition or white matter integrity, future studies should make use of pre-post design to measure cognition and white matter integrity before and after training in both action and strategy games. Furthermore, the changes in cognition and white matter integrity in the two different gaming groups need to be compared with an age-, gender- and education-matched active control group.
Regarding age-related differences in the relationships between game learning and cognition, or between game learning and structural integrity, we did not find any differences between the two age groups. This could be due to the high functioning older adults (MMSE cut off of 26 is very high) in the current sample. It is also plausible that although age-related detriments occur in all three domains (that is, cognition, brain and learning), the relationship between the three domains remains the same across the two age-groups. Moreover, the lack of age-related differences can also be due to the small number of age groups or the relatively small sample size, and therefore lack of power, in each individual group. We therefore conducted many of our analyses across age groups. This allowed us to increase our power, but limited us in our ability to draw any conclusions based on age. To explore age-related differences in the relationship between game learning, cognition, and white matter integrity, future studies should include more age groups with a greater number of participants in each age group.
This study looked at two different types of video games (action vs. strategy) and two different types of cognition (cognitive control vs. visual perception/attention), with the hypothesis that strategy game learning would correlate more with performance on the cognitive control tasks and action game learning would correlate more with performance on the perceptual tasks. We included three cognitive control tasks (random 2-update, task switching, and backward span) and three perceptual tasks (cued-discrimination, DSST, and enumeration). The only cognitive task that differentiately predicted one type of game learning over another was a task of perceptual speed (DSST), but the relationship was counterintuitive to our hypothesis. DSST performance predicted strategy game learning, not action game learning, and therefore further investigation is warranted to study the role of not only higher-order cognition, but also perception on strategy game learning. Future studies could examine more domains of higher-order cognition, such as reasoning and everyday cognition, to differentiate between different types of game learning, which will further our understanding of cognition-game learning relationships.
The current study looked at game learning on two simple (“casual”) online games, because of the casualization of the games to target the smart phone and tablet platforms. Future studies could examine learning of more complex video games that require more than an hour to learn to play, thus requiring a much longer duration to evaluate game learning compared to the current study. Such complexity may reveal more drastic differences. As mentioned previously, there are many different kinds of video games available, each with vastly differing mechanics. The foray into action and strategy games is merely a first step; there are many more genres and complexities yet to explore.
Footnotes
The bootstrap ratio is similar to a Student t criterion and the ratio of 2.00 roughly corresponds to an α= 0.05 critical value for a t-test. Therefore, if the bootstrap ratio is larger than 2, then the variable is considered important for the dimension at α= 0.05.
Acknowledgments
This project was supported in part by funding provided to the University of Texas at Dallas and Center for Vital Longevity by the Darrell K Royal Research Fund for Alzheimer’s Disease. We thank W. Christian Martin, Xi Chen, M. Irene Cunha, Melissa Druskis and Juan Mijares for assistance with datacollection.