
Abstract
Background:
Stroke is the most common cause of homonymous visual field defects (HVFDs). Yet, there is no standard protocol for composing a rehabilitation program.
Objective:
In this study we assess ADL gain of visual training for vision restoration in HVFD patients by means of Goal Attainment Scaling.
Methods:
Thirty-five patients trained two predefined regions of the visual field successively at home. In each region we compared the effects of both training rounds, one of which was thus ‘directed’ and the other ‘undirected’. Visual fields were measured with Humphrey and Goldmann perimetry. QoL was assessed with three stroke-related questionnaires and ADL with Goal Attainment Scaling (GAS).
Results:
Visual training improved the visual field for both Goldmann (ECSG = 5.82±0.94 mm; p = <0.001; n = 31) and Humphrey (0.79±0.20 dB; p = <0.001; n = 28) perimetry. All standardized stroke questionnaires were significantly improved after training (p < 0.039; n = 29), but showed no significant relation with either type of field improvement (p > 0.359). About 75% of the patients improved on their (personalized) GAS score. Interestingly, after both training rounds the GAS score increased in proportion to the extent of visual field improvement, for Goldmann border shift (p = 0.042; r = 0.38; n = 29) but not for Humphrey sensitivity increase (p = 0.337; r = 0.192; n = 28). Multiple regression revealed that GAS score was linearly related to the directed training component for Humphrey perimetry, but not for undirected training.
Conclusion:
Together these data suggest that (1) visual training aimed at vision restoration leads to visual field improvement and (2) the extent of visual field improvement is linearly related to the improvement of personal activities of daily living as evaluated by means of GAS. In conclusion, a personalized evaluation to assess treatment success showed the clinical significance of a visual training for vision restoration.
Introduction
About 20% of all stroke incidents lead to homonymous visual field defects (HVFDs) (Barker & Mullooy, 1997; Lawrence et al., 2001; Zihl, 2000). These patients suffer from visual field loss in the same part of the visual field of both eyes. The quality and extent of the remaining visual field varies greatly among patients and interferes to various extent with daily living (ADL), participation and quality of life (QoL). Normal daily activities such as reading, driving, object avoidance and usage of computer/television can become problematic or even impossible to perform (Gall, Franke & Sabel, 2010; Papageorgiou et al., 2007; Zihl, 2000). Such limitations have a major impact on a person’s life.
There are just a few rehabilitation possibilities for HVFDs. Compensation and substitution techniques can help the patient to reduce difficulties in ADL (Bowers, Keeney & Peli, 2014; Kerkhoff, Münßinger, Haaf, Eberle-Strauss & Stögerer, 1992; Lane, Smith, Ellison & Schenk, 2010; Peli, 2000; Schuett, Heywood, Kentridge, Dauner & Zihl, 2012), but the visual field defect itself is not targeted. Visual restoration aims to reduce the visual field defect. Many studies have claimed that parts of the visual field can be improved through such a training that – subsequently- might also lead to improvement in ADL and/or QoL (Bergsma & van der Wildt, 2008; Bergsma & van der Wildt, 2010; Bergsma, Elshout, van der Wildt & van den Berg, 2012; Chokron et al., 2008; Das & Huxlin, 2010; Das, Tadin & Huxlin, 2014; Huxlin et al., 2009; Kasten, Wüst, Behrens-Baumann & Sabel, 1998; Mueller, Poggel, Kenkel, Kasten & Sabel, 2003; Sabel, Kenkel & Kasten, 2004; Sahraie et al., 2006). Yet, the relationship between visual field recovery and daily life activities is not always evident, casting doubt on the clinical significance of such an intervention (Pollock et al., 2011).
For interventions in general the participation outcome is for each individual patient a leading result. QoL and participation scales are frequently used in stroke rehabilitation to assess improvements after interventions, but they often lack specificity to assess (personal) improvements after interventions. As a consequence, perceived improvement by a patient and objective clinical outcome may not match. This may contribute to the large variation in general QoL outcomes across studies and between QoL measures within studies (Aimola et al., 2014; Bergsma, Baars-Elsinga, Sibbel & Visser-Meily, 2014; Gall et al., 2008; de Haan, Melis-Dankers, Brouwer, Tucha & Heutink, 2015; Kasten et al., 1998; Lane et al., 2010; Schuett et al., 2012).
Goal Attainment Scaling (GAS) takes into account personal goals and can at the same time stimulate the patient to work towards their goals. GAS is originally used in rehabilitation of motor deficits (Borg et al., 2011; Brock et al., 2009; Turner-Stokes & Ashford, 2007). Prior to rehabilitation, personal and realistic goals are formulated by the patient and are checked by a therapist. In rehabilitation of patients with HVFDs, GAS has rarely been used (Bergsma et al., 2014).
In the current study we relate the outcome measures of a general health related QoL (MOS_SF-36), a stroke specific health related QoL (SSQoL), a participation (USER-P) scale and personalized GAS to changes in visual field after an intervention aimed at visual restoration.
Methods
Patients and study design
This study was part of a larger project approved by the ethical committee CMO Arnhem-Nijmegen in conjunction with the 1964 Declaration of Helsinki.
Forty stroke patients were included following written informed consent. Inclusion criteria were: homonymous visual field defect (confirmed by Goldmann perimetry during intake) due to post chiasmatic stroke, time since lesion at least 10 months (chronic phase of stroke), between 18–75 years of age and the ability to undergo (f)MRI scanning. Patients were excluded if they had other visual anomalies that could not be corrected for (such as macular degeneration, cataract, glaucoma) or visual neglect. Patients were excluded if they showed signs of visual neglect assessed by the line bisection task (systematic deviation towards the ipsilesional visual field).
Patients were trained following a randomized controlled crossover design. Each patient trained successively two predefined regions of the visual field at home during two rounds of training. At least one of these regions was located in the visual field defect. In the first three cohorts one of the training periods was directed to the visual field defect and the other training period was directed to the intact hemifield. Following three cohorts of ten patients we modified the training procedure, because in some patients the control training (directed to the intact hemifield) reversed the field improvement of the preceding test training. Therefore, the last cohort of ten patients followed a training paradigm with different training regions. In the last cohort of ten patients, the two training rounds were offered to one of two complementary halves of their defect (directed training) while the other half was not trained (and received undirected training). Note both training paradigms provided a directed and an undirected training round of the entire field defect.
For each training round the stimuli were only shown within the training region of interest (ROI). Therefore, the region of the visual field that was targeted in that round is evaluated as ‘directed training’ and the other part of the visual field that was not targeted during that round was evaluated as ‘undirected training’. In each region we compared the effects of both training rounds, one of which was thus ‘directed’ and the other ‘undirected’ (see Fig. 1). The patients trained 1 hour a day, 5 days a week during 8 weeks to complete at least 40 hours of training per training round.
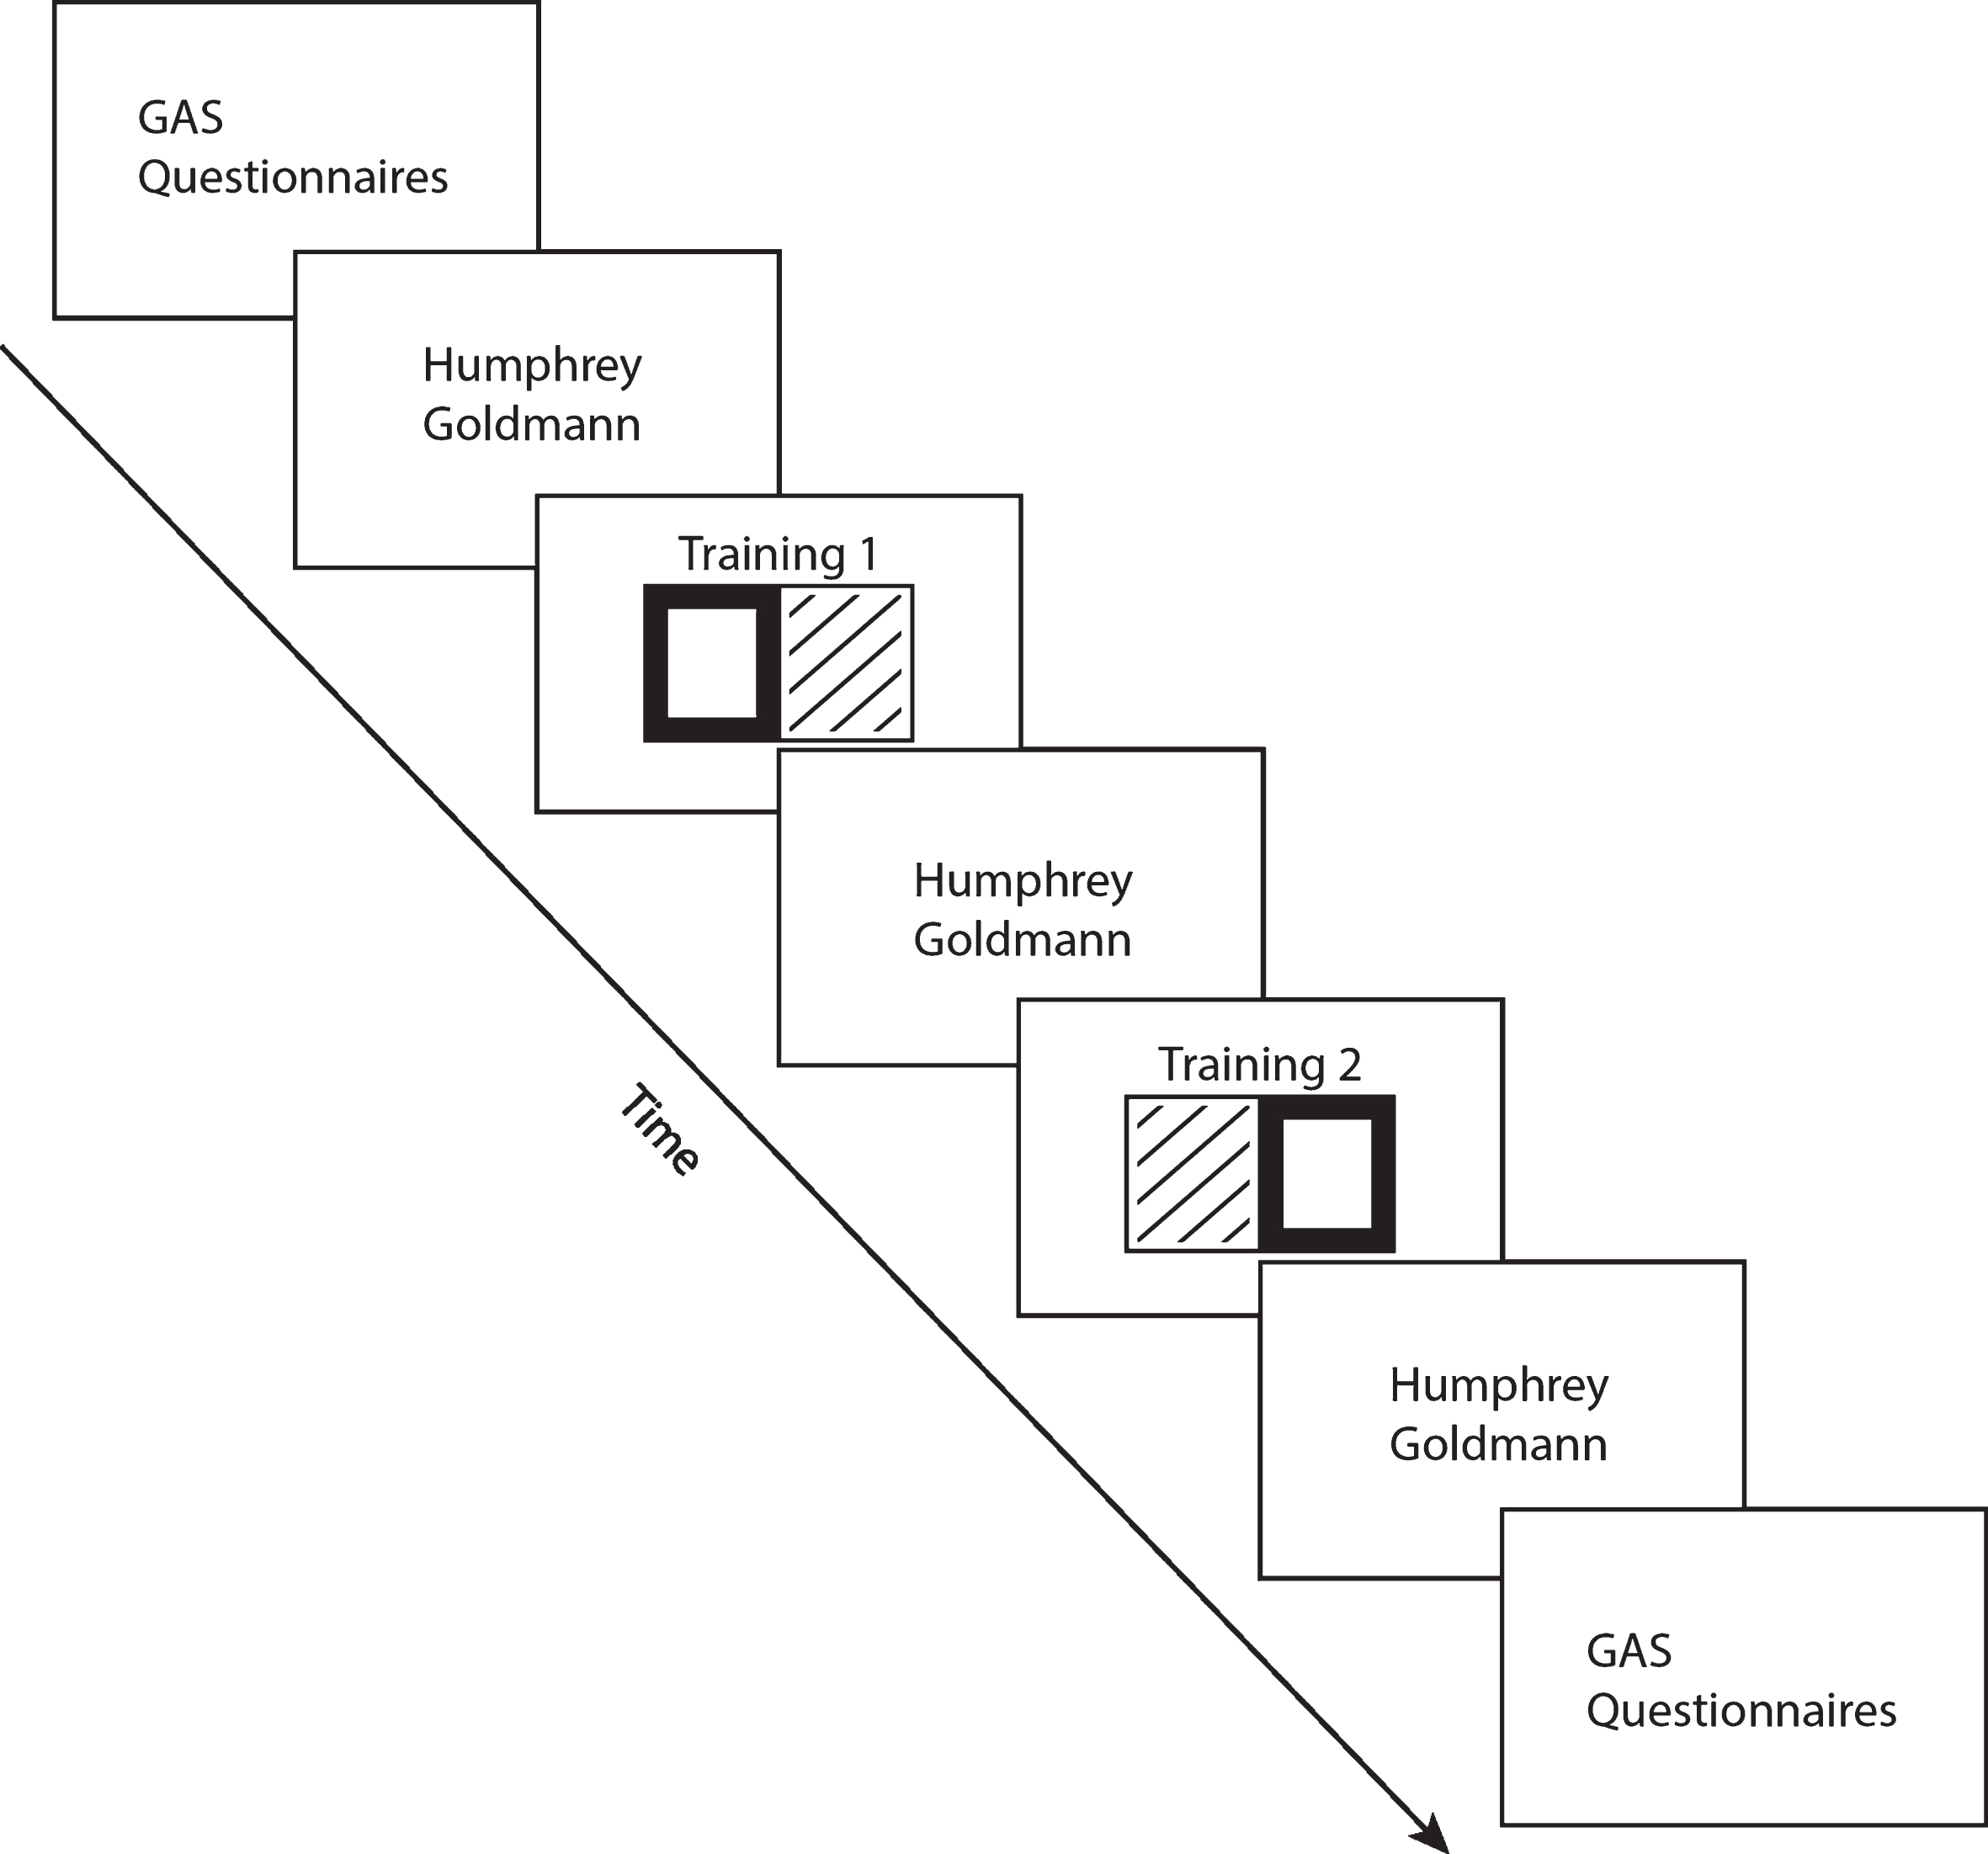
Study design. Two predefined regions in the visual field were trained successively (training 1 and training 2). The rectangles shown in bold represent the targeted region (evaluated for a ‘directed’ training effect) and the diagonal textures represent the untargeted region (evaluated for an ‘undirected’ training effect).
Prior to the inclusion of the first patient, a training scheme for all patients was created using Matlab (Mathworks Inc.). For each cohort of 10 patients’ numbers (J01–J10; J11–J20; J21–J30; J31–J40), the order of training rounds was randomly assigned to a patient number (Table 1). The patients were included in order of registration on our website.
Patient demographics and training order
Abbreviations: Hemi, hemianopia; Quadr, quadrantanopia; Scot, scotoma. aIntact = intact training first; Defect = defect training first. bUpper = upper quadrant training first; Lower = lower quadrant training first. cJ11 dropped out the study and was replaced by J41.
In all patients, training started 2–6 months after intake if all inclusion criteria were met. Both GAS and QoL questionnaires were completed prior to the first training round and evaluated after the 2nd training round.
For perimetry of the visual field defect we applied both Humphrey (blinded) and Goldmann perimetry (not blinded, because of insufficient staffing). Baseline perimetry occurred just prior to training and was repeated following the first round of visual training (at least 40 hours) and again following the second round of training (at least 40 hours) (Fig. 1). The directed and undirected training were evaluated for effectiveness by the difference between two succeeding perimetry assessments.
A detailed description of the training at home and the custom made training unit can be found in Elshout et al. (2016) (Elshout, van Asten, Hoyng, Bergsma & van den Berg, 2016). The patients’ head was stabilized with a chin and headrest and the viewing distance was fixed at 40 cm. Patients performed a visual discrimination task at many different locations within the targeted part of the visual field. The patient maintained gaze binocularly on a ring (diameter = 0.5 degrees) at the center of the screen. During stimulus presentation (7 s), patients shifted attention covertly (i.e. without shifting the eye from the fixation point) towards the training location and responded using the keyboard. At the training location, a point was shown displaced in a clockwise (CW) or counterclockwise (CCW) direction relative to a line extending from the fixation point like the hand of a clock. Alternatively, the stimulus consisted of a patch of dots rotating in a CW or CCW direction about the patch centre. The patient’s forced-choice response (CW or CCW) was indicated by arrow keys on the keyboard.
All training stimuli were scaled following the cortical magnification factor (CMF) (Cowey & Rolls, 1974) to provide equivalent cortical stimulation at all eccentricities.
Assessment of changes in visual field after training
We used two complementary clinical perimetry methods. Humphrey perimetry samples at fixed locations visual detection thresholds. Goldmann perimetry precisely localizes the blind field’s border. Monocular perimetry was performed of the eye opposite to the affected hemifield. We applied the sita-fast 30-2 program of the Humphrey Field Analyzer II in a standardized way. During Goldmann perimetry we used a white IV size stimulus with maximum luminance (4e = 1000 apostilb (asb) (≈ 318 cd/m2)) against a white background with a luminance of 31.5 asb. Fixation was continuously monitored via the spyglass by the experimenter and checked at random occasions using blind spot localization (Heijl & Krakau, 1975) that is also used during Humphrey perimetry.
Mean sensitivity of Humphrey perimetry was calculated for each trained and untrained region. Thus, we were able to investigate the change in sensitivity through directed training (i.e. change in sensitivity of the trained visual field) and undirected training (i.e. change in sensitivity of the untrained visual field). We incorporate all locations measured during the 30-2 program of the Humphrey perimetry. The mean sensitivity changes of the locations that fall into the trained region is referred as change through directed training. The mean sensitivity change of all other complementary locations is referred as change through undirected training.
Furthermore, we created isopters based on the Goldmann measurement and expressed the change of the visual field border in Equivalent Cortical Surface Gain (ECSG) (Bergsma et al., 2012; Elshout et al., 2016). Performance on many visual tasks follows the CMF, meaning that high CMF (central vision) and low CMF (visual periphery) corresponds to high and low performance respectively. ECSG transforms the shift of the field border’s eccentricity, into an equivalent mm cortex shift, using the human CMF function. Thus, we quantified the notion that more functional recovery occurs when 1deg of central vision is recovered than 1deg of peripheral vision.
Assessment of changes in activities of daily living and quality of life after training
We used three different validated questionnaires for evaluation of QoL: the 36-item short-form Medical Outcomes Study (MOS-SF-36), the Stroke-Specific Quality of Life scale (SSQoL) and the Utrecht Scale for Evaluation of Rehabilitation-Participation (USER-P).
The MOS-SF-36 is a general health questionnaire for assessment of care outcomes (Ware & Sherbourne, 1992). It is composed of 36 items, organized into eight domains. For each domain the item scores are coded, summed and transformed into a scale ranging from 0–100, where 100 is the best possible rating. We used the scoring method referred as RAND 36-Item Health Survey 1.0. Each domain will be evaluated separately.
The SSQoL is a questionnaire specially designed for stroke clinical trials (Williams, Weinberger, Harris, Clark & Biller, 1999). It consists of 49 items each scored on a 5-point scale. Items are averaged to obtain a mean score, and a higher score (where 5 is the best possible rating) indicates a higher level of QoL.
The USER-P questionnaire is an instrument to rate participation (Post et al., 2012). It consists 32 items and measures three aspects of participation: 1) frequency of behaviour, 2) restriction in participation and 3) satisfaction with participation. We calculated sum scores for the Frequency, Restrictions and Satisfaction scales and converted each sum score to a score on a scale ranging from 0 to 100. Higher scores indicate better levels of participation (higher frequency of activities, less restrictions, greater satisfaction).
In addition to these general QoL questionnaires we used a personalized approach (GAS) to assess improvements of ADL. Each patient formulated three SMART (Specific, Measurable, Attainable, Realistic and Timely) goals prior to training which were checked by a therapist experienced in applying GAS. The therapists were provided a visual field map depicting the field defect and the sector of the visual field that might improve through training. In this way the therapist could assess whether the formulated goal by the subject was realistic or not. For instance, a patient with a visual field defect close to the center could never attain a goal that requires peripheral vision. Preferably, the formulated goals are quantitative in some aspect so that the therapist can confirm the GAS level by an objective measurement (e.g. number of columns seen in excel sheet, number of times the patient stumble into objects, time needed to read article in newspaper). The therapists were blinded to the perimetric effects. By using a 6-point Likert-scale it can be evaluated to what extent the goals are attained after rehabilitation. Each patient started with a baseline performance assessment that was scored as –2. The achievement after training could be worse (–3), the same (–2), somewhat better but goal not achieved (–1), goal achieved (0), better than goal (+1) or much better than goal (+2). The overall GAS T-scores were calculated by applying the formula of Kiresuk and Sherman (Kiresuk & Sherman, 1968) with an expected correlation of the goal scales of 0.3:
Where Wi = the weight assigned to the ith goal (if equal weights, Wi = 1) and Xi = the score achieved at the ith goal. We considered each goal as equally relevant and thus assigned 1 to Wi.
To compare the pre- and post-training scores for the questionnaires and GAS we used a Wilcoxon paired samples test.
For Goldmann and Humphrey perimetry we used a one sampled t-test with a hypothesized mean of 0 to test for an overall training effect. For Goldmann perimetry we used a paired sampled t-test to test for an effect of intervention compared to no intervention. Regression analyses were used to study linear relationships between effect measures. We considered a p < 0.05 as statistically significant. The False Discovery Rate (FDR) was used to control for multiple comparisons. SPSS V.20.0 (SPSS Inc, Chicago, Illinois, USA) was used for analyses.
Results
Five of the forty patients dropped out during the first training round for personal reasons and were excluded from all further analyses. The remaining patients consisted of 7 women (20%) and 28 men (80%); mean age 51.8 years, range 26–75. Nineteen patients suffered from a left-sided HVFD and sixteen had a right-sided HVFD. The HFVD was caused by an ischemic stroke in twenty-five of our patients. Ten patients were left with a HVFD after a hemorrhagic stroke (detailed demographics in Table 1).
In three patients, we could not perform the ECSG analysis, since a complex relative visual field defect precluded definition of a Goldmann isopter. One patient of the 4th cohort was excluded based on unreliable fixations (Goldmann total n = 31). Seven patients were excluded from the Humphrey analysis since the first or last Humphrey measurement they performed was unreliable (>20% false detections during blind spot probing) (Humphrey total n = 28). For two patients we were unable to evaluate the GAS goals (GAS total n = 33). Twenty-nine responded to all questionnaires (Questionnaires total n = 29). Together, we collected a full data set for twenty patients.
The first three cohorts were very similar to the last cohort regarding changes in visual field by training and improvements on ADL and QoL questionnaires. Indeed, we found no significantly different outcome measures: Goldmann ECSG (p = 0.339), Humphrey dB (p = 0.487), GAS (p = 0.376), USERp (all three subscales p > 0.365), SSQoL (p = 0.208) and MOS SF36 (p = 0.321). Therefore, data was pooled together, but shown with different symbols in the regression figures.
Training effect assessed by perimetry
Humphrey perimetry revealed an overall sensitivity increase of 0.79 (SEM±0.20) dB after both training rounds (whole field analysis). Goldmann perimetry showed an average ECSG of 5.82 (SEM±0.94) mm after both training rounds (Fig. 2). Thus, both Humphrey and Goldmann showed a positive improvement of the visual field that significantly (t(27) = 3.961, p < 0.005; t(31) = 6.178, p < 0.005, respectively) differed from the null hypothesis of no training effect (i.e. hypothesized mean of 0). For the Goldmann perimetry we corroborated that assumption because the defect border did not change between intake and pre-training border (ECSG = 0.27±0.58) and we confirmed that ECSG was significantly larger after training than after no intervention (t(29) = 5.061; p < 0.005).
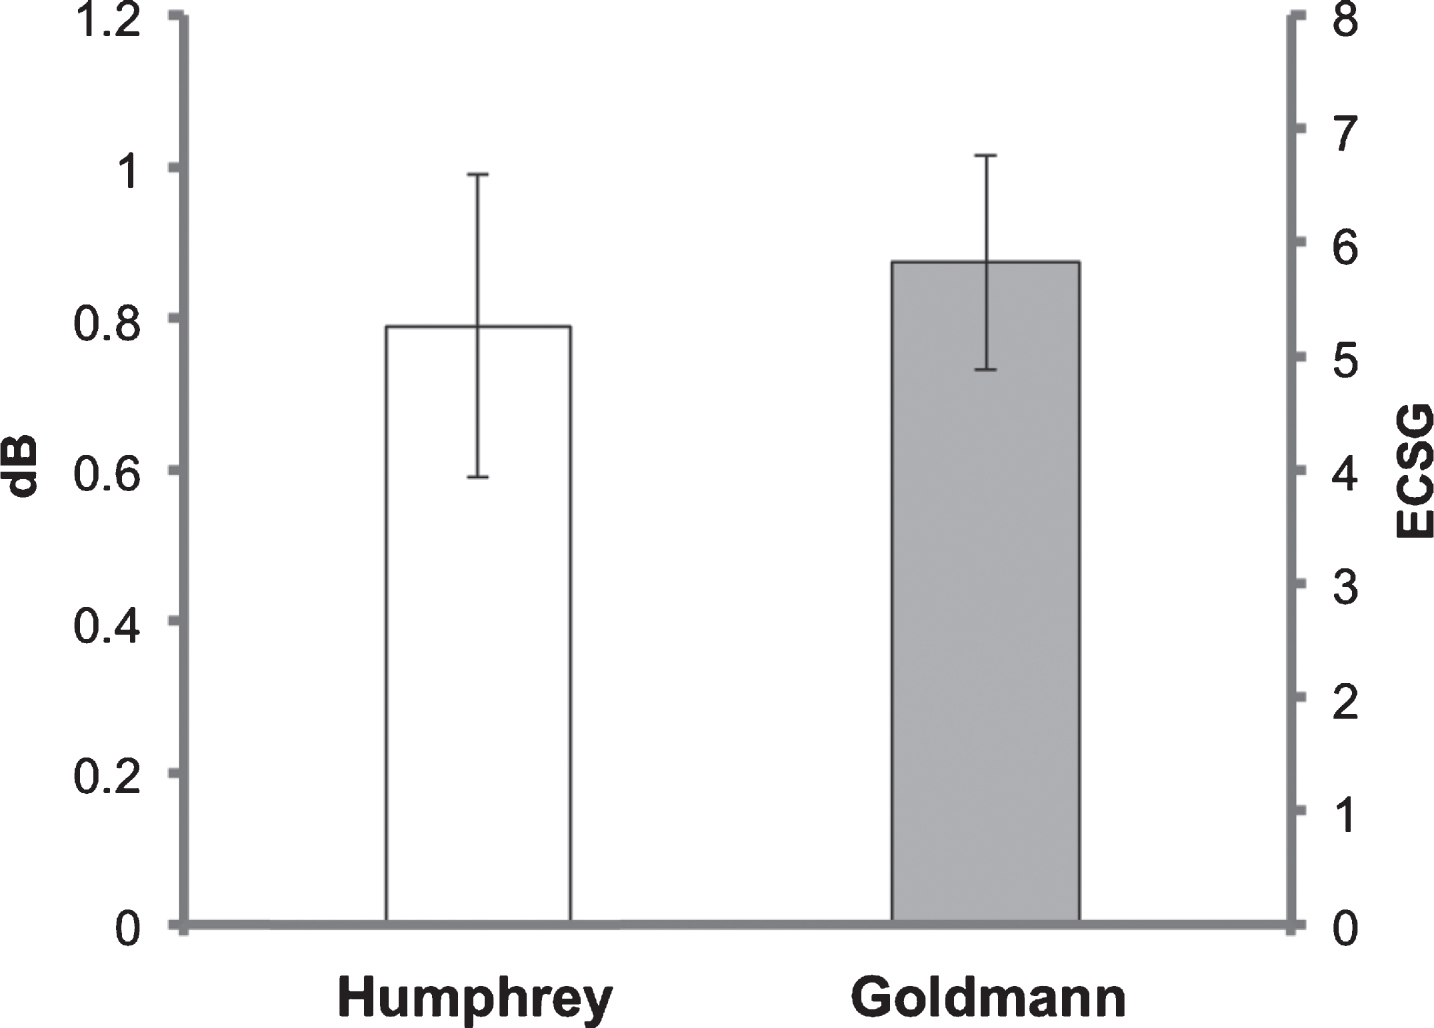
Visual field change. Training effect for Humphrey perimetry reported in sensitivity increase (dB) in the whole field after both training rounds. Goldmann perimetry describes the border shift of the defect contour (ESCG) after both training rounds. Clearly, the visual field was improved following the complete training.
The mean scores of both the SS-QoL and MOS_SF-36 questionnaires improved (Table 2; p = 0.009 and p = 0.024 respectively). Also the restriction (p = 0.039) and satisfaction (p = 0.002) scales of the USER-P significantly improved after intervention. Satisfaction was the only significant subscale after correction for multiple comparisons.
Results for each Quality of Life questionnaire
Results for each Quality of Life questionnaire
*Significant after correction for multiple comparisons (FDR). +Higher score means higher frequency, less restriction and higher satisfaction.
Two out of eight subscales of the MOS-SF-36 health survey significantly improved after training: ‘Role limitations due to physical health’ (p = 0.022), and ‘Emotional well-being’ (p = 0.002). All other items were not significant (‘physical functioning’: p = 0.165 z = –1.39; ‘Role limitation due to emotional problems’: p = 0.943, z = –0.07; ‘Energy/fatigue’: p = 0.062, z = –1.86; ‘Social functioning’: p = 0.125, z = –1.54; ‘Pain’: p = 0.937, z = –0.08 and ‘General health’: p = 0.843, z = –0.20). After correction for multiple comparisons the only significant subscale was ‘Emotional well-being’. No significant correlations were found between field recovery (expressed in Goldmann ECSG or Humphrey dB) and QoL improvement assessed by these three questionnaires (p > 0.359).
After both training rounds, the therapist assessed the progress on the goals that patients had formulated. In 7 patients this involved only 2 goals; three or more were evaluated in the other (26) patients. Of all evaluated patients, 73% improved on the GAS T-score (9 of the 33 subjects showed no improvement) and 52% of all patients attained at least one of their formulated goals (GAS score of ‘0’ for a particular goal after evaluation). We found a significant improvement in T-score after both training rounds (Fig. 3A; Z = –4.294, p < 0.005). Visual field improvement and GAS improvement varied considerably among patients. Patients that showed no improvement on the GAS (n = 9) had a low averaged field gain (Goldmann: M = 3.13 mm, SEM±0.97 mm; Humphrey: M = 0.13 dB, SEM±0.29 dB). In contrast, patients with improvement (n = 24) had a relatively high averaged field gain (Goldmann: M = 6.03 mm, SEM±1.17 mm; Humphrey: M = 0.85 dB, SEM±0.28 dB). We thus investigated whether the individual outcome of the GAS is related to the magnitude of the training effect. Indeed, the improvement on the GAS was linearly related to the reduction of the field defect following both training rounds combined as measured with Goldmann perimetry (Fig. 3B; p = 0.042; r = 0.381). No such effect was found for Humphrey perimetry (Fig. 3C; p = 0.335; r = 0.189).

Goal Attainment Scaling. (A) Median GAS T-score prior to treatment and after both training rounds. N = 33. (B) Regression between Goldmann field reduction and improvement on GAS (N = 29). The filled circles represent the data of the last cohort (N = 5). (C) Regression between Humphrey sensitivity increases in the affected hemifield and improvement on GAS (N = 28). The filled circles represent the data of the last cohort (N = 5).
Our finding that a directed training results in higher field gain compared to an undirected training (Elshout et al., 2016), made us wonder if we could address separate contributions of directed and undirected training to GAS. Thus, we performed a multiple linear regression to find the dependency of the GAS score on field improvement by directed and undirected training components for either Goldmann or Humphrey perimetry. The Goldmann data showed an overall trend (F(2,26) = 3.170, p = 0.059, r = 0.443). Patients’ predicted GAS score is equal to 9.5 + 0.9(directed training)+1.7(undirected training), where both directed and undirected training are coded as Goldmann ECSG. Remarkably, only undirected training significantly contributed to the GAS improvement (p = 0.111, beta = 0.332; p = 0.021, beta = 0.496 respectively).
Humphrey perimetry also revealed an overall trend (F(2,24) = 3.119, p = 0.063; r = 0.454), but only the directed training contributed significantly to this relationship (p = 0.025, beta = 0.441) not the undirected training (p = 0.768, beta = –0.055). Patients’ GAS score is predicted by 10.18 + 5.39(directed training) – 0.9(undirected training), where both directed and undirected training are coded as mean Humphrey sensitivity increase in dB.
Together these data suggest that the increase of the visual field and the improvement of visual sensitivity during both directed and undirected training may contribute to the probability that patients achieve their set goals.
Our data demonstrate that an extensive visual training can improve visual functioning and activities in daily living. To assess these improvements GAS seems more sensitive and informative to evaluate the clinical significance of such an intervention, compared to general stroke questionnaires.
The well-known relation between the size of the field defect and the severity of the problems in ADL (Gall et al., 2010; Papageorgiou et al., 2007) is interestingly extended in the reverse direction by our study: the more field recovery (Goldmann) is found after our visual training, the more gain we observe in ADL as evaluated by GAS. Previous work using questionnaires, reported a relation between performance on some ADL subscales and field improvement after a visual training (Mueller et al., 2003; Sabel et al., 2004) that we could not confirm with our QoL questionnaires. The relationship between function and QoL is often weaker than between function and ADL, since in QoL personality and environmental factors also play an important role. Also, stroke related QoL questionnaires probe specific (vision related) tasks by just 1 or 2 items in the entire questionnaire. While the total score may be insensitive to improvements of such few items, those improvements can be of immediate value for the patient that is primarily limited in his visual performance. Therefore, a personalized approach (like GAS) may be better suited to establish the impact of an intervention.
We further explored the separate contributions of directed and undirected training components to the GAS score. GAS score increased linearly with improvements on Humphrey perimetry for directed training but not for undirected training. This provides an important hint that the directed training may be of more significance for rehabilitation than the undirected training. However, Goldmann perimetry showed the opposite result; GAS score increased linearly with improvements for undirected training but not for directed training. More work is needed to establish this relation beyond doubt.
We are one of the first studies that applied GAS to evaluate improvements in ADL in patients with HVFDs that received a visual training aimed at restoration. One other study performed a pilot in a smaller group (n = 12), but did not find a significant relation of GAS improvement and visual field enlargement (Bergsma et al., 2014). In that study the attainability of the goals was sometimes violated; for instance, when a patient formulated a goal related to peripheral vision while the field defect stretched all the way to the center of vision. Since no complete visual field recovery would be expected, peripheral goals will never be attained. In the current study the therapists were keen on whether the goals of the patients matched the border of the visual field defect so that the goal is more likely attainable. For a heterogeneous patient group such as patients with all unique HVFDs, GAS is very suitable to measure functional improvements that are meaningful for themselves. Therefore, we believe that GAS is a valuable tool in the assessment of rehabilitation success in general, and also useful in this specific patient group.
GAS is originally used in motor rehabilitation (Borg et al., 2011; Brock et al., 2009; Turner-Stokes & Ashford, 2007). Then, rehabilitation program can be fitted to the goals that the patient wants to achieve. For instance, if a subject wants to walk to the toilet by him/herself, rehabilitation can be offered as walking exercises and the GAS goal can be set appropriately (e.g. walk 20 m under 30secs). Or, if a subject wants to be able to lift a laptop with one arm, rehabilitation can be aimed at lifting weights. For HVFDs, the defect arises in early stages of the visual system, where the neural circuitry is not committed to coding specific visual tasks (like for reading or avoiding obstacles), but to coding general visual categories like orientation and motion direction. Hence our visual training is tailored with respect to the defect location but not with regard to the training stimuli and aims to recover generic visual processing. This means that no GAS goal was specifically trained. It is clear that any correlation between visual recovery and GAS score involves a large amount of generalization from the training to the specific requirements of the set goals by the patient. Therefore, given the variety of ADL goals between the patients, transfer is strongly suggested by the linear relation between GAS score and visual field recovery. These transfer effects revealed by our data are consistent with previous studies. Many times improved performance on multiple non-trained stimulus and task conditions was reported such as acuity (Bergsma & van der Wildt, 2008), form/color perception (Bergsma et al., 2012), reading (Bergsma et al., 2012; Elshout et al., 2016), discrimination of fine and coarse orientation differences and perception of simple and global motion (Das et al., 2014), contrast sensitivity for drifting gratings (Huxlin et al., 2009).
We note that GAS improvement can also be mediated by improved scanning behavior. Interestingly, the study of Bergsma et al. (2011) showed increased oculomotor behavior in a driving simulator after visual training that required stable fixation and suppression of visual scanning during training (Bergsma, Leenders, Verster, van der Wildt & van den Berg, 2011). Perhaps visual training with covert attention shifts enhanced visual attention to the affected hemifield and improved scanning behavior in daily life also in our subjects.
In contrast to training aimed at restoration, compensatory interventions showed more task specific results. For example, previous studies demonstrated that reading and visual exploration training in patients with HVFDs are highly specific and task-dependent (Aimola, 2014; Schuett, 2012). Moreover, Lane et al. (2010) reported that attention training was equally effective as exploration training and both training paradigms did not improve reading (Lane et al., 2010). A recent randomized controlled study on the effects of compensatory scanning training once more showed no transfer effects to other visual skills and suggest different types of compensatory scanning training for different types of activities (de Haan et al., 2014). While compensatory scanning training may be beneficial for the trained tasks, the learned compensation strategies appear to be executed to limited extent in more complex situations, suggesting that HVFD patients would need many different types of compensation training.
There are some limitations and weaknesses in our study. First, the standard perimetry techniques used are not equipped with high resolution eye trackers. Visual improvements were often present for a specific region of the visual field and of variable size along the rest of the border. Such specific and irregular but repeatedly observed (each border point was established at least three times) field improvements are not consistent with eccentric fixation. Holding eye movements as the sole explanation for our perimetric outcomes would imply that after training patients had developed a pattern of eccentric fixation of specific amplitudes for different locations along the field border. We feel this is unlikely given that each border location was probed repeatedly but in random order. In addition, patients were explicitly instructed to refrain from making eye movements during training and perimetry. In the 4th cohort we had access to an EyeLink system that was adapted for use in the Goldmann perimeter. So we can back up the perimetrist’s observations with recordings for that cohort. Unfortunately, only in two patients (J38 and J40) we collect reliable recordings in all three sessions. The EyeLink recordings revealed fixation stability within 2deg for 88% of the trials. So only in these two patients does our EyeLink recording successfully provide a full check on the fixation stability during the perimetry throughout the training. In the other patients we collected reliable data only in one or two sessions. Analyzing these reliable sessions revealed that patients maintained fixation within 2deg for 84% of all trials. One patient with suspicious eye/head movements was excluded. In line with these observations, several other studies applied high resolution eye-tracking during perimetry and found visual field improvements not caused by eye movements (Kasten, Bunzenthal, & Sabel 2006; Marshall, Chmayssani, O’Brien, Handy & Greenstein 2010; Plow, Obretenova, Fregni, Pascual-Leone & Merabet 2012).
A second limitation of our study concerns the evaluation time points of the GAS. Although we attempted to analyze the contribution of both training rounds separately, a better way would be to apply GAS after each training round. Finally, since GAS incorporates personal goals, some goals are hard to evaluate and the therapist cannot always quantify the subjective improvement reported by the patient.
In conclusion, our visual discrimination training improved QoL and ADL in a group of thirty-five patients with HVFDs. To our knowledge we are the first to demonstrate a relationship between visual field improvement after visual training and improvement on subjectively formulated goals prior to training (GAS). This underscores the clinical significance of such a visual training and the potential positive impact on personal ADL. Visual recovery by perceptual training may become a useful addition to compensatory and substitution approaches for treatment of patients with homonymous visual field defects.
Footnotes
Acknowledgments
We thank F. Hoeben, T. Boers, M. Tinselboer, S. de Vries, N. Faithfull, and T. Zentjes of Bartimeus for patient instruction and delivery of the home training units. This work was supported by Netherlands Organization for Scientific Research medical section ZonMW-InZicht grant 94309003 (to AB) and by NUTSOhra grant 1202-64 (to AB).