
Abstract
Background:
We compared functional, electrophysiological and morphological parameters after SCI in two groups of rats Sprague Dawley (SD) rats with normal vision and blind rats from a SD-substrain “Royal College of Surgeons” (SD/RCS) who lose their photoreceptor cells after birth due to a genetic defect in the retinal pigment epithelium. For these animals skin-, intramuscular-, and tendon receptors are major available means to resolve spatial information.
Objective:
The purpose of this study was to check whether increased sensitivity in SD/RCS rats would promote an improved recovery after SCI.
Methods:
All rats were subjected to severe compression of the spinal cord at vertebra Th8, spinal cord segment Th10. Recovery of locomotion was analyzed at 1, 3, 6, 9, and 12 weeks after SCI using video recordings of beam walking and inclined ladder climbing. Five functional parameters were studied: foot-stepping angle (FSA), rump-height index (RHI) estimating paw placement and body weight support, respectively, number of correct ladder steps (CLS) assessing skilled hindlimb movements, the BBB-locomotor score and an established urinary bladder score (BS). Sensitivity tests were followed by electrophysiological measurement of M- and H-wave amplitudes from contractions of the plantar musculature after stimulation of the tibial nerve. The closing morphological measurements included lesion volume and expression of astro- and microglia below the lesion.
Results:
Numerical assessments of BBB, FSA, BS, lesion volume and GFAP-expression revealed no significant differences between both strains. However, compared to SD-rats, the blind SD/RCS animals significantly improved RHI and CLS by 6 – 12 weeks after SCI. To our surprise the withdrawal latencies in the blind SD/RCS rats were longer and the amplitudes of M- and H-waves lower. The expression of IBA1-immunoreactivity in the lumbar enlargement was lower than in the SD-animals.
Conclusion:
The longer withdrawal latencies suggest a decreased sensitivity in the blind SD/RCS rats, which promotes better recovery after SCI. In this way our results provide indirect support to earlier work showing, that hypersensitivity and chronic pain after contusive SCI impair the recovery of locomotor function.
Keywords
Introduction
Spinal cord injury (SCI) leads to a disruption of ascending and descending fiber tracts followed by loss of sensation and voluntary movements below the level of the lesion. It is usually associated with high mortality, severe disability and handicap, prolonged treatment and rehabilitation, and a high economic burden (Wyndaele & Wyndaele, 2006). A recent review of the literature has shown changing epidemiological features in SCI with a trend in recent years, particularly in the elderly, to increasing annual incidence rates reaching approximately 40 cases per million population worldwide (van den Berg et al., 2010).
Whereas large injuries often lead to severe permanent disabilities, smaller lesions are followed by some degree of spontaneous functional recovery (Blight, 1993; Burns et al., 1997; Little et al., 1999), which can be enhanced by rehabilitative therapies. The benefits of combined locomotor training with pharmacological means, and/or spinal cord electrical stimulation paradigms, on the recovery of sensory and locomotor function after SCI have been demonstrated in animal models (Edgerton et al., 2004; Rossignol et al., 1999) and SCI patients (Barbeau & Rossignol, 1994; Field-Fote, 2001), but the underlying mechanisms are still poorly understood.
Literature shows, that physical therapy has a positive effect on neuronal plasticity and sensorimotor function (Wolpaw & Tennissen, 2001). Patients with incomplete paraplegia, for example, show a significant increase of function within the first year after the traumatic incident. Rehabilitative treatments as locomotion therapy (Behrman & Harkema, 2000; Behrman et al., 2006; Harkema, 2001) or treatments with the “massed practice”- principal (Lynskey et al., 2008), which means to set therapy with a maximum amount of time (number of treatment hours) and frequency (number of variuos treatment trials per time unit, e.g. hour), turned out to be very useful in terms of functional recreation (Anneken et al., 2010).
Recently we tested systematically the effects of whole body vibration (WBV) on recovery of motor performance after SCI in rats. Our results show, that it improved significantly body weight support, bladder function and the overall recovery index (Manthou et al., 2017; Schwarz et al., 2015; Wirth et al., 2013). The morphological correlates of these improvements we found in the restored density of synaptic terminals and functioning capillary network in the lumbar spinal cord (Manthou et al., 2015). The effects of WBV are most probably due to activation of the muscle- and tendon proprioceptors and their afferents: the central processes of the dorsal root gangion cells are known to exert a direct (type Ia) or an indirect (fibers type Ib and II) trophic influence on the deafferented (by SCI) dorsal and ventral horn neuronal cell bodies.
As a logical extension of this study we decided to study the recovery after SCI in special strain of rats (Sprague-Dawley, substrain Royal College of Surgeons, RCS). The SD/RCS rats lose their photoreceptor cells gradually after birth (onset at 2 weeks after birth) due to a genetic defect in the debris-phagocytosis of the retinal pigment epithelium (D'Cruz et al., 2000; Dowling & Sidman, 1962; Mullen & La Vail, 1976; Sheedlo et al., 1991). Thus, for these blind rats, skin-, intramuscular-, and tendon receptors become major available means to resolve spatial information (Brecht et al., 1997; Tomov et al., 2002).
The purpose of this study therefore was to determine, whether a demand- (i.e. blindness) altered sensitivity would improve the functional outcome after incomplete SCI in rats.
Materials and methods
Animals and overview of experiments
Two groups of rats (SD and SD/RCS) were used.
Group SD consisted of 10 adult female rats. These animals were Sprague-Dawley (SD) rats with normal visual perception, poor recovery of facial (whisking) function after facial nerve transection and suture (facial-facial anastomosis, FFA).
Group SD/RCS also consisted of 10 adult female rats. These animals were blind Sprague-Dawley rats (substrain Royal College of Surgeons, RCS). The SD/RCS rats lose their photoreceptor cells after birth due to a genetic defect of the retinal pigment epithelium (D'Cruz et al., 2000; Sheedlo et al., 1991). Thus, the mystacial vibrissae of these animals are their only available means to resolve spatial information (Brecht et al., 1997). Following FFA, the SD/RCS rats recover whisking function completely (Tomov et al., 2002).
Whether SD/RCS recover well from motor deficits after SCI was the object of the present study. Animals of both groups were subjected to compressive SCI at level Th8. Estimates on recovering sensory and motor functions and electrophysiological parameters of the hind legs were performed 1, 3, 6, 9 and 12 weeks after SCI.
Before and after surgical treatment, all rats were kept on standard laboratory food (Ssniff, Soest, Germany) and tap water ad libitum with an artificial light-dark cycle of 12 hours light on, 12 hours off. All experiments were conducted in accordance with the German Law on the Protection of Animals, and the procedures used were approved by the Animal Welfare Committee (Az. 26.203.2K 35, 35/01).
Conditioning
All 20 rats were trained to walk on a wooden beam, to climb an inclined ladder and to stay in a closed chamber (for the sensitivity measurements) once daily for 2 weeks (Fig. 1A-C). Animals rapidly became accustomed to these procedures (within 2-3 days) and did not show any signs of stress such a freezing or trying to bite, weight loss or lack of grooming; rather, animals readily cooperated.
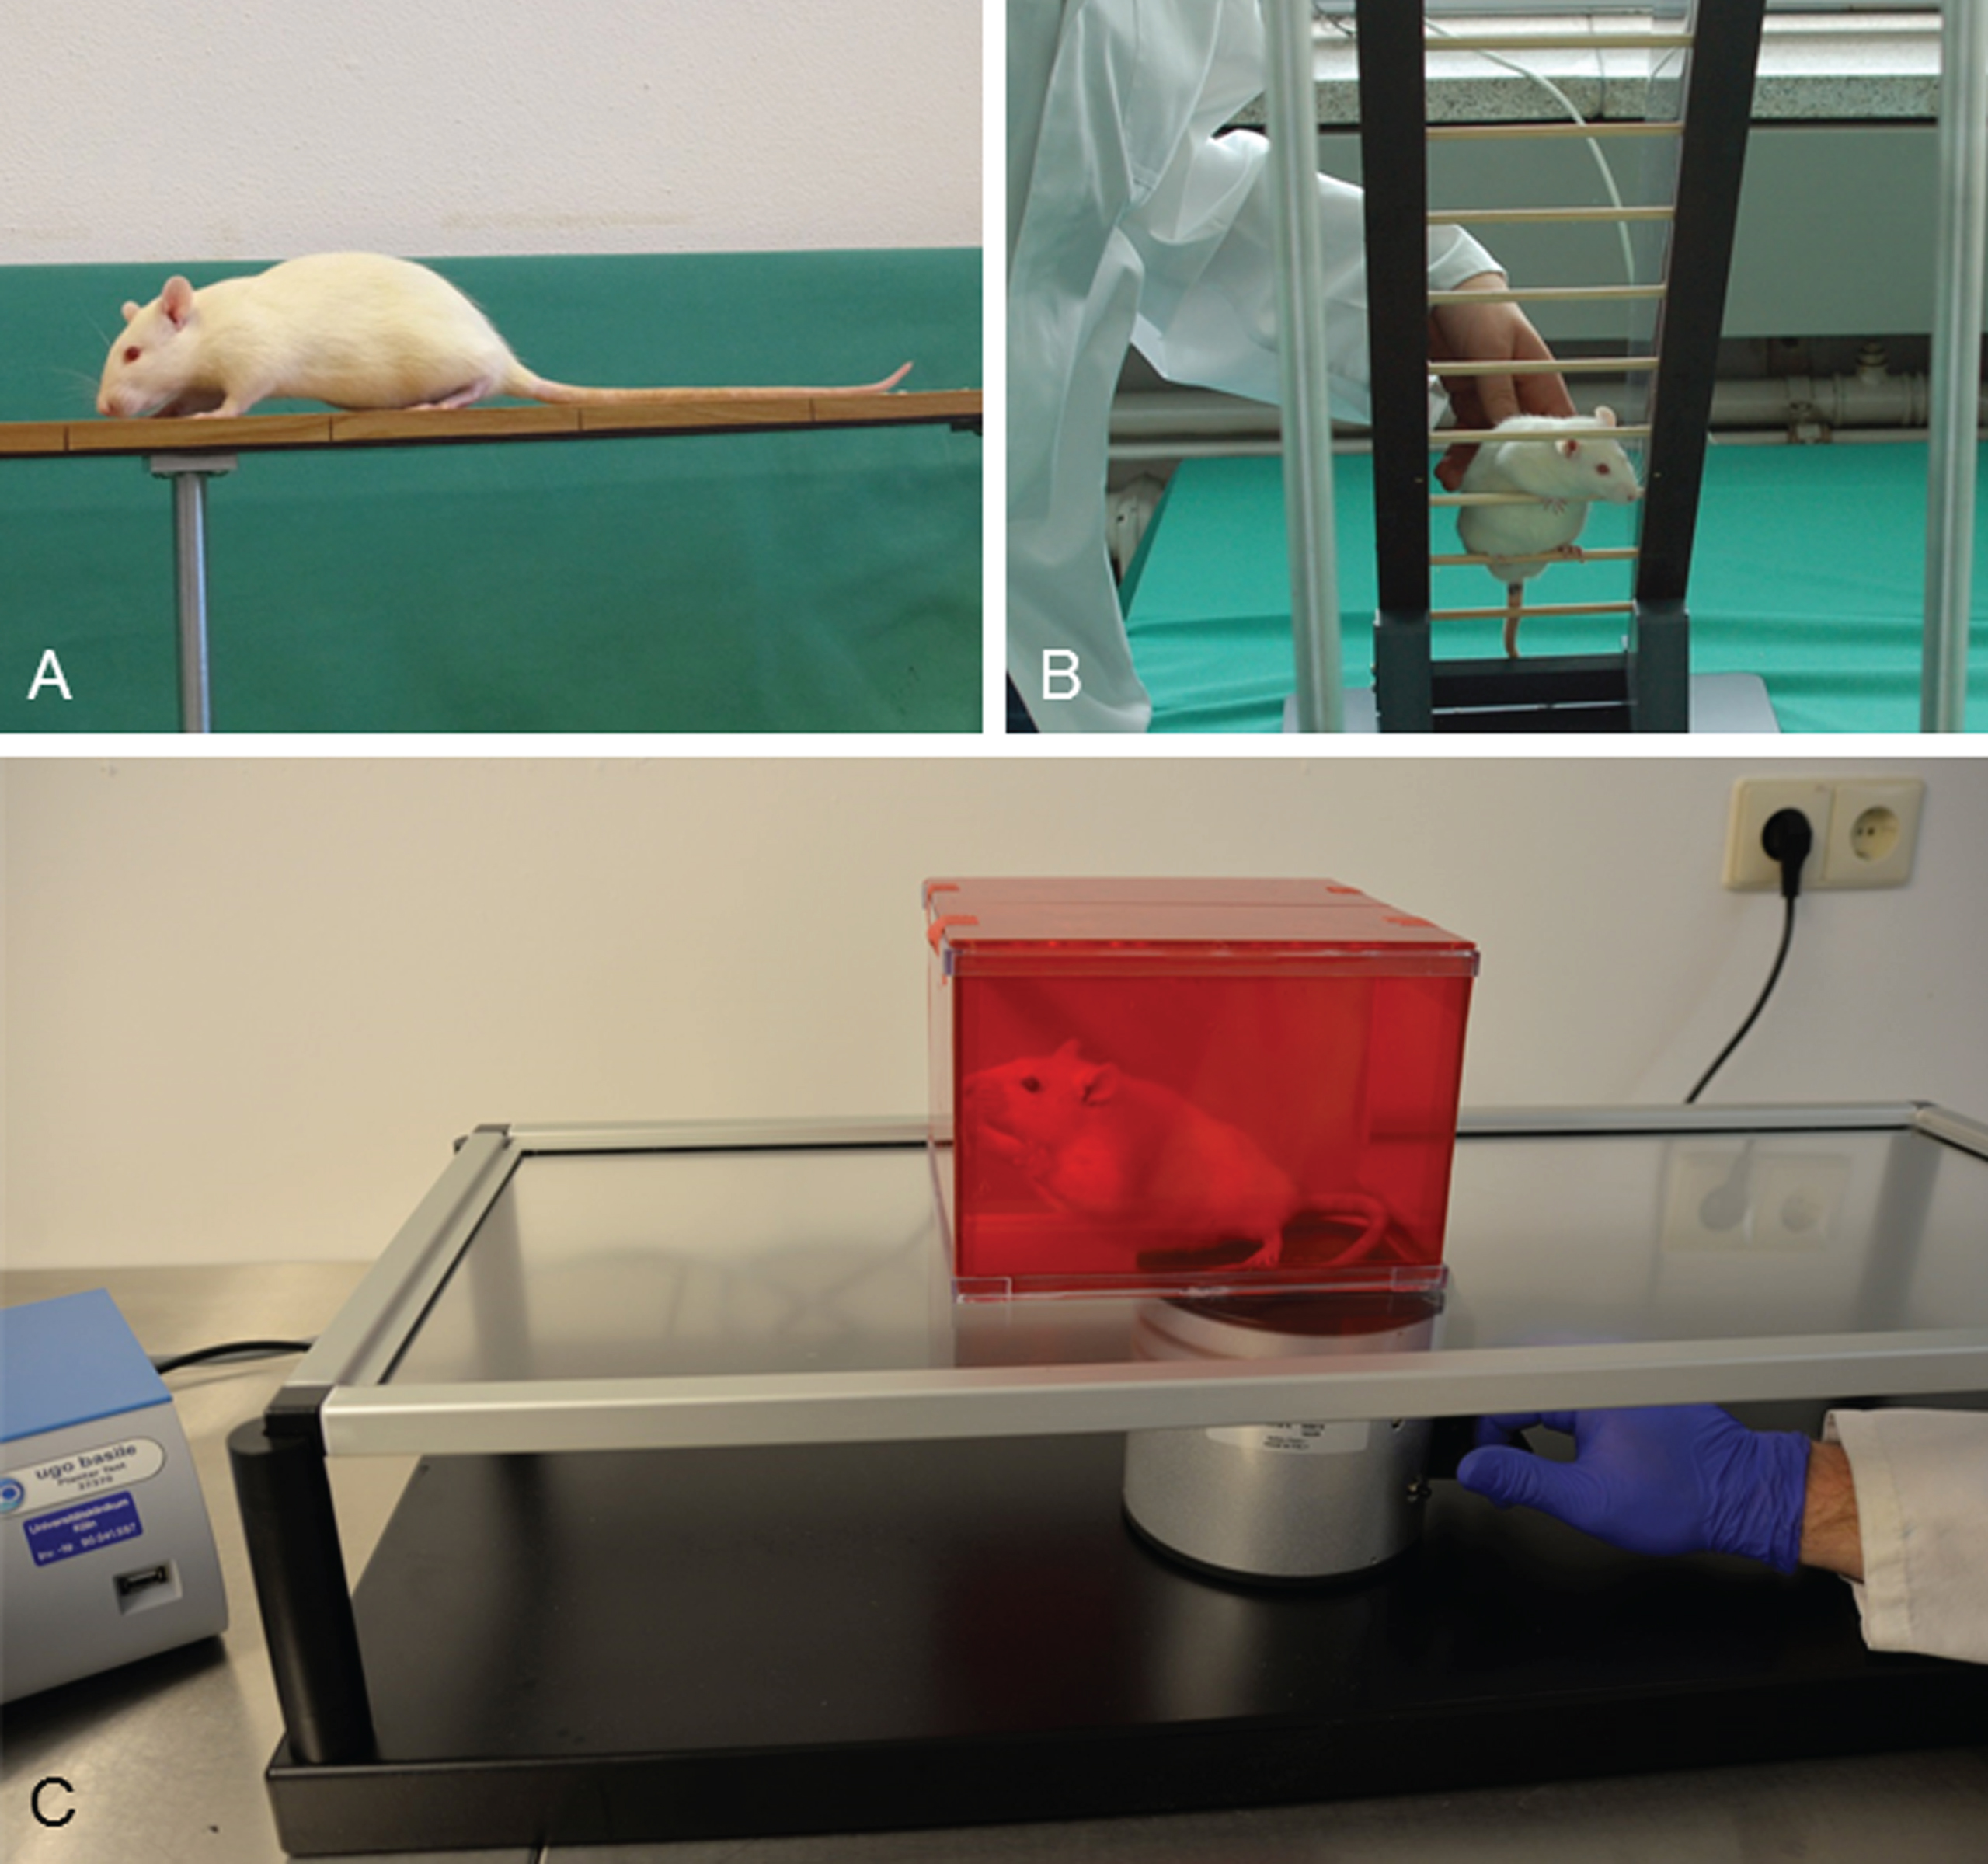
Conditioning of the rats was performed daily over two weeks before SCI. A: Walking on a wooden beam. B: Climbing on an inclined ladder. Adopted from Manthou et al. (2015). C: Sensitivity tests with the automated plantar “Anesthesiometer” (Ugo Basile Thermal Plantar™ Analgesia Instrument).
We used a technique previously established in our lab (Semler et al., 2011) to induce spinal cord compression injury. The spinal cord was compressed to 50% of its intact diameter at the level of segment Th10 at compression velocity 100 mm/sec) for 1 s. (Fig. 2 A, B). Operations were performed by Habib Bendella, Gregor Stein, Svenja Rink and Aliona Woehler.

The self-made spinal cord compression device after Curtis et al. (1993). (A) A stereotaxic frame with the device mounted on a metal plate. (B) Driven by timed current, the drive pin of an electromagnet closes the forceps by pressing the moving blade of the forceps. Total closure is prevented by a limiting pin, which passes through a hole drilled in the stationary blade. A, B: adopted from Semler et al. (2011). C: Vertebral column and spinal cord of an animal fixed by perfusion. The lesioned portion of the spinal cord between vertebrae T7-T9 is indicated by the vertical lines. Exactly this portion of the spinal cord was removed and cut in longitudinal sections. D: A 25-μm longitudinal section of a rat spinal cord dissected 12 weeks after SCI. Cresyl violet staining. Note fluid-filled cavities occupying most of the area at the lesion site. Similar spaced-serial sections were used to estimate the lesion volume applying the Cavalieri principle. E: Determining the portion of spared white matter after SCI. A small sample of the spinal cord containing the lesion site was dissected free and embedded in Epon 812. F: Semithin sections stained with toluidine blue were used to determine the area of the vacuole and the entire area of the cord.
Rats were kept at 37°C for 12 hours to prevent hypothermia. They were then housed individually in standard cages and the bladder voided manually two times a day.
Recovery of motor functions after SCI. Ground locomotor functions were evaluated using the Basso, Beattie, Bresnahan (BBB) rating scale (Basso et al., 1995). Scoring was undertaken by two independent investigators (Svenja Rink and Kurdin Alsolivany) observing video recordings at slow playback speed (Fig. 3A). Assessment was performed prior to injury (0 weeks) and 1, 3, 6, 9 and 12 weeks after SCI.
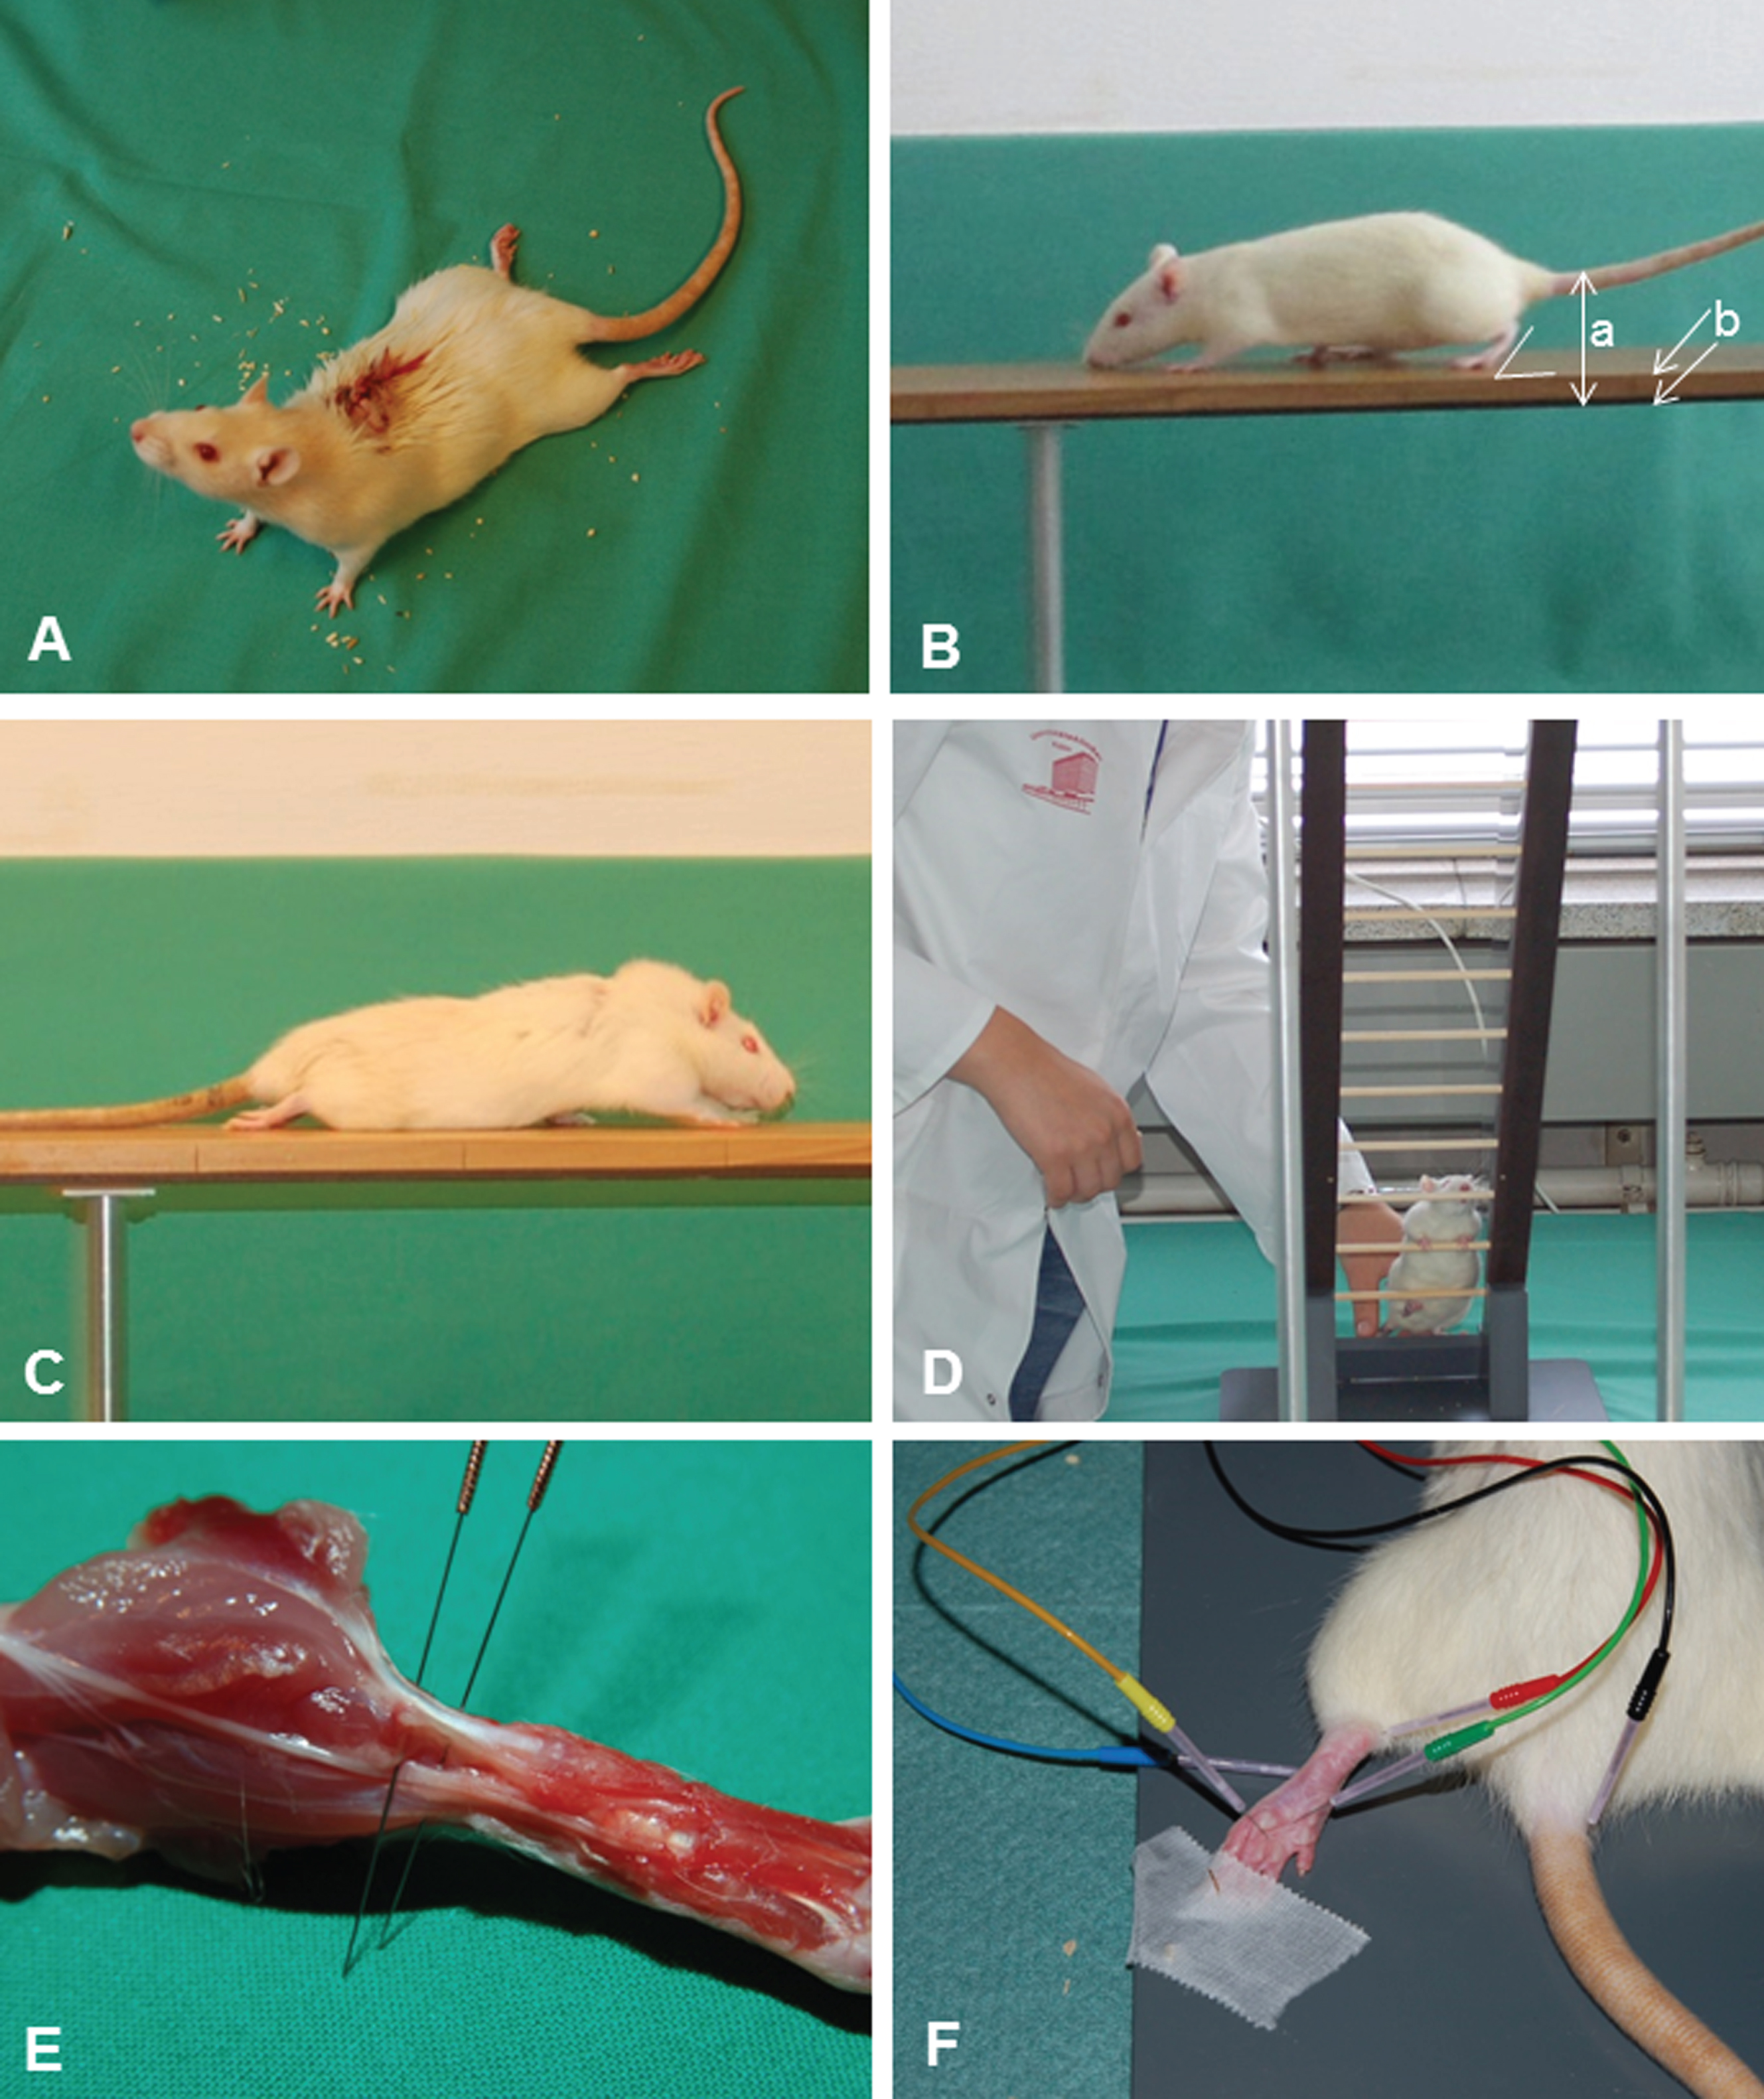
A: Locomotor functions were evaluated using the Basso, Beattie, Bresnahan (BBB) rating scale (Basso et al., 1995). Scoring was done by two independent investigators who watched video recordings at slow playback speed. Assessment was performed prior to injury (0 weeks) and 1, 3, 6, 9 and 12 weeks after SCI. B: Beam walking analysis of an intact rat. The foot-stepping angle (FSA) for the left hindpaw and the distances a (rump height) and b (beam width) used for calculation of the rump-height index (RHI = a/b) are drawn. C: A rat at 1 week after SCI walking on the platform towards its home cage. A, B, C: adopted from Manthou et al. (2015). D: Ladder climbing of a representative rat at 12 weeks after SCI: the animal is moving up using usually only its forepaws, the hindlimbs are hanging in front of or behind the rungs and do not support climbing. E: H-reflex recordings from the plantar musculature: demonstration of the exact anatomical positioning of the electrodes (cathode proximal, anode distal) in relation to the Achilles tendon of a sacrificed animal used for training. F: Distribution and insertion of electrodes during measurement (the cathode was red and always proximal; the anode was blue and always distal). A ground needle electrode (black) was applied at the base of the tail. During recording, a reference stainless steel electrode (green) was fixed to the skin between the first and second digit and an active recording electrode (yellow) inserted between the second (intermediate) and third (lateral) cuneiform bones. Adopted from Manthou et al. (2015).
Single-frame motion analysis (SFMA) was performed on a walking platform (“beam”) and an inclined ladder as described (Semler et al., 2011; Wirth et al., 2014). Rats were video-recorded prior to SCI and 1, 3, 6, 9 and 12 weeks after SCITwo parameters were measured: foot-stepping angle (FSA) and rump-height index (RHI; Apostolova et al., 2006). Analyses were performed by one investigator who had no information about the groups.
The FSA is the angle, at which the hind paw is placed on the ground at the beginning of the stance phase (Fig. 3B). The angle is defined by a line parallel to the dorsal surface of the paw and the horizontal line and is measured using video frames, in which the paw is seen in initial firm contact with the ground. In intact rats, the stance phase is well defined and the angle smaller than 20°. After spinal cord injury, rats drag their hind limbs with dorsal paw surfaces facing the beam surface and the angle increases to 130°–140° (Fig. 3C).
The RHI is defined as height of the rump, i.e. the vertical distance from the dorsal aspect of the animal’s tail base to the beam, normalized to the thickness of the beam measured along the same vertical line (Fig. 3B).
Ladder climbing test. After the beam-walking test, rats were video recorded during climbing up an inclined ladder as described previously (Wirth et al., 2013). The rats were placed at the bottom rungs of the ladder and climbing was video recorded from a position “below” the ladder, i.e., viewing the ventral aspect of the animals (Fig. 3D). The ladder climbing analyses were performed by two investigators (Svenja Rink and Kurdin Alsolivany) who had no information about the groups.
The functional status of the bladder in our experiments was assessed immediately prior to each manual voiding i.e. 2 times daily (about 7:00 and 19:00 o'clock) using an earlier described scoring method (Ramsey et al., 2010; Wirth et al., 2014).
As described previously (Fouad et al., 2009), a subset of data, collected mid-week (Wednesday) during every week of the experiment (surgery on a Wednesday) is presented in Fig. 4.
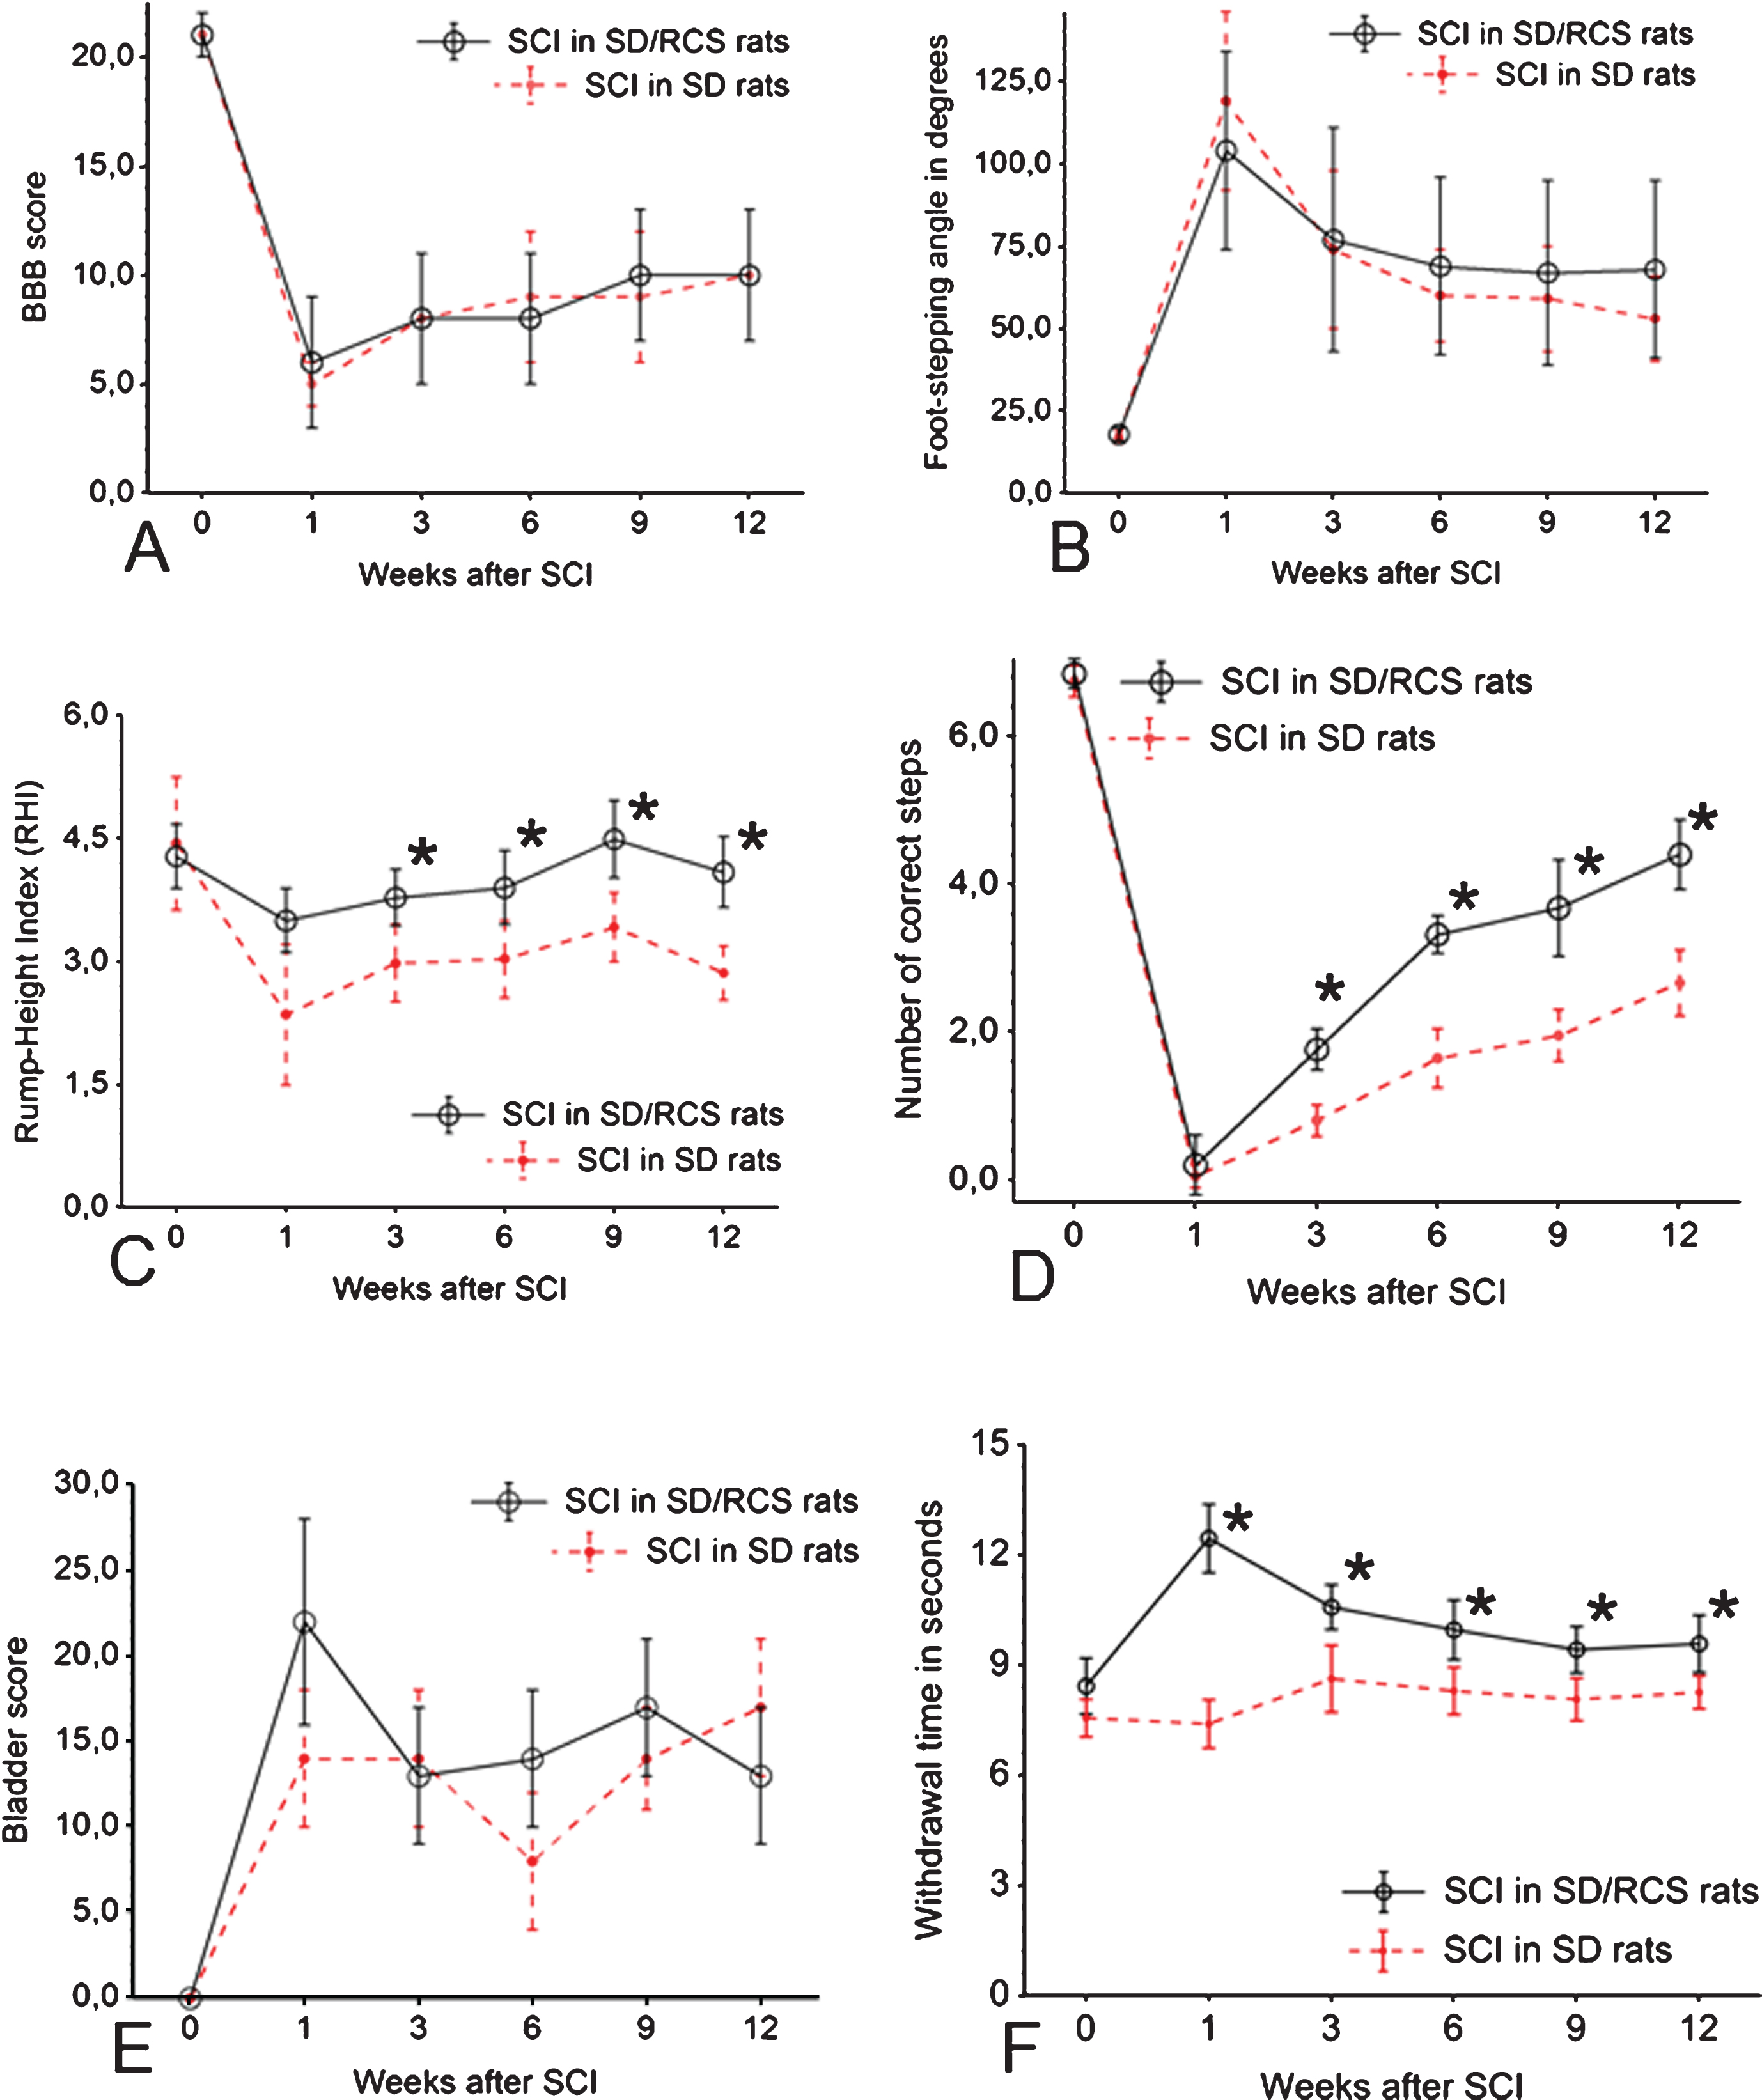
Time course of the changes in BBB (A), FSA (B), RHI (C), CLS (D), bladder score (E) and sensitivity (F) in the sighted SD group (depicted by the dotted line) as compared to the SD/RCS-group shown by the continuous line. Shown are group mean values±S.D., N = 10 rats per group.
Sensitivity. It is well known that at least some of the tail flick or foot withdrawal is under spinal control so that any changesmight reflect impaired function of spinal neurons rather than impaired communication between periphery and brain. To determine the paw withdrawal latencies (PWL) at the L4/L5 dermatome border zone we used the automated plantar “Anesthesiometer” (Ugo Basile Thermal Plantar™ Analgesia Instrument, Stoelting Europe, Dublin, Ireland; Fig. 1C). Sensitivity tests were performed on days 0 (immediately prior to surgery) and at 1, 3, 6, 9 and 12 weeks after SCI. Both hind paws (left and right) and the tail were stimulated with an infrared wave at 50°C three times and the results were averaged (Carlton et al., 2009; Chew et al., 2013; Hargreaves et al., 1988; Takahashi et al., 2003). Before testing animals were placed in red acrylic restraining boxes on the glass plate and acclimated for 15–30 min or until exploratory behavior ceased. The laser system (made in-house) was comprised of a microprocessor controlled 980 nm (near infrared) continuous wave, solid-state laser (4 watt) with a spot diameter of 2 mm. The parameters of the laser were set so that the temperature of the glass ramped from 23 °C to 52 °C over 12 s with a cutoff at 15 s. Measurements were performed by two inverstigators (Sina Wennmachers and Habib Bendella) who were blinded to the groups.
We selected the H reflex in the plantar hindfoot muscles for analysis. Previous work (Valero-Cabre et al., 2004) has shown that, after SCI, the changes in the H reflex of the plantar hindfoot muscles were similar to those in other hindlimb muscles, e.g. the gastrocnemius and the anterior tibial muscles.
Experiments were performed in a Faraday cage made of copper metal mesh as already described (Wirth et al., 2014 Tibial nerve stimulation was performed by means of two needle stimulating electrodes (stainless steel, diameter: 0.4 mm) placed direct on the medial aspect of the tibial nerve close to Achilles tendon (Fig. 3E). A ground needle electrode (stainless steel, diameter: 0.4 mm, black in Fig. 3F) was applied at the base of the animal’s tail. For recording, a reference stainless steel electrode (green in Fig. 3F) was fixed to the skin between the first and second digit and an active recording electrode (Tungsten, diameter: 0.25 mm, yellow) was inserted between the second (intermediate) and third (lateral) cuneiform bones.
The amplitudes of M- and H-waves were measured in mV as peak-to-peak values, averaged (excluding the first response at each frequency) and used to calculate H/M ratios. The maximum M- and H-waves were measured from recordings at baseline stimulation rate (0.1 Hz, Fig. 5A, B) and used as estimates of the H-reflex excitability (Lee et al., 2009). The latencies of the responses were measured as time in seconds elapsed between trigger stimulus and peak of the M-wave (A-latency) and between the peaks of the M- and H-wave (C-latency). Data were analyzed using the LabChart software. Measurements performed by two investigators (Svenja Rink and Kurdin Alsolivany) who had no information about the groups.

Time course of the changes in amplitude of H-wave (A), M-wave (B), A-latency (C) and C-latency (D) and in the sighted SD group (depicted by the dotted line) as compared to the SD/RCS-group shown by the continuous line. Shown are group mean values±S.D., N = 10 rats per group.
Spinal cord lesion volume in longitudinal sections was determined as described earlier (Semler et al., 2011; Wirth et al., 2014). Twelve weeks after SCI, rats were deeply anesthetized with an overdose of isoflurane and perfused transcardially with phosphate buffered saline (PBS) for 60 seconds followed by 4% formaldehyde in 0.1 M phosphate buffered saline (PBS), pH 7.4, for 20 min. The spinal cord between vertebrae T7-T9 was dissected free (Fig. 2C). and cut on a cryostat into longitudinal sections (25μm). A fractionator sampling strategy (Gundersen et al., 1988) was applied and each 5th longitudinal section (a total of at least 10 equidistant sections through the spinal cord) was stained with cresyl violet (Nissl) stain; Fig. 2D). A Zeiss microscope equipped with a CCD Video Camera System (Optronics Engineering Model DEI-470, Goleta, CA, supplied by Visitron Systems, Puchheim, Germany) combined with Image-Pro Plus 6.2 software (Media Cybernetics, Silver Spring, MD, USA) was used to quantify the areas (in μm2) of the lesions at a primary magnification of×2.5. The total lesion volume was calculated using the Cavalieri method (Gundersen et al., 1988; Gundersen & Jensen, 1987; West & Gundersen, 1990). Measurements were performed by 2 observers (Ramona Jansen and Zeynep Isik) blinded to the groups.
Extent of white matter sparing evaluated in transverse sections. In two animals from each experimental group, we also evaluated white matter sparing at the lesion site from transverse sections. Following perfusion fixation (see above) 3-4 mm long thoracic spinal cord segments containing the injury site were dissected free (Fig. 2E) and postfixed in 4% paraformaldehyde and 2,5% glutaraldehyde in phopsphate-buffered saline pH 7.4. Following postfixation in 1% OsO4 with 1.5% K3FeIII(CN)6 in 0.1 M cacodylate buffer pH 7.2, samples were embedded in Epon 812 and after polymerization for 48 h at 70°C cut in 0,5 –1.0μm thick transverse sections. A fractionator sampling strategy (see above) was used again and every 50th section (a total of at least 80 equidistant sections through the thoracic spinal cord) was stained with with 1% toluidine blue The areas (in μm2) of the lesions in each tissue section were determined at a primary magnification of×4 (Fig. 2F). Measurements were performed by 2 observers (Doychin Angelov and Habib Bendella) blinded to treatment group.
Immunohistochemistry for microglia/macrophages and for astrocytes
We stained longitudinal sections through the lesion site, i.e. those sections that remained after determining the lesion site volume. Due to the different dimensions of the post-compression vacuole (Fig. 6) in the different animals, it was impossible to perform reliable quantitative measurements.
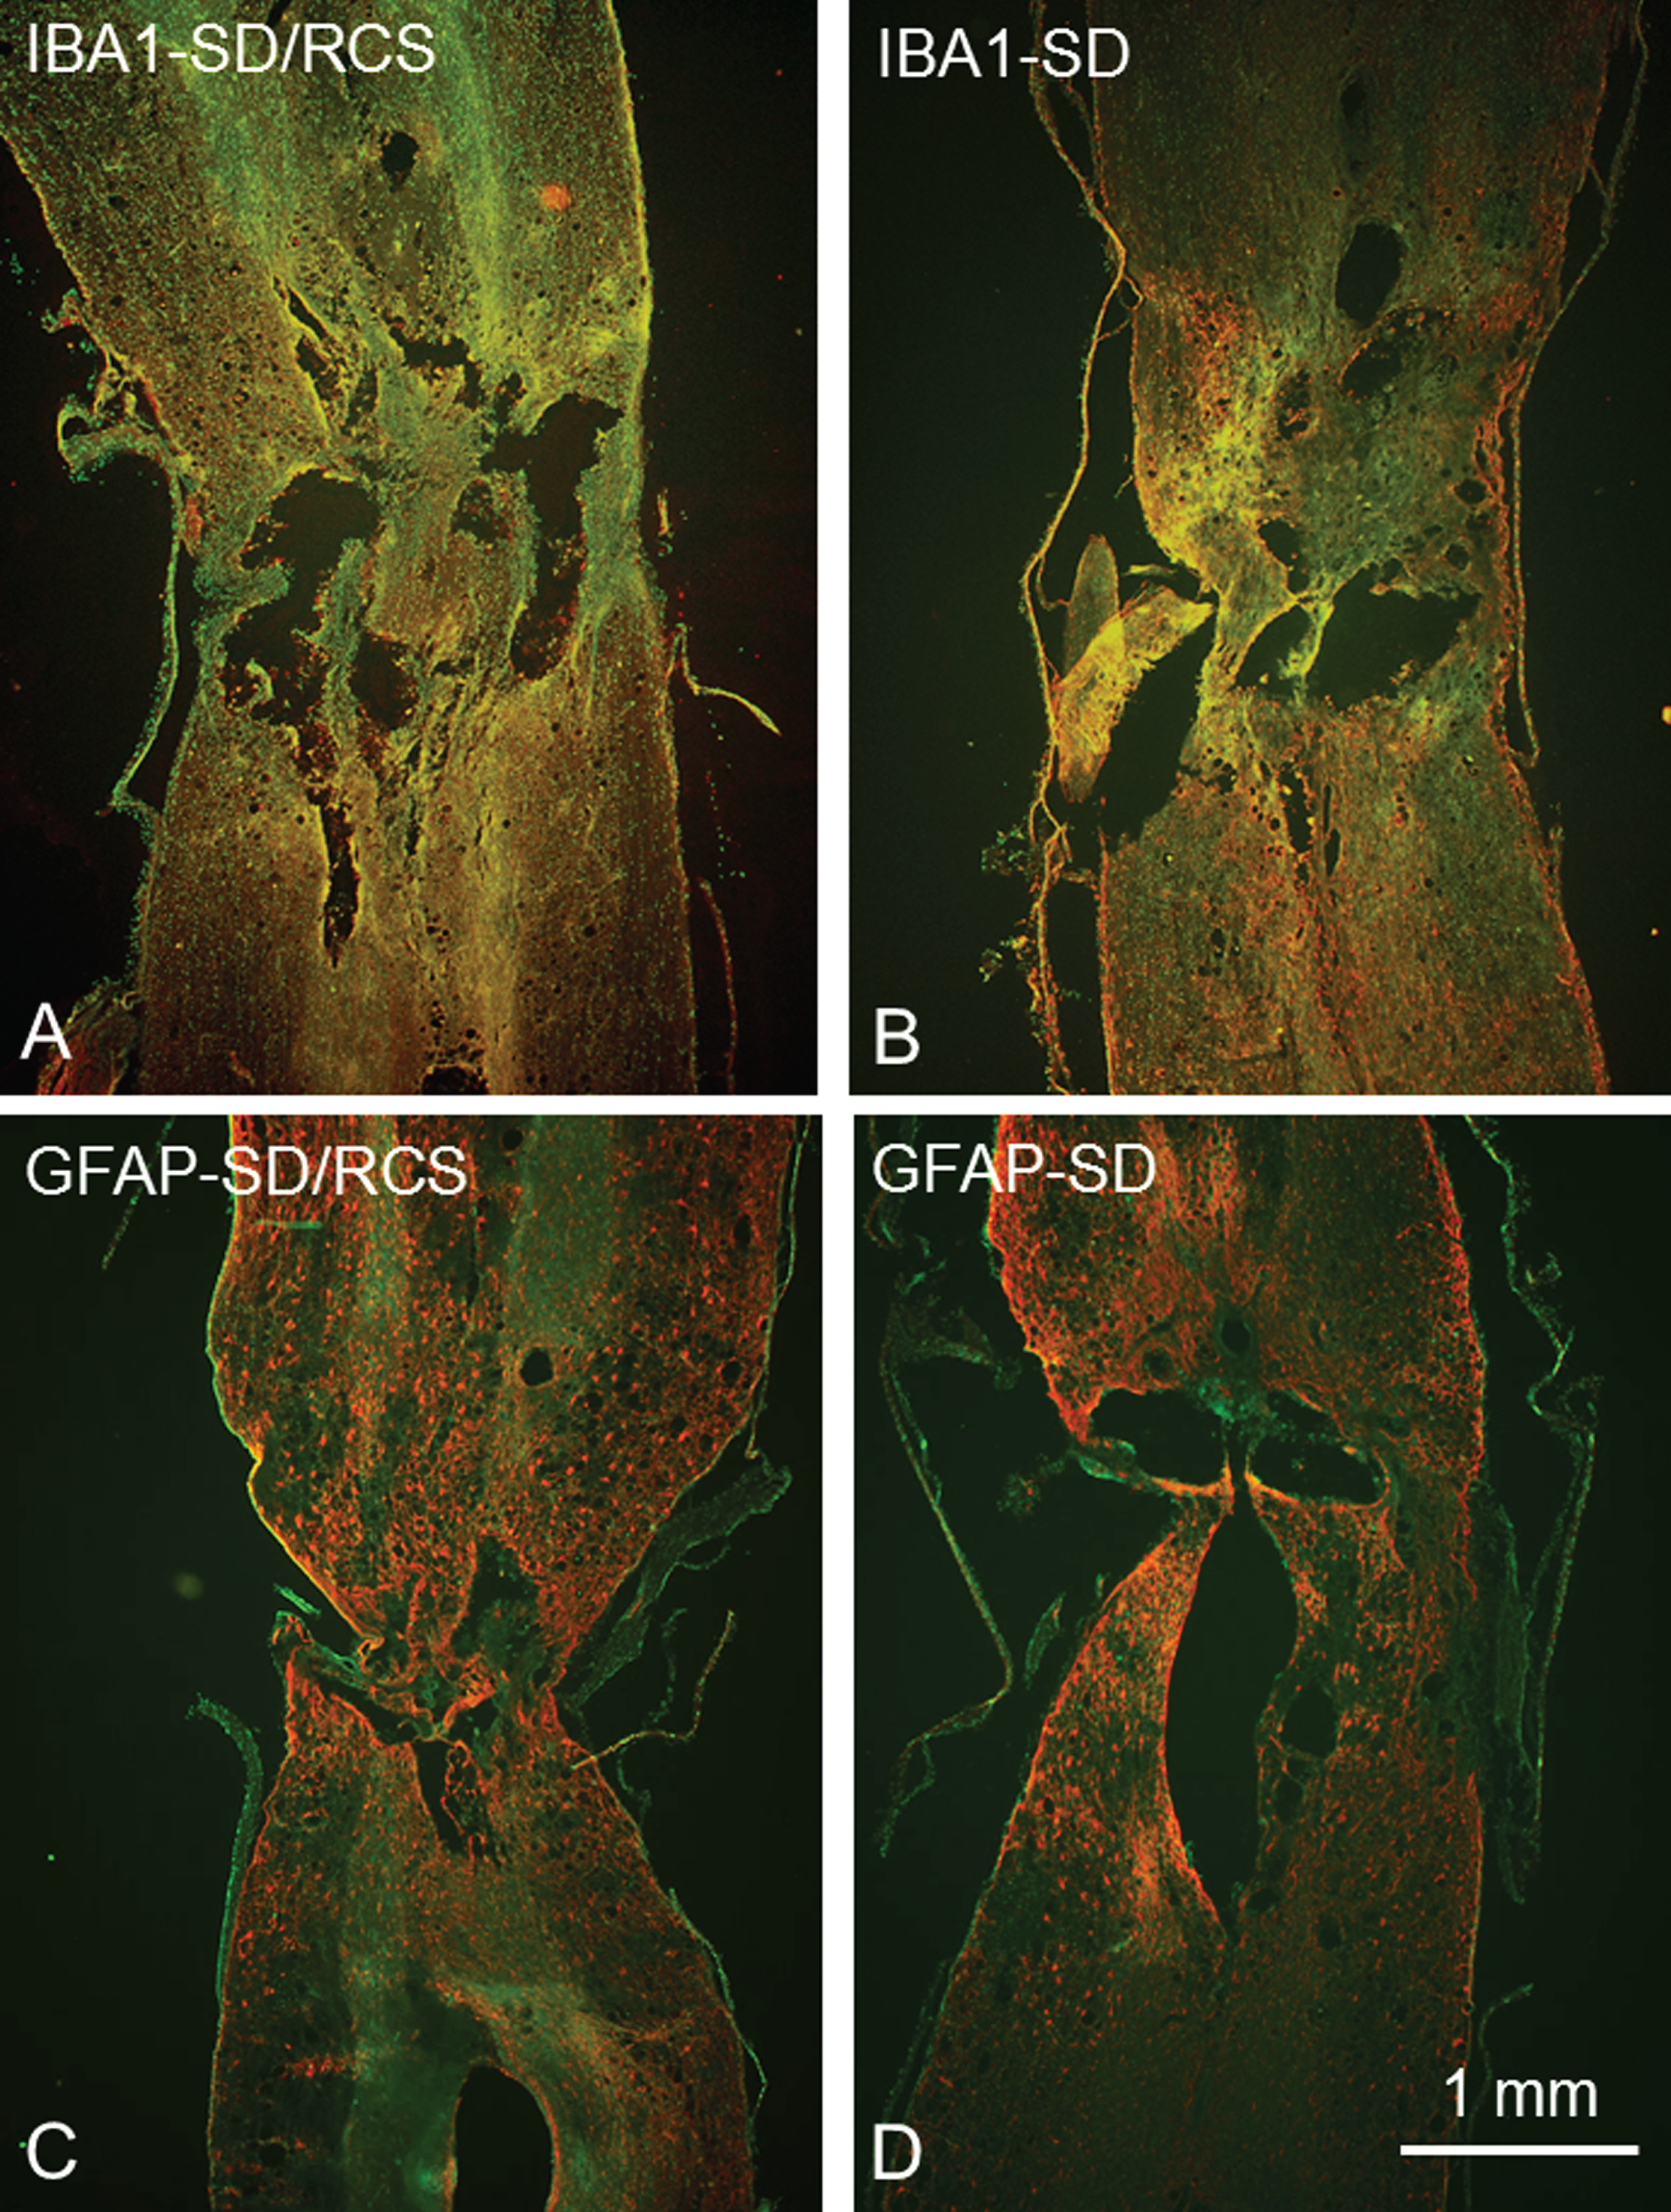
Overview of the longitudinal sections through the lesion site of SD/RCS rats (A, C) and SD rats (B,D) after immunostaining with anti IBA1 plus anti-rabbit IgG conjugated with Cy3 for microglia (red cells in A, B) and with anti- GFAP plus anti-guinea pig IgG conjugated with Cy3 for astrocytes (red cells in C, D). 25μm thick cryosections, counterstaining in green with NeuroTrace 500/525.
This is why we used transverse sections through the lumbar enlargement, i.e. tissue that was below that used to assess lesion volume from longitudinal sections. Following cryoprotection in 20% sucrose in PBS overnight, serial transverse sections of 25μm thickness were obtained from the whole segment on a cryostat (CM3050; Leica, Nussloch, Germany). Sections were collected on Super-Frost Plus glass slides (Roth, Karlsruhe, Germany) so that 10 sections 250μm apart were present on each slide. One series of such 10 spaced serial sections on a single slide was thus representative for the entire lumbar spinal cord segment of one rat (Apostolova et al., 2006).
For immunohistochemistry, the following commercially available antibodies were used at optimal dilutions: For microglia/macrophage staining, we used rabbit polyclonal anti-Iba1 antibody (1:1000; Synaptic Systems, Göttingen, Germany, Cat. Nr. 234003) to target the ionized calcium binding adapter molecule 1 (Iba1), a microglial cell surface molecule which identifies both resting and activated microglia and blood-derived infiltrating macrophages. For the astrocyte GFAP staining sections were incubated with guinea pig polyclonal anti-GFAP (1:4000; Progen, GP52).
The general staining protocol, also used in our previous studies, is based on a method described by Sofroniew and Schrell (1982) allowing repeated use of antibody solutions (stabilized by the non-gelling vegetable gelatin lambda-carrageenan and sodium azide), convenient incubation in jars and high reproducibility. This gave us the possibilty to incubate in one and the same jar slides with sections from 10 rats (5 SD and 5 SD/RCS) simultaneously. Sections (on slides) from the spinal cords oft he the remaining rats (5 SD and and 5 SD/RCS) were stained by a next incubation in the same solutions.
Both primary antibody solutions contained 0.5% w/v -λ-carrageenan (a non-gelling vegetable gelatin which reduces unspecific binding and stabilizes the antibody solution, Sigma) and 0.02% w/v sodium azide.
The staining protocol has been described previously (Irintchev et al., 2005; Manthou et al., 2017). Water-bath antigen demasking was performed in 0.01 M sodium citrate solution, pH 9.0, for 30 min at 80°C (Jiao et al., 1999) for all antigens. The following cyanine 3 (Cy3)-conjugated secondary antibodies were used: goat anti-rabbit and goat anti-guinea pig [Jackson ImmunoResearch (West Grove, PA) via Dianova, Hamburg, Germany]. After a subsequent wash in PBS, cell nuclei were stained for 10 min at RT with NeuroTrace 500/525 (1:200; Molecular Probes, N21480, via Life Technologies GmbH, Darmstadt, Germany).
We used an Axioskop 50 epifluorescence microscope (Axioplan, Zeiss, Oberkochen, Germany; stabilized powerful uv source: XBO 75W/HBO100W) with “rhodamine” (No.15 Carl-Zeiss) and “fluorescein” filters (No. 9 Carl Zeiss). Color images were captured by a slow scan CCD camera (Spot RT, Diagnostic Instruments) or a CCD Video Camera System (Optronics DEI-470, Goleta, CA, USA) and Image-Pro Plus Software (Version 6.2, Media Cybernetics, Inc., Silver Spring, MD, USA). Exposure times were optimized to ensure saturation of only a few pixels. All images were captured under identical conditions.
To quantify Iba1 and GFAP immunofuorescence, we used a×10 objective with a constant ellipsoidal area of interest (AOI) with 845μm for the long axis and 780μm for short axis (AOI = 517656μm2 = 0.517656 mm2 ≈ 0.5177 mm2 ; Figs. 7 A, B; 8 A, B). For this series of sections, only a few pixel numbers were detectable at a gray scale value over 130 and mostly resembled bright artefacts. We therefore only included pixel numbers in the range 31–130.
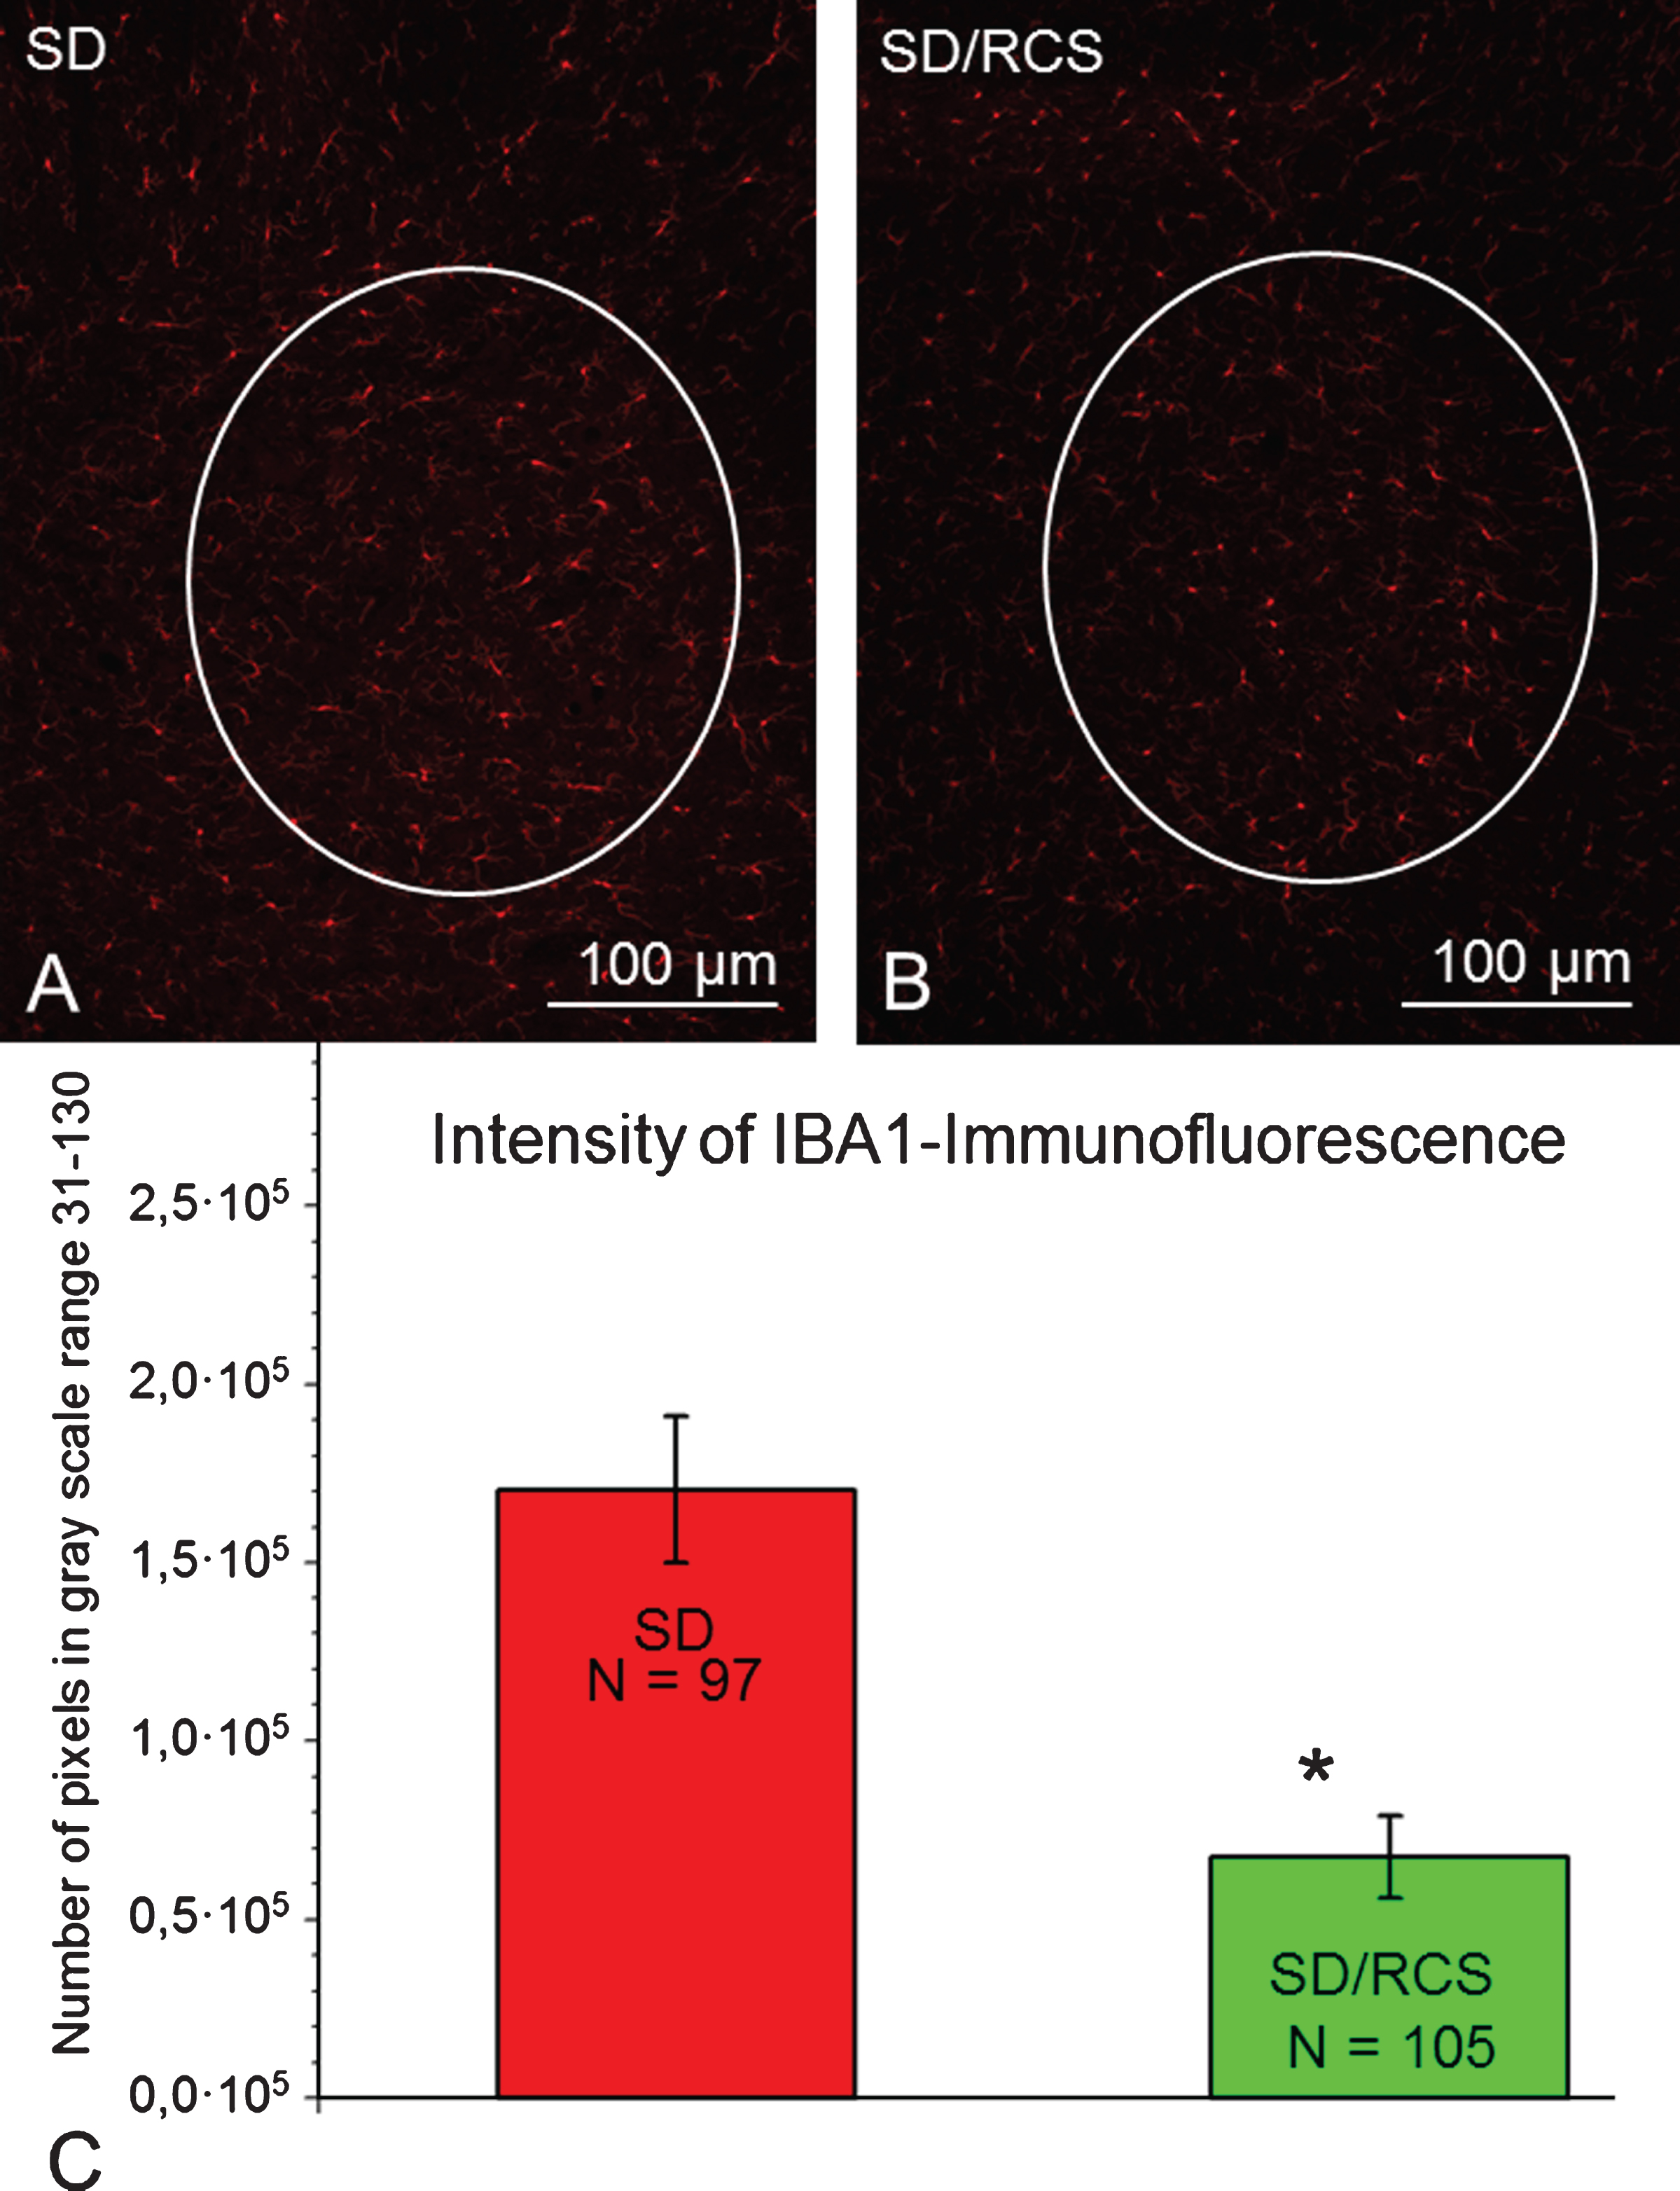
Selected areas of interest (AOI, white line) included IBA1-immunofluorescent microglia/macrophages in the ventral horn. Representative images from a SD- (A) and SD/RCS rat (B). C: IBA1- immunofluorescence per AOI at 12 weeks after SCI was significantly greater in the SD group compared to SD/RCS (*p < 0.05).
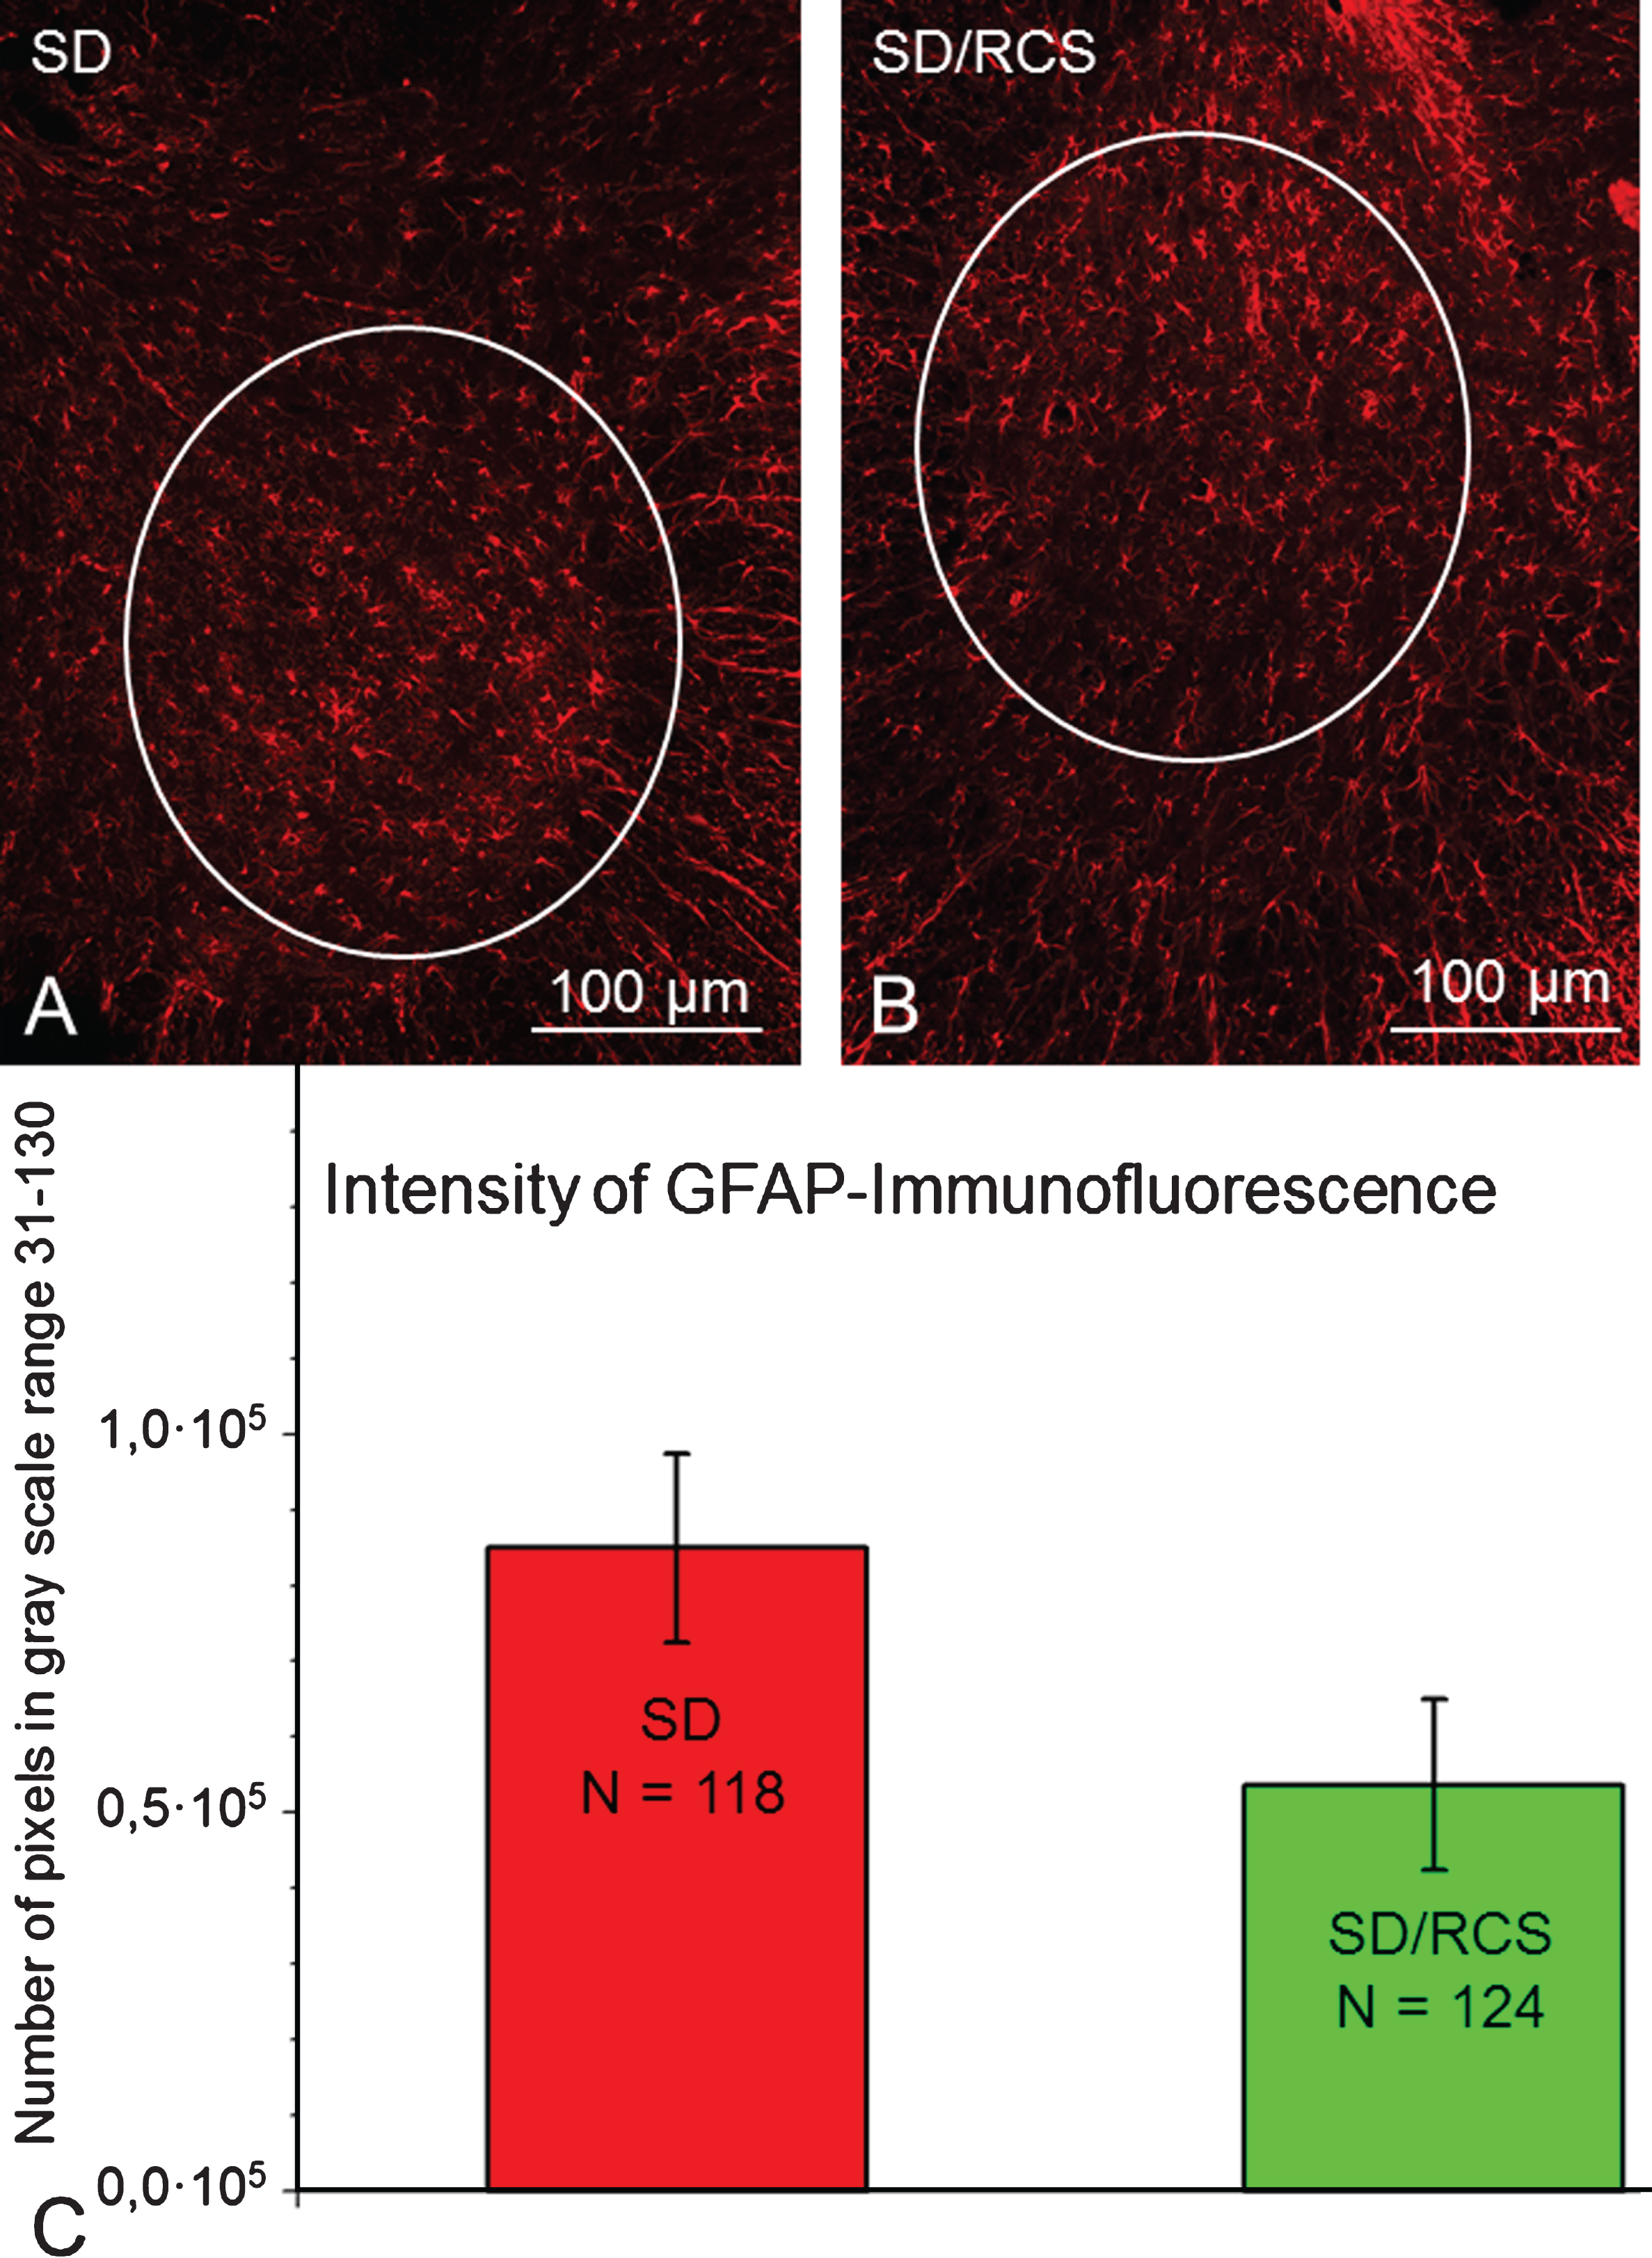
Selected areas of interest (AOI, white line) included neuropil localization of GFAP in the ventral horn. Representative images from a SD- (A) and SD/RCS rat (B). C: Total amount of GFAP- immunofluorescence per AOI at 12 weeks after SCI. There were no significant differences between both groups (p > 0.05, one-way ANOVA).
These experiments generated diverse types of data that required the following approach to their statistical analysis.
Data were analyzed for differences in distribution and variance using ANOVA. Time related changes were established by means of repeated measures ANOVA, while for data measured once and for comparisons between groups at specific time points we used one-way ANOVA followed by appropriate post-hoc tests. Kruskal-Wallis one-way ANOVA on ranks followed by Dunn’s post-hoc test was performed if the sample variables violated the assumptions for the parametric ANOVA (Iba1- and GFAP immunofluorescence) or the variable was measured on an ordinal scale (bladder status).
Statistical analyses of the functional locomotor assessment (BBB, FSA, RHI), spinal cord lesion volume, GFAP- and Iba1-immunofluorescence measurements and the correlation analysis were performed using Sigma Plot software (v.11 and 18; SPSS, Chicago, IL, USA).
All data are presented as group mean±standard deviation (SD) unless stated otherwise. For all statistical tests, the significance level for acceptance of differences was set at p≤0,05.
Results
No differences in recovering locomotor functions (BBB-score) between SD and SD/RCS rats after SCI
We first analyzed locomotor function using the BBB rating scale. At 1 week after SCI, mean BBB scores in both groups were similar (Fig. 4A), indicating that the groups were equivalent in terms of lesion severity. These BBB scores show that the spinal cord compression had produced, as intended, a severe injury with complete hindlimb paralysis or only slight movements in 1–3 joints in all groups.
During the following weeks, a statistically significant improvement was observed in all groups of lesioned rats, which we attribute to the natural process of recovery from spinal shock and wound healing involving natural removal of tissue debris and hematomata at the lesion site, deactivation of microglia to a resting state, attempted regrowth of axons, etc. A real recovery of BBB, however, did not occur.
No differences in recovering plantar stepping (FSA) between SD and SD/RCS rats after SCI
Analysis of stepping using FSA revealed, as for BBB scores, similar degrees of impairment after SCI (Fig. 4B). In both groups, the angle changed from an average of about 20° prior to injury to 100–120° at 1 week and only gradually and slightly decreased thereafter to an average of about 70° at 12 weeks. Angles larger than 90° indicate, that the dorsal surface of the toes or the paw, rather than the plantar surface, touch the surface during over-ground locomotion. Thus, most of the rats recovered plantar stepping after the 3rd week of the observation period. At 12 weeks, mean FSA reached about 70° indicating a stable transition to plantar stepping. As for BBB scores, we observed no differences in the recovery of plantar stepping between both groups of rats.
Better recovery of body support (RHI) and skilled limb movements (CLS) in the SD/RCS group
The RHI estimates the ability of the hindlimbs to support body weight during over-ground locomotion. This ability was significantly impaired 1 week after SCI in both groups (Fig. 4C). Rats moved along the beam using the forelimbs while the hindlimbs were dragged behind and could not elevate the trunk above the beam surface. In the following weeks, RHI improved moderately, and to almost identical degree in both groups. At 12 weeks, the rump could be lifted to about one-fourth of the pre-operative rump height: a higher RHI was found in the SD/RCS rats at 3–12 weeks (Fig. 4C). At 12 weeks, the SD/RCS rats were able to lift their trunk on average to more than half the normal rump height (p < 0.05).
Better recovery of skilled limb movements (CLS) in the SD/RCS group
The fourth functional parameter was the number of correct ladder steps during inclined ladder climbing. Proper placement of the paws and maintenance of a stable paw position on the rungs to support body weight during climbing require higher levels of motor and sensory control than over-ground locomotion. Prior to SCI, the average number of correct ladder steps was about 7 in both groups.
One week after SCI, no animals were able to step on the rungs (Fig. 4D). Improvement with time after injury was minimal but could be detected as early as 3 weeks after SCI. On the average, at 12 weeks after SCI 2 correct steps werw achieved in the SD group and 3-4 correct steps in the SD/RCS group (Fig. 4D). This difference was statistically significant.
No differences in bladder score between both strains
In addition to locomotor recovery, we analyzed changes in bladder function during the observation time period using a rating scale. Prior to operation, the score was zero indicating that the bladders were normally emptied, i.e. normally functioning.
At one week after SCI, all injured rats were unable to void the bladder spontaneously and the average scores increased in both SCI groups Thereafter, in SD and SD/RCS groups bladder function showed no improvement throughout the 12-week observation period (Fig. 4E).
Better motor recovery in SD/RCS rats is accompanied by lower thermal sensitivity of the hindlimbs
For the last functional measurement rats were were exposed to thermal stimulus and the withdrawal latency measured. In both groups the initial (pre-SCI) latency was 7–9 seconds, a value that only slightly changed within the following 12 weeks after SCI in the SD group. Starting at one week after SCI and continuing till the end of the post-operative period, the latencies in the SD/RCS group were always longer, which indicated a surprising reduction in protopathic sensitivity in the blind SD/RCS animals (Fig. 4F).
Better recovery of RHI and CLS in SD/RCS rats is not associated with alterations in motoneuron excitability
Previous work has shown that, in rodents, the plantar H-reflex is a useful tool to assess motoneuron excitability after SCI that correlates with severity of injury and locomotor outcome (Lee et al., 2009; Lee et al., 2005). Specifically, recovery of better locomotor abilities after incomplete SCI is associated with enhanced H-wave and attenuated frequency dependent depression (rate depression) of the H-reflex.
We analyzed the H-reflex in intact rats and in animals at 1, 3, 6, 9 and 12 weeks after SCI. Several variables were measured at baseline stimulation frequency (0.1 Hz): maximum M- and H-wave amplitudes (Fig. 5A, B), H/M ratios (Fig. 5E) and M- and H-wave latencies (Fig. 5C, D).
Amplitudes. In the SD group we observed a gradual increase in the M- and H-waves. In SD/RCS animals the amplitude remained rather constant and even slightly decreased. Thus, the values for both groups differed significantly at 6, 9 and 12 weeks after SCI (Fig. 5A, B).
H/M ratio. Despite a trend for higher H/M values in the SD/RCS rats, our measurements showed no significant differences between both groups (Fig. 5E).
Latencies. There were no differences in the time course of the A-latencies (between trigger stimulus and peak of the M-wave) between both groups (Fig. 5C). In contrast, for the C-latencies (time between the peaks of M- and H-waves) we observed a significant increase in the SD/RCS group (Fig. 5D). This might be an indication of slower conduction velocity or of larger distance. Since in our set the distance was always constant, we interpret this finding as an indication for a slowlier conduction along the afferent arm of the H-reflex in response to stimulation.
No differences between both groups in lesion volume
We next tested whether there were differences in the lesion volume in the thoracic spinal cord (Fig. 2C, D), a parameter known to affect the functional outcome of SCI (Jakovcevski et al., 2007). At 12 weeks after injury, we did not find significant differences in lesion volume among both experimental groups. The mean values were 5.2±1.4 mm3 in the sighted SD rats group (mean±SD; n = 8 rats) and 3.9±0.9 mm3 (mean±SD; n = 8 rats) in the blind animals.
White matter sparing at the lesion site
Cross sections through the epicenter of the injury (T8-T9) demonstrated a central lesion devoid of normal spinal cord tissue surrounded by a peripheral rim of preserved white matter containing the lateral and ventral funiculi (Fig. 2 E, F). The amount of preserved white matter was 44–48% of the cross sectional area regardless of the experimental group.
Less IBA1-immunofluorescence in the lumber ventral horn of the SD/RCS rats
Iba1-positive microglia/macrophages were readily observed in the ventral horn. Our quantitative analysis revealed significant weaker expression of Iba1 in the SD/RCS group (Fig. 7).
No differences in the extent of astrogliosis between both strains of rats
GFAP-immunofluorescence was also found and quantified in the lumbosacral intumescence. No significant differences between both groups were detected (Fig. 8).
Discussion
We investigated, whether parameters of structural and functional recovery from spinal compression injury in blind rats of the SD/RCS substrain differ from those in sighted SD rats. We found, that the blind animals recovered rump-height index (RHI, i.e. body weight support) and skilled hindlimb movements (number of correct ladder steps, CLS) better than the sighted control. This improved spontaneous functional recovery was accompanied by reduced expression of microglia in the lumbar enlargement (below the injury level) and by an unexpected lower thermal sensitivity in the hindlimbs and tail of the rats plus increased C-latency in the plantar musculature after electric stimulation of the posterior tibial nerve. In the following sections we shall try to elaborate on the possible mechanisms, how this surprising decrease in protopathic sensitivity could have promoted better recovery in the blind SD/RCS rats.
Combined methodological approach
The complex methodological approach which we use to determine recovery after SCI in rats includes functional, electrophysiological and morphological estimates.
The first impression from the comparisons between both groups of rats is that any of the parameters rump-height index (RHI) or correct ladder steps (CLS) which we used, would be sufficient to substantiate the conclusion that the SD/RCS rats recovered better than the SD ones (Fig. 4C, D). This is generally true but the use of the entire battery of measures provides the opportunity of a more reliable and comprehensive analysis of the motor deficits.
It is apparent, that each of the individual parameters supports and supplements in a meaningful way the other measures. This is important because, on the one hand, the numerical parameters estimate individual attributes of locomotion. For example, the foot-stepping angle (FSA) estimates only paw placement and the RHI measures body weight support. Both attributes are essential components of the BBB scale and their numerical estimates correlate well with the BBB scores.
However, the overall judgment of the walking abilities using these two parameters deviates from the BBB and FSA scorings (Fig. 4A, B). Such a deviation is expected, considering that the BBB scale includes, in addition to stepping and body weight support, other attributes (toe clearance and position, forelimb-hindlimb coordination) with increasingly stronger influence on the rating as locomotion improves. On the other hand, general measures like locomotor scores may oversee different degrees of changes in individual aspects of locomotion (Basso, 2004). These examples clearly demonstrate an advantage of the combined SFMA approach. The numerical parameters estimate distinct aspect of motion controlled by different neural circuitries. This allows, by combining the functional analysis with quantitative histology, to search for the neural substrates, for example, synaptic inputs to motoneurons or monaminergic innervation of the lumbar spinal cord, underlying specific functional outcomes (Manthou et al., 2017; Wirth et al., 2013).
Effect of residual or restored sensitivity for recovery after SCI
Residual or restored sensitivity is crucial for recovery of motor performance (Angeli et al., 2014; Cafferty et al., 2008). One of the essential criteria for recovery of hindlimb function is the preservation of spinal impulse conductivity (i.e. presence of tibial somatosensory potentials;) or lower limb light touch sensation (van Middendorp et al., 2011). This is why voluminous work has been performed to improve (restore) sensitivity after SCI. It is well known that physical activity improves general motor function following neurological impairment in clinical and experimental settings. Interestingly, several studies suggest that physical activity might be an effective treatment for improving sensory function (Harkema et al., 1997; Trimble et al., 1998).
Accordingly, it has been shown, that the effects of training (known to facilitate neuronal plasticity) depend on a pattern of muscle activation, that is similar to that found in individuals without injury. The crucial factor which is needed to trigger a locomotor EMG pattern in individuals with spinal cord injury is the afferent input from the load receptors (Harkema et al., 1997): without loading the sole of the foot during the stance phase no meaningful leg muscle activation occurs in individuals with complete spinal cord injury during supported stepping. Proprioceptive inputs from leg extensor muscles, and probably from mechanoreceptors in the sole of the foot, provide load-related afferent information. In addition, corresponding to studies in cats (Duysens & Pearson, 1998; Kriellaars et al., 1994), hip extension movements, i.e. hip-joint related afferent input (but less knee or ankle joint excursions) are essential for the initiation of the swing phase and the generation of a locomotor EMG pattern in people with incomplete spinal cord injury. Anyway, the exact nature of the operating mechanisms remains obscure.
Unfortunately, spinal cord injury is often associated with demyelination and severe sensory deficits including incapacitating neuropathic pain in body regions below the level of lesion termed “below-level central pain” (Davidoff et al., 1987; Waxman, 1989; Mariano, 1992; Siddall et al., 1999; Bandaru et al., 2014) and hyperrefexia (Advokat & Duke, 1999; Schmit et al., 2000;). The central sensory deficits, termed dysaesthesiae, take several forms including allodynia (painful responses to normally non-noxious stimuli) or hyperalgesia (exaggerated painful responses to noxious stimuli) (Christensen & Hulsebosch, 1997; Cruz-Almeida et al., 2012; Tan et al., 2007; Wu et al., 2013).
Rats of the SD/RCS strain have constitutively reduced sensory capacity
Whereas the dystrophic SD/RCS rat strain has been an object of numerous studies, only one report deals with the general senory capacity of these animals. The authors found a diminished performance by RCS rats on tactile tests and considered this decreased sensitivity quite unexpected”. In the light of the literature on the impact of visual loss both in animals and humans, it might be expected that dystrophic RCS rats would be more rather than less sensitive to tactile signals (Hetherington et al., 2000).
This was actually the justification of our hypothesis that the behavioural demand (i. e. blindness) induced probably constant activation of the sensory system which, in turn would improve further functional outcome after incomplete SCI in rats. Now we agree with the suggestion of Hetherington et al. (2000), that “it is conceivable that the RCS defect besides affecting cells that are essential for photoreceptor function (retinal pigment epithelium) may also involve other cells, such as those encapsulating somatosensory nerve endings producing an analogous result in the cutaneous receptor system to that seen in the retina—namely, the function and integrity of a primary sensory neuron being compromised by a malfunctioning supporting cell.”
At first sight, these findings can be interpreted as a contradiction to our earleir work on the facial nerve regeneration, where we found that the whiskerpad muscles of the blind SD/RCS rats recover function much better than that of the sighted SD animals (Guntinas-Lichius et al., 2005; Tomov et al., 2002). It is well known, that, in rodents, the mystacial vibrissae play an important sensing role in the survival of the individual. In rats, they are involved in many types of behaviour including surface discrimination, maze running, and depth perception (Barneoud et al., 1991). Neuroanatomical studies have shown, that the mystacial vibrissae together with their large CNS-representation area (barrel cortex) constitute a major part of the tactile apparatus of rodents (Rice et al., 1985). This is why, we attributed the complete recovery of whisker movement in the blind rats to an extraordinary plasticity of the facial motoneurons induced by putative sensitivity-associated behavioural demand and forced over-use.
A more careful reading of the report of Hetherington et al. (2000) reveals that here is no contradiction: the reduced sensitivity in the blind SD/RCS rats did not cause deficits in the whisking after vibrissal displacement (Hetherington et al., 2000).
Rats of the SD/RCS strain recover better after SCI
There is sound evidence that, after contusive CSI, noxious input enhances the development of chronic pain and impairs the recovery of locomotor function (Garraway et al., 2014; Grau et al., 2014; Grau et al., 2017; Turtle et al., 2017; Washburn et al., 2004). Since the proptopathic sensitivity of SD/RCS rats is constitutively reduced and they recover well after SCI, we may assume that both aspects are associated.
An indirect confirmation for this we find in the reduced inflammatory reaction (especially microglial proliferation) in the lumbar enlargement (below the lesion) of the SD/RCS rats. Increased glial reactivity is considered to be a major cause of central hyperexcitability (Redondo-Castro et al., 2013. Earlier work with Spearman’s correlations has revealed a significant inverse relationship between Iba1 expression and recovery of open-field BBB locomotor performance: rats with strong microglia/macropha reaction exhibited poor recovery, whereas rats with weak microglia/macrophage reaction showed better locomotor recovery (Choi et al., 2012; Gaudet & Popovich, 2014; Kigerl, et al., 2009). Furthermore, using metabolomic profiling, it has been shown that sensitivity is modulated by proinflammatory signaling in the chronic phase of injury (Dulin et al., 2013; Yasui et al., 2014).
Thus, the comparison of quantified parameters reflecting several aspects of structural and functional recovery from spinal compression injury between blind SD/RCS and sighted SD rats showed that, in general, the blind animals seem to recover better. This improved recovery was accompanied by reduced expression of microglia in the lumbar enlargement and by reduced prothopathic sensitivity below the injury level. We associatedthe improved recovery with a probably reduced sensitivity/hyperalgesia in the SD/RCS rats which allowed them early in-cage activity (Caudle et al., 2011). This intensive exploration of their home cages after SCI may have reduced inflammation and improved recovery.
We may thus conclude that therapy against neuropathic pain may offer a promising approach for reducing SCI-induced chronic pain. This in turn is of crucial importance for functional recovery after SCI (Detloff et al., 2010).
Footnotes
Acknowledgments
The skillful technical support of Janina Ankerne, Natalie Wolfsdorff and Miriam Wechsler is highly appreciated. The authors are grateful to James W. Grau (Department of Psychology, Texas A & M University, College Station, TX 77843, USA) for his critical reading and useful suggestions.