
Abstract
Background:
The acute phase of stroke is accompanied by functional changes and interplay of both hemispheres. However, our understanding of how the time course of upper limb functional motor recovery is related to the progression of brain reorganization in the sensorimotor areas remains limited. This study aimed to assess the time course of hemodynamic patterns of cortical sensorimotor areas using functional near infrared spectroscopy (fNIRS) and motor recovery within three months after a stroke.
Method:
Eight right-handed first ischemic/hemorrhagic stroke patients (60±8 years, 3 women) with mild to severe hemiparesis were examined with repetitive fNIRS measurements and motor recovery tests (Fugl-Meyer score) during two months. Hemodynamic changes over the ipsilesional and contralesional sensorimotor areas were collected from a multi-channel fNIRS system during intermittent isometric muscle contractions at self-selected submaximal force levels for each arm. Lateralization index was computed to evaluate the changes in the interhemispheric balance between the cortical sensorimotor areas.
Results:
Lateralization index values during non-paretic arm movements showed no significant changes over time in patients and were comparable to those observed in eight healthy controls. Paretic-arm movements were associated early with a bilateral cortical activity before shifting to ipsilesional patterns (p < 0.01). Progressive lateralization observed over the two months (p < 0.05) evolved concomitantly with an increase in the Fugl-Meyer score (p < 0.001).
Conclusions:
Cortical reorganization monitoring using fNIRS during the first weeks after stroke may be applied for assessing progressive brain plasticity in addition to clinical measures of performance.
Introduction
Stroke is one of the most common neurological causes of disability in developed countries. Regarding the prognosis of the upper limb functional recovery, only 12% of stroke patients regain a complete full use of their arms after six months (Kwakkel & Kollen, 2013) and most of the motor recovery occurs within three months following a stroke (Jorgensen et al., 1995). Functional motor recovery has been attributed to plastic reorganization in the adult human brain (Calautti & Baron, 2003; Ward et al., 2003). Previous researches showed that cortical activation and motor recovery after stroke are close processes that depend, among many other factors, on both the time elapsed from the stroke, the initial severity of motor impairments and on stroke location and extent. However, neural mechanisms underlying functional and performance recovery, such as the time course of cortical reorganization, remain poorly understood during the acute phase of stroke (i.e., over a 3-month period) in clinical setting.
Evidence that recovery of motor function after unilateral damage is associated during the very early phase of stroke by the recruitment of homologous regions in the contralesional hemisphere has been shown with a variety of neuroimaging techniques, including positron emission tomography – PET– (Chollet et al., 1991), functional magnetic resonance imaging – fMRI– (Feydy et al., 2002; Cramer et al., 1997) and transcranial magnetic stimulation – TMS– (Bütefisch et al., 2003). In general terms, in well-recovered patients, these studies have shown a “focusing” of task-related brain activation patterns towards a progressive “normal” lateralized pattern of the primary sensorimotor cortex (SM1) (Feydy et al., 2002; Tombaru et al., 2004). This “focusing” scheme is thought to be associated with improvement of motor function (Chollet et al., 1991; Cramer et al., 1997).
The relative contribution of the hemispheres during a motor task is usually expressed for a region of interest by a lateralization index (LI), describing hemispheric dominance (i.e., left, right or bilateral) (Calautti & Baron, 2003). In healthy subjects, motor tasks activate essentially the contralateral SM1, giving positive LI values. In acute stroke, SM1 LI values for the paretic arm are lower and even negative, due to both decreased ipsilesional activity and increased contralesional activity (Favre et al., 2014). LI is considered as one potential marker of recovery in functional neuroimaging studies in stroke (Cramer et al., 1997). Over time, LI values become more positive (Tombari et al., 2004; Favre et al., 2014), indicating a shift toward the ipsilesional hemisphere (Michielsen et al., 2011; Marshall et al., 2000). Thus, functional neuroimaging-derived measures such as LI might be relevant to guide any therapeutic interventions, such as non-invasive brain stimulation protocols aiming to promote perilesional activity after stroke (Simonetta-Moreau, 2014). For example, a few scarce repeated fMRI measurements showed significant change of the LI values over time after two weeks of constraint-induced therapy (Dong et al., 2006). More estimations of recovery potential through repetitive LI assessment over time could likely being more informative. They are nowadays possible when considering suitable portable neuroimaging techniques.
Functional near-infrared spectroscopy (fNIRS) is an emerging non-invasive neuroimaging modality that provides continuous bedside sensitivity of the brain oxygenation state, and allows measurement in upright position without physical restraint (compared to fMRI) (Gramigna et al., 2017). The basic principles of fNIRS and fMRI are similar and based on the blood-oxygenation level-dependent responses, recording oxygenated (O2Hb) and deoxygenated (HHb) blood in the cerebral cortex (Obrig & Villringer, 2003). fNIRS has been used to study brain function in healthy adults (Derosière et al., 2014) and stroke patients (Mihara & Miyai, 2016; Takeda et al., 2007) when exercising. To our knowledge, only one fNIRS longitudinal study (Takeda et al., 2007) has observed that functional motor recovery from mild to moderate hemiparesis in five patients was facilitated within one month by a transient recruitment of contralesional SM1 during audio-paced hand movements. Although preliminary in nature, this study shows the capability of fNIRS to monitor cerebral activity associated with motor tasks after stroke. However, the usefulness of fNIRS in the assessment of the inter-hemispheric activation balance with the degree of motor recovery needs to be further examined after stroke to answer the following question: can fNIRS in the early period after stroke detect hemispheric involvement patterns related to subsequent motor recovery?
Since the cortical reorganization changes has not been thoroughly investigated longitudinally during early period of stroke simultaneously with motor recovery changes, we made the most of the fNIRS in a task-related design and clinical setting in order to evaluate whether the inversion of the inter-hemispheric activation balance for SM1 can be assessed routinely in patients after stroke within three months, and whether this activation pattern is related to motor recovery. We hypothesized a progressive increase toward positive LI values for SM1 over time in stroke patients. We expected that LI changes during paretic arm movements would be positively associated with improvement in upper extremity motor recovery.
Methods
Participants
A total of ten hemiplegic patients (age 61±7 years, 4 women) were included at around three weeks after stroke (23.7±5.4 days) coinciding with the start of intensive motor rehabilitation. Though only eight were able to complete fully the experimental protocol. All participants were right-handed according to the Edinburgh handedness inventory (Oldfield, 1971). The locations of cerebral infarction for the patients were documented by magnetic resonance imaging (MRI, FLAIR images, 1.5 T scanner, Fig. 1). The characteristics of the lesion causing paresis were subcortical hemorrhage in three patients, subcortical infarction in six patients and cortical subcortical infarction for one patient with primary motor cortex (M1) infarction in the last 30 days. Five of them had left-sided hemiplegia. We excluded patients with severe cognitive impairment, severe aphasia with a Boston diagnostic aphasia examination score strictly less than two (Goodglass & Kaplan, 1972), severe hemineglect (Bell test < 8, Rousseaux et al., 2001) and limited passive range of motion for the paretic upper limb (shoulder abduction < 60°, limitation of elbow flexion > 30°, and dorsal wrist flexion < 20°). Demographic data and clinical history of the patients are summarized in Table 1. In addition, eight healthy controls (age 56±6 years, 5 men), with neither history of neurological nor orthopedic disease were recruited.
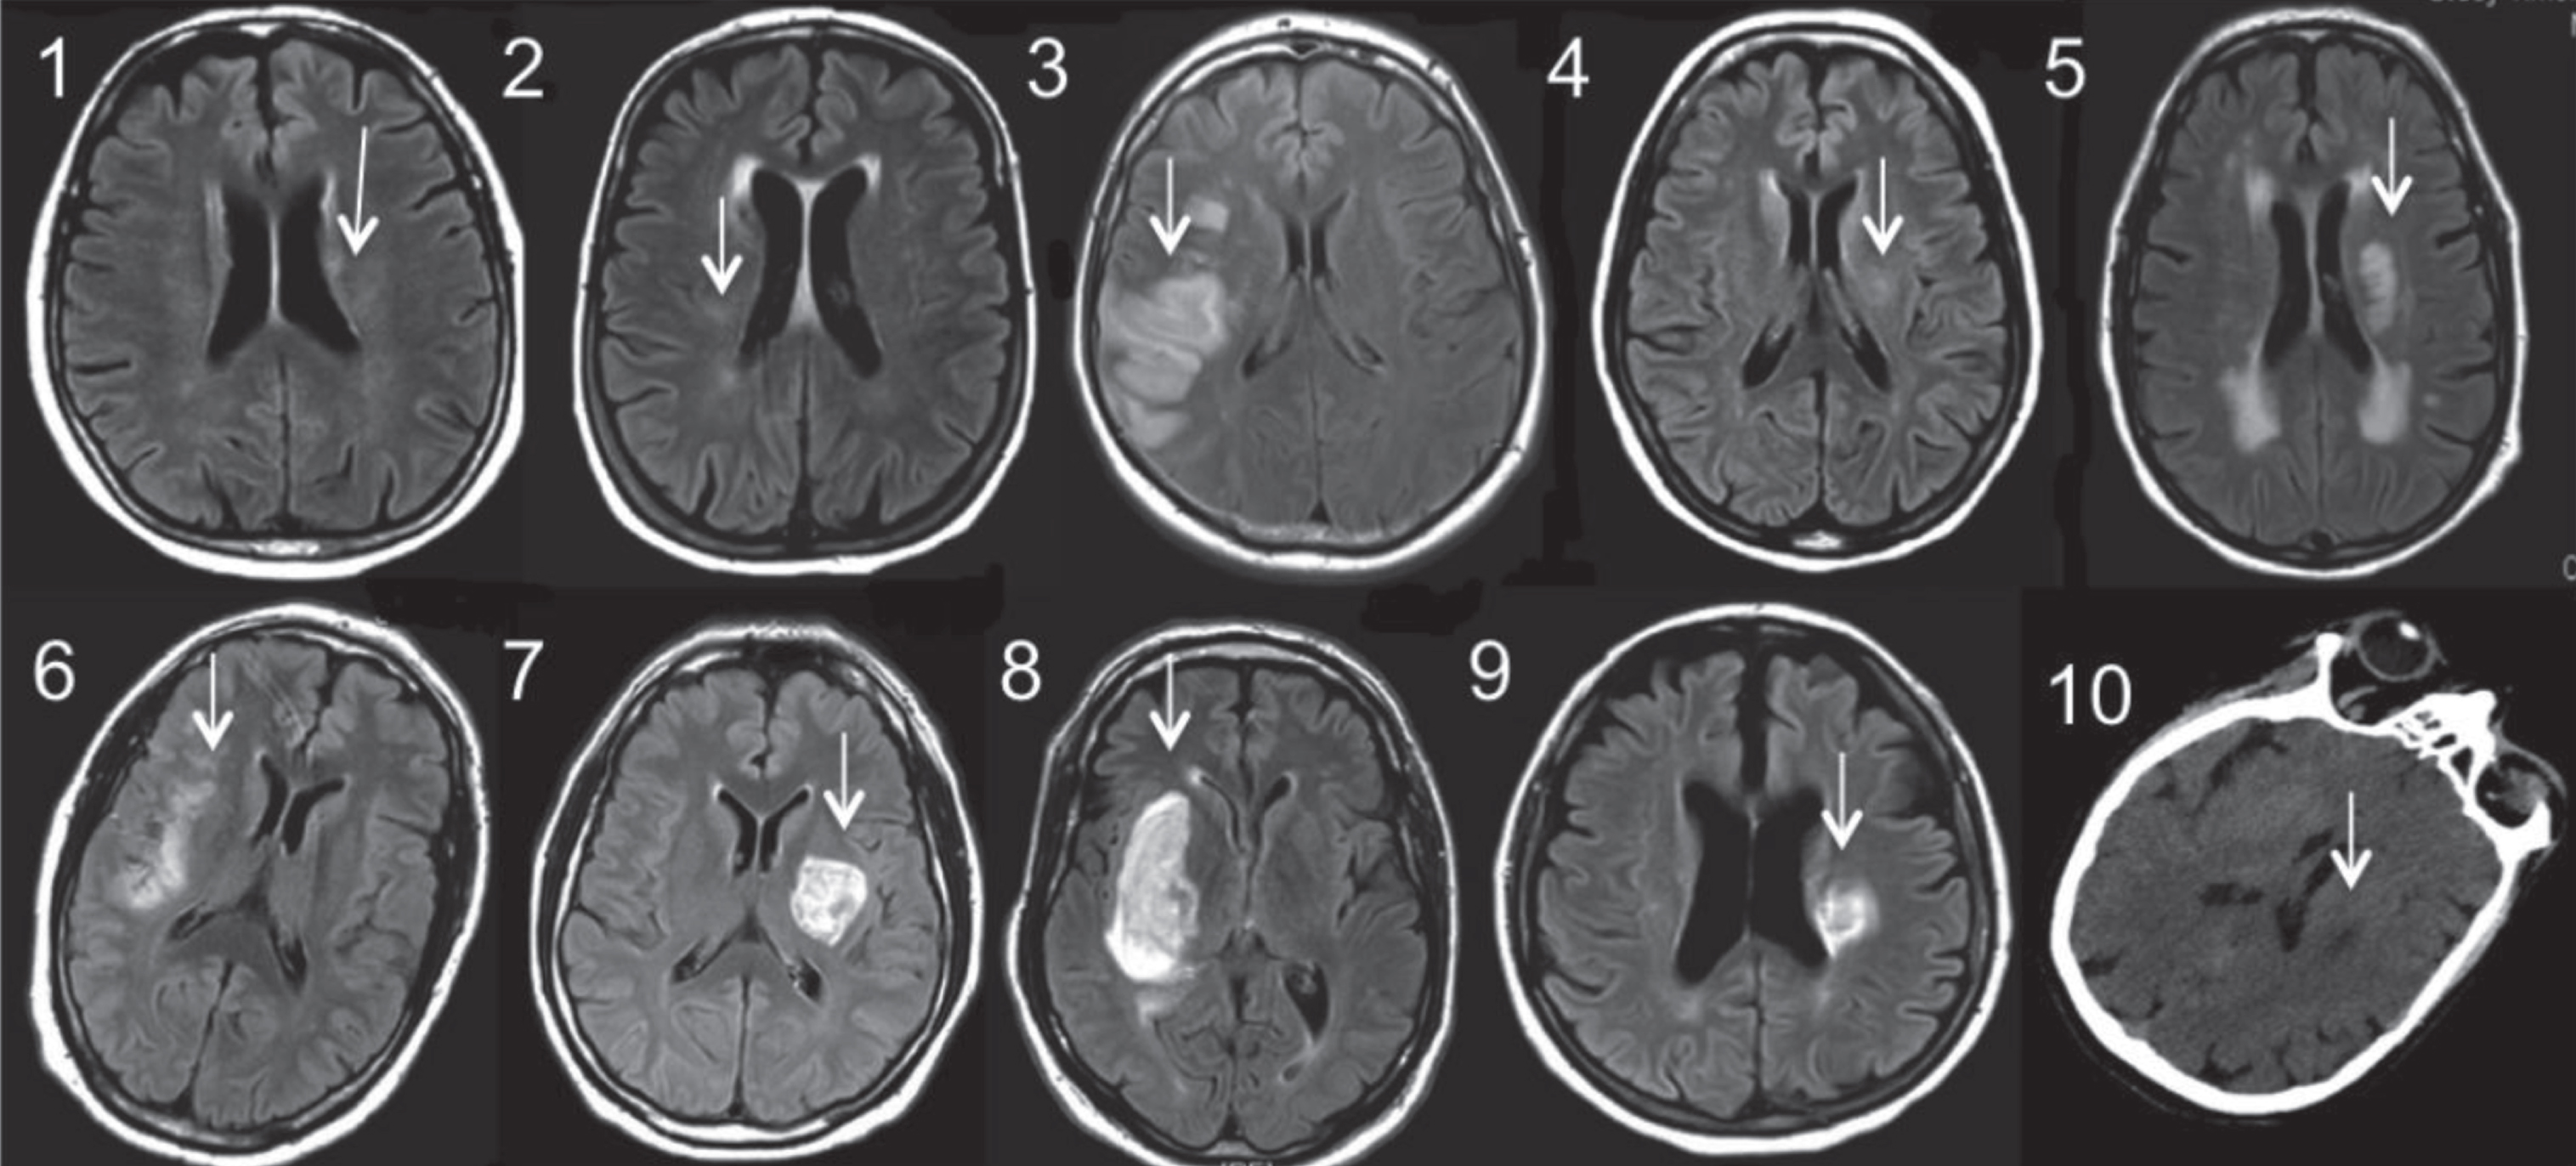
Brain imaging of the stroke patients. MRI FLAIR for patients 1 to 9 or computed tomography (patient 10) at the level of the main stroke injury as indicated by a white arrow.
Demographic information, clinical data, lesion information and clinical scores at inclusion
Abbreviations: M, male; F, female; R, right; L, left; MCA, middle cerebral artery; BI, Barthel index; FM, Upper Limb Fugl-Meyer (score/66); NIHSS, National Institutes of Health Stroke Scale (range 0 to 42, maximal deficit); Is, Ischemic; H, Hemorrhagic.
The study protocol was approved by the local Ethics Committee of Nîmes (number RCB: 2015-A01624-45). This clinical study is registered at ClinicalTrials.gov (number NCT02664636). It was conducted in accordance with the Declaration of Helsinki in the Department of Physical Medicine and Rehabilitation of Nîmes University Hospital at Le Grau du Roi, in France. All participants provided informed written consent prior to enrolling in the study.
Patients underwent a conventional rehabilitation program with occupational therapy and physical therapy regimen composed of ∼10 sessions per week for two months. Throughout this period, upper-limb movement-related brain activation patterns were collected every two weeks (Fig. 2) with fNIRS during a standardized motor task (see below); along with the upper limb motor recovery scale (Fugl-Meyer et al., 1975; FM). Movement-related brain activation was recorded once for both arms in the control group.

A. Locations of the 16 fNIRS channels placed on the scalp of the left (8 channels) and right (8 channels) hemispheres (left panel). Each fNIRS channel was located midway between the transmitter and receiver (black circle) probe. B. Picture of a patient carrying out the motor task (see text for further details). C. Experimental Design. Upper-limb movement-related brain activation patterns with fNIRS and the Fugl-Meyer score were monitored every two weeks (from days 0 to 60) over a two-month period. Barthel index (BI) and the National institutes of health Stroke scale (NIHSS) were performed before the two-month follow-up. D, day; NIRS, near-infrared spectroscopy.
The subscale of upper limb motor impairment of the FM test (score between 1 and 66) was used to quantify the initial deficit and monitor thereafter the recovery of voluntary movement of the paretic limb over the two months follow-up. The National institutes of health Stroke scale (NIHSS) was also used to measure baseline impairment in stroke patients for this clinical trial. The overall functional recovery was evaluated with the Barthel index (BI) including 10 items (score 100 corresponding to complete independence).
Participants were seated on a comfortable chair with their eyes opened. Their arms were placed in neutral position (elbow flexion 90° and forearm in pronation) on the armrests (Fig. 2). A non-extensible strap connected to force sensor was placed around both participants’ wrists in order to produce an isometric force via elbow flexion. Force sensors (S2M-500 N, HBM company, Germany; precision of 0.05 N) fixed on the floor directly below the wrist were linked to an acquisition board. The force signals were recorded at a sampling frequency of 300 Hz and synchronized with the NIRS equipment. Force signals were used as a trigger for movement onset in subsequent fNIRS analysis. The simultaneous continuously recording of the force signals on both sides allowed to control the absence or presence of bilateral movement during the unilateral motor tasks.
The participants were requested to avoid any movements other than those needed for the motor tasks. They were requested to rehearse the motor task before measurement to ensure that they comprehend the task instructions. After a 3 min resting period (baseline), the motor activation paradigm consisted of two blocks including each three trials of 20 s unilateral intermittent isometric muscle contraction of the forearm at 1 Hz. An auditory digital metronome with a beat frequency of 1 Hz was used to time the motor task. Each trial was followed by a 30 s rest period to allow for the activation to return to a baseline level. The first block was performed with the non-paretic arm while the second one was realized with the paretic arm. The participants could have at least a 1 min rest between the two blocks. A comfortable submaximal force was self-selected by each patient during each trial to avoid potential fatigability over time. Based on pilot tests, submaximal force achieved was expected around 20% of maximal voluntary contraction (MVC). Prior to the start of each experimental session, the elbow flexion MVC force was determined for each arm with the best performance in 2 trials of 3-4 s with a resting period of 60 s between each trial. The same motor task design was performed for the control group with the dominant hand first, then with the non-dominant hand.
Functional near-infrared spectroscopy
A continuous-wave fNIRS system (Oxymon MkIII, Artinis Medical Systems, The Netherlands) using two wavelengths was used to measure the concentration changes of O2Hb and HHb at a sampling frequency of 10 Hz during the motor task. A 16-channel layout (8 channels on both hemispheres) was setup with four and ten optical fiber bundle receivers and transmitters, respectively, mounted on a customized head cap covering the two SM1s with a 3 cm transmitter-receiver distance (Fig. 2). A 3D-digitizer (Fastrak, Polhemus, United States) was used to record the exact locations of each fNIRS probes before converting these coordinates into locations of the sixteen channels in an estimated Montreal Neurological Institute (MNI) space (MATLAB toolbox NFRI_function, Singh et al., 2005). The positioning of the 16 channels on a reconstructed 3D brain (NIRS-SPM v.4 toolbox, Ye et al., 2009) can be seen in Fig. 2. Based on the mean MNI coordinates and Brodmann area (BA) correspondences, SM1 was defined both for the left and the right hemispheres (Fig. 2).
Data analyses
Force data were low-pass filtered using a Butterworth zero-phase digital filter (10 Hz). Then, a homemade MATLAB script (MATLAB 2014b, The MathWorks, USA) was used for peak force (N) detection for each upper-limb movement. Peak force values were averaged for the three trials of each block during each measurement session. The MVC of each trial was defined as the mean of the force plateau over duration of 2 s.
All fNIRS data analysis was undertaken using Oxysoft V3.0.103 (Artinis Medical Systems, The Netherlands). First, motion artifacts on NIRS signals were detected manually by considering sudden and abrupt signal change of O2Hb and HHb traces, and the corresponding time series were removed accordingly. Second, a low pass filter with a cut-off frequency of 0.08 Hz was applied to the time series of O2Hb and HHb signals to remove physiological noises like cardiac, respiratory and Mayer-waves systemic oscillations (Scholkmann et al., 2014). Motor task initiation was extracted by taking into account the corresponding force signal changes that were synchronized with the fNIRS data. Then the fNIRS time series were corrected to a zero baseline value at the onset of each motor task, which provided a reference value for the corresponding segment and allowed for standardized comparisons across each trial within a session and in between sessions. Then, for each trial, time interval 5–20 s after motor task onset was used to investigate the cortical activation response due to the 2–5 second latency of hemodynamic response. The O2Hb variable was used as a marker for the regional cerebral blood oxygenation changes during brain activation as research and own pilot tests have shown its higher sensitivity (Strangman et al., 2002) to motor task-related signal changes (Perrey, 2008; Leff et al., 2011). For each participant and trial, the peak amplitude values of the O2Hb response (Leff et al., 2011) were extracted by considering only the channels within the SM1 region from MNI coordinates and averaged for both hemispheres. Finally, in order to examine changes in the inter-hemispheric imbalance during movement of the arm, we calculated LI (Derosière et al., 2014) for each trial, which expresses whether SM1 activation based on O2Hb during movement is mainly contralateral or ipsilateral.
LI = (contralateral - ipsilateral) / (contralateral + ipsilateral) where LI varies from –1 to 1, with 1 indicating purely contraleral and –1 indicating purely ipsilateral activation.
It is important to note that for the paretic arm, LI expresses whether SM1 activation during movement is mainly ipsilesional or contralesional (Cramer et al., 1997). In this instance LI varies from –1 to 1, with 1 indicating purely ipsilesional and –1 indicating purely contralesional activation.
Statistical analysis
Statistical analyses were performed using Statistica (version 13.1, Statsoft Inc., USA). Nonparametric tests were used insofar as the values were not normally distributed after using Shapiro-Wilks test. Changes in the dependent variables (LI and FM scores) over time (5 sessions during the two-month follow-up: days 0, 15, 30, 45 and 60) were compared using a Friedman test for repeated measures design. Significant main effects were followed-up using Wilcoxon test for post hoc multiple comparisons. Comparison with controls was carried out with a Wilcoxon test. Spearman rank correlation analysis was used to assess the relationship between LI and FM changes over all possible consecutive sessions of measurements. All values are reported mean (SD) unless specified otherwise. Additional relevant information is indicated in the figures’ legends. Statistical significance was set at p < .05.
Results
According to the motor impairment classification in clinical and research settings (Gladstone et al., 2002), initial deficit for the upper limb was severe for five patients, moderate for three patients and mild for two patients (Table 1). Two stroke patients (P4 and P7) were excluded from the analysis due to the intercurrent medical problems that prevented them to perform the requested motor task over the two-month follow-up period. Consequently, dependent variables for statistical analysis throughout the two-month follow-up were derived from eight stroke patients. Most of the trials from all sessions were retained except for a few patients regarding NIRS data. Particularly for this study, we wanted to distinguish between desired movements (e.g., unilateral muscle contraction of elbow flexors) and undesired movements of the leg, trunk, and/or head. Some participants often moved their heads by looking in different directions, which was most likely related to the artifacts we saw in our fNIRS data. Unrelated to the task, some participant moved their heads energetically, which introduced the largest artifacts to the data. Thus, during our study, keeping participants engaged by funneling their attention to the tasks was a crucial step to minimize the number of movement-related artifacts, while collecting the necessary measures.
Motor recovery follow-up
Five stroke patients had a complete follow-up with five measurement sessions, two other patients had four sessions of measure and only one had three sessions due to medical non-neurological reasons. Fugl-Meyer score significantly changed through the five measurement sessions (χ2 = 18.40, p = .001, Fig. 3). Post hoc test indicated a progressive significant increase over consecutive measurements (note that p = .06 between day 15 and day 30) before to level off (p = .17 between day 45 and day 60, that is nine weeks after stroke onset).

Changes in the functional motor recovery (Fugl Meyer, FM) score over the two months follow-up. Box-plots are represented as min, max and median values; on the left side, individual values are plotted. D: days. * Significance level at p < .05.
For the eight stroke patients, mean peak force values for the non-paretic (16.9±5.1 N) and paretic (7.9±3.9 N) arms did not significantly change over all measurement sessions (p > .05 and p = .08, respectively). Importantly, mean relative force (% MVC) were not significantly different across the five sessions for the non-paretic (20.6±2.3%) and paretic (22.5±5.0%) arms (p > .05). For the controls, peak force values were not significantly different between the right (22.8±13 N) and the left (23.9±16 N) arms.
In stroke patients, positive LI values for the non-paretic upper limb movement did not show significant changes among the measurement sessions (Fig. 4). No significant differences were found when comparing these LI values with those in controls for the left and right arms. Concerning the LI values for the paretic upper limb, significant differences were observed among the five measurement sessions (χ2 = 14.200, p < .01). Post hoc Wilcoxon tests indicated significant and progressive increase of LI from days 0 to 45 before to level off (p = .13) between days 45 and 60 at the end of the two-month follow up (Fig. 4).
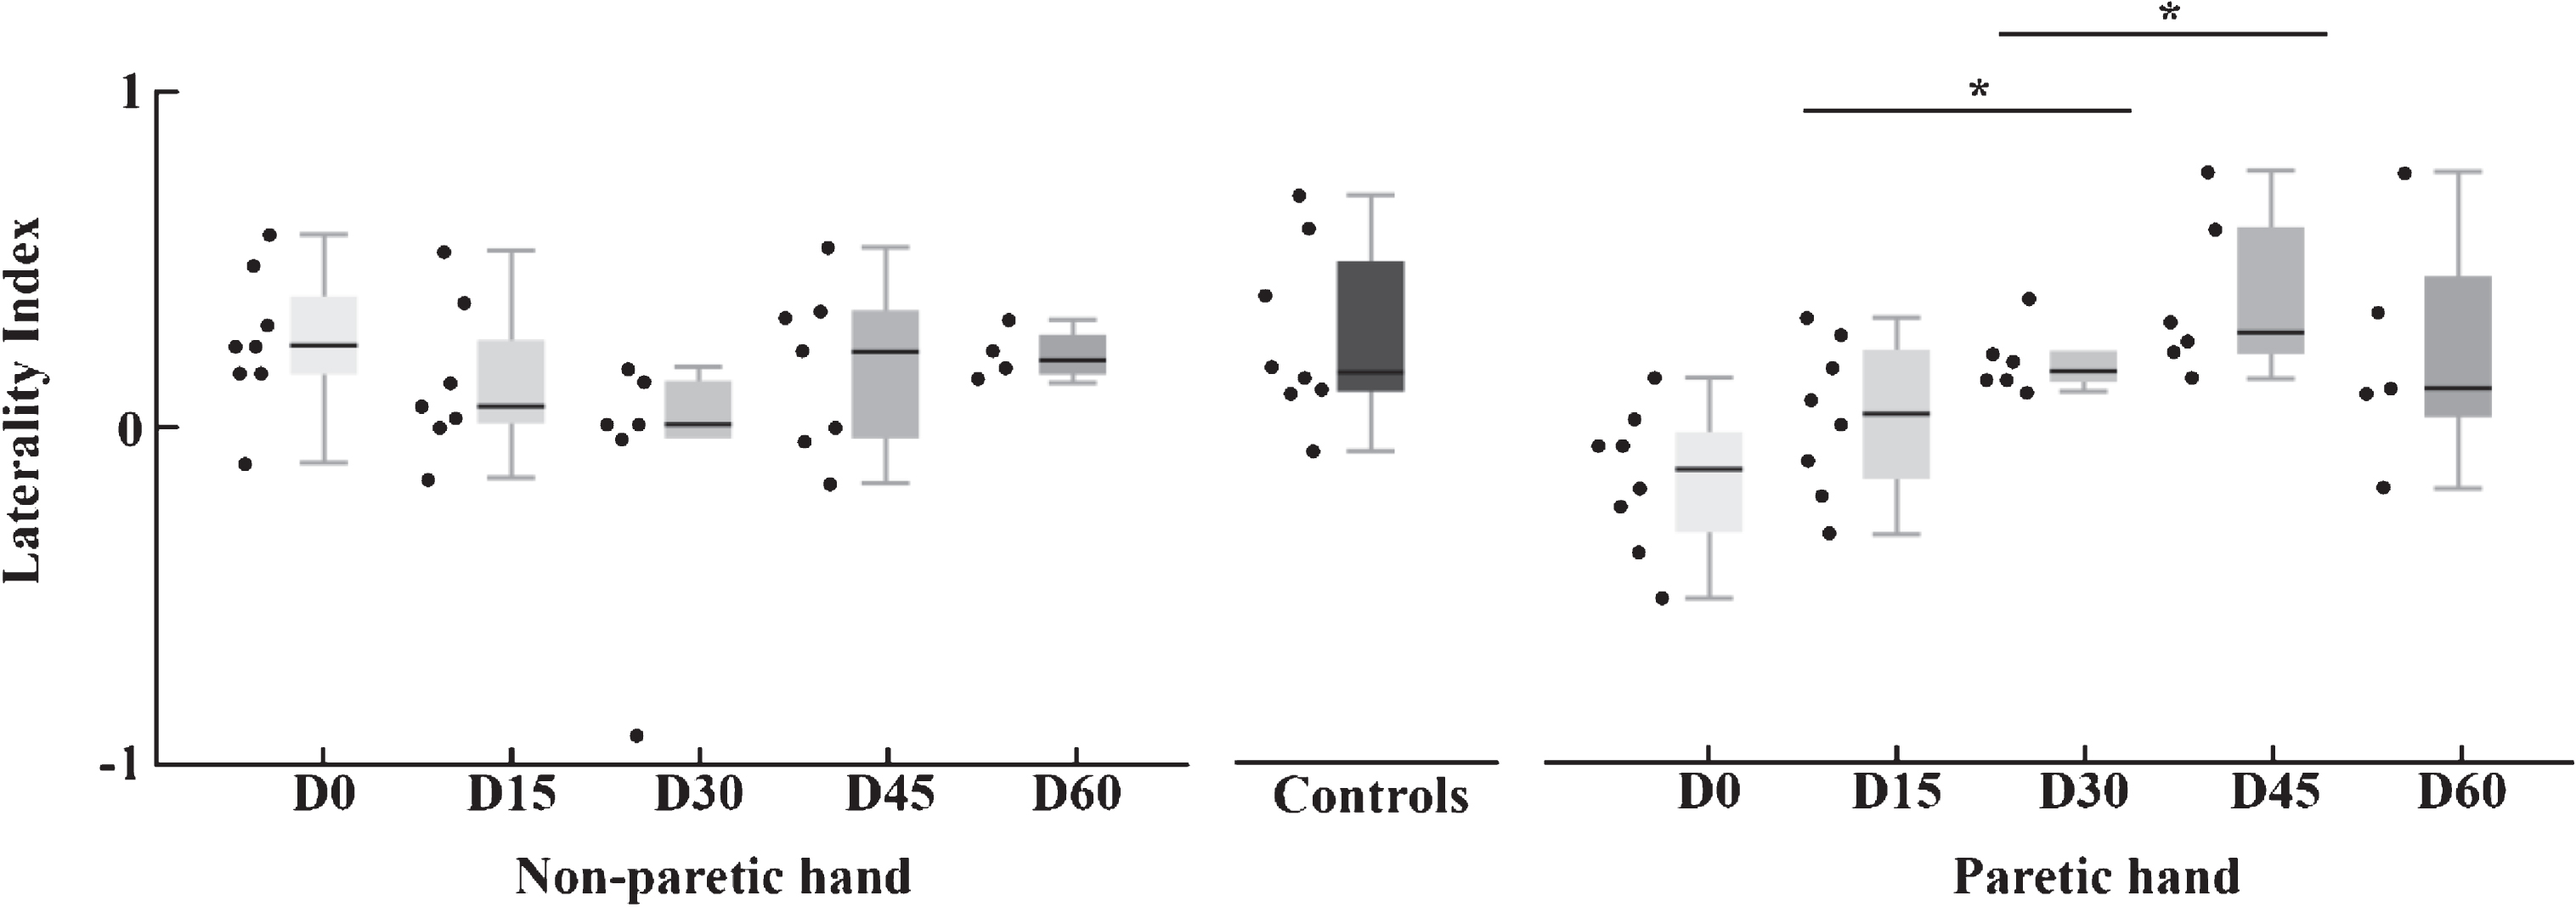
Changes in the lateralization index (LI) for the sensorimotor cortical regions during movement produced by non-paretic (left) and paretic (right) arms over the two months follow-up. Box-plots are represented as min, max and median values; on the left side, individual values are plotted. Values for controls (dominant arm) are presented. D: days. * Significance level at p < .05.
For the eight controls during the single session realized, no significant differences in LI values were observed between the right (0.27±0.23) and left (0.27±0.26) upper-limb movements with task-related increase in O2Hb predominantly in the contralateral SM1.
Finally, a significant positive correlation was found for the paretic arm of the stroke patients between the respective changes in FM scores and LI values over all possible consecutive sessions of measurements (ρ= .58, p = .001, Fig. 5).
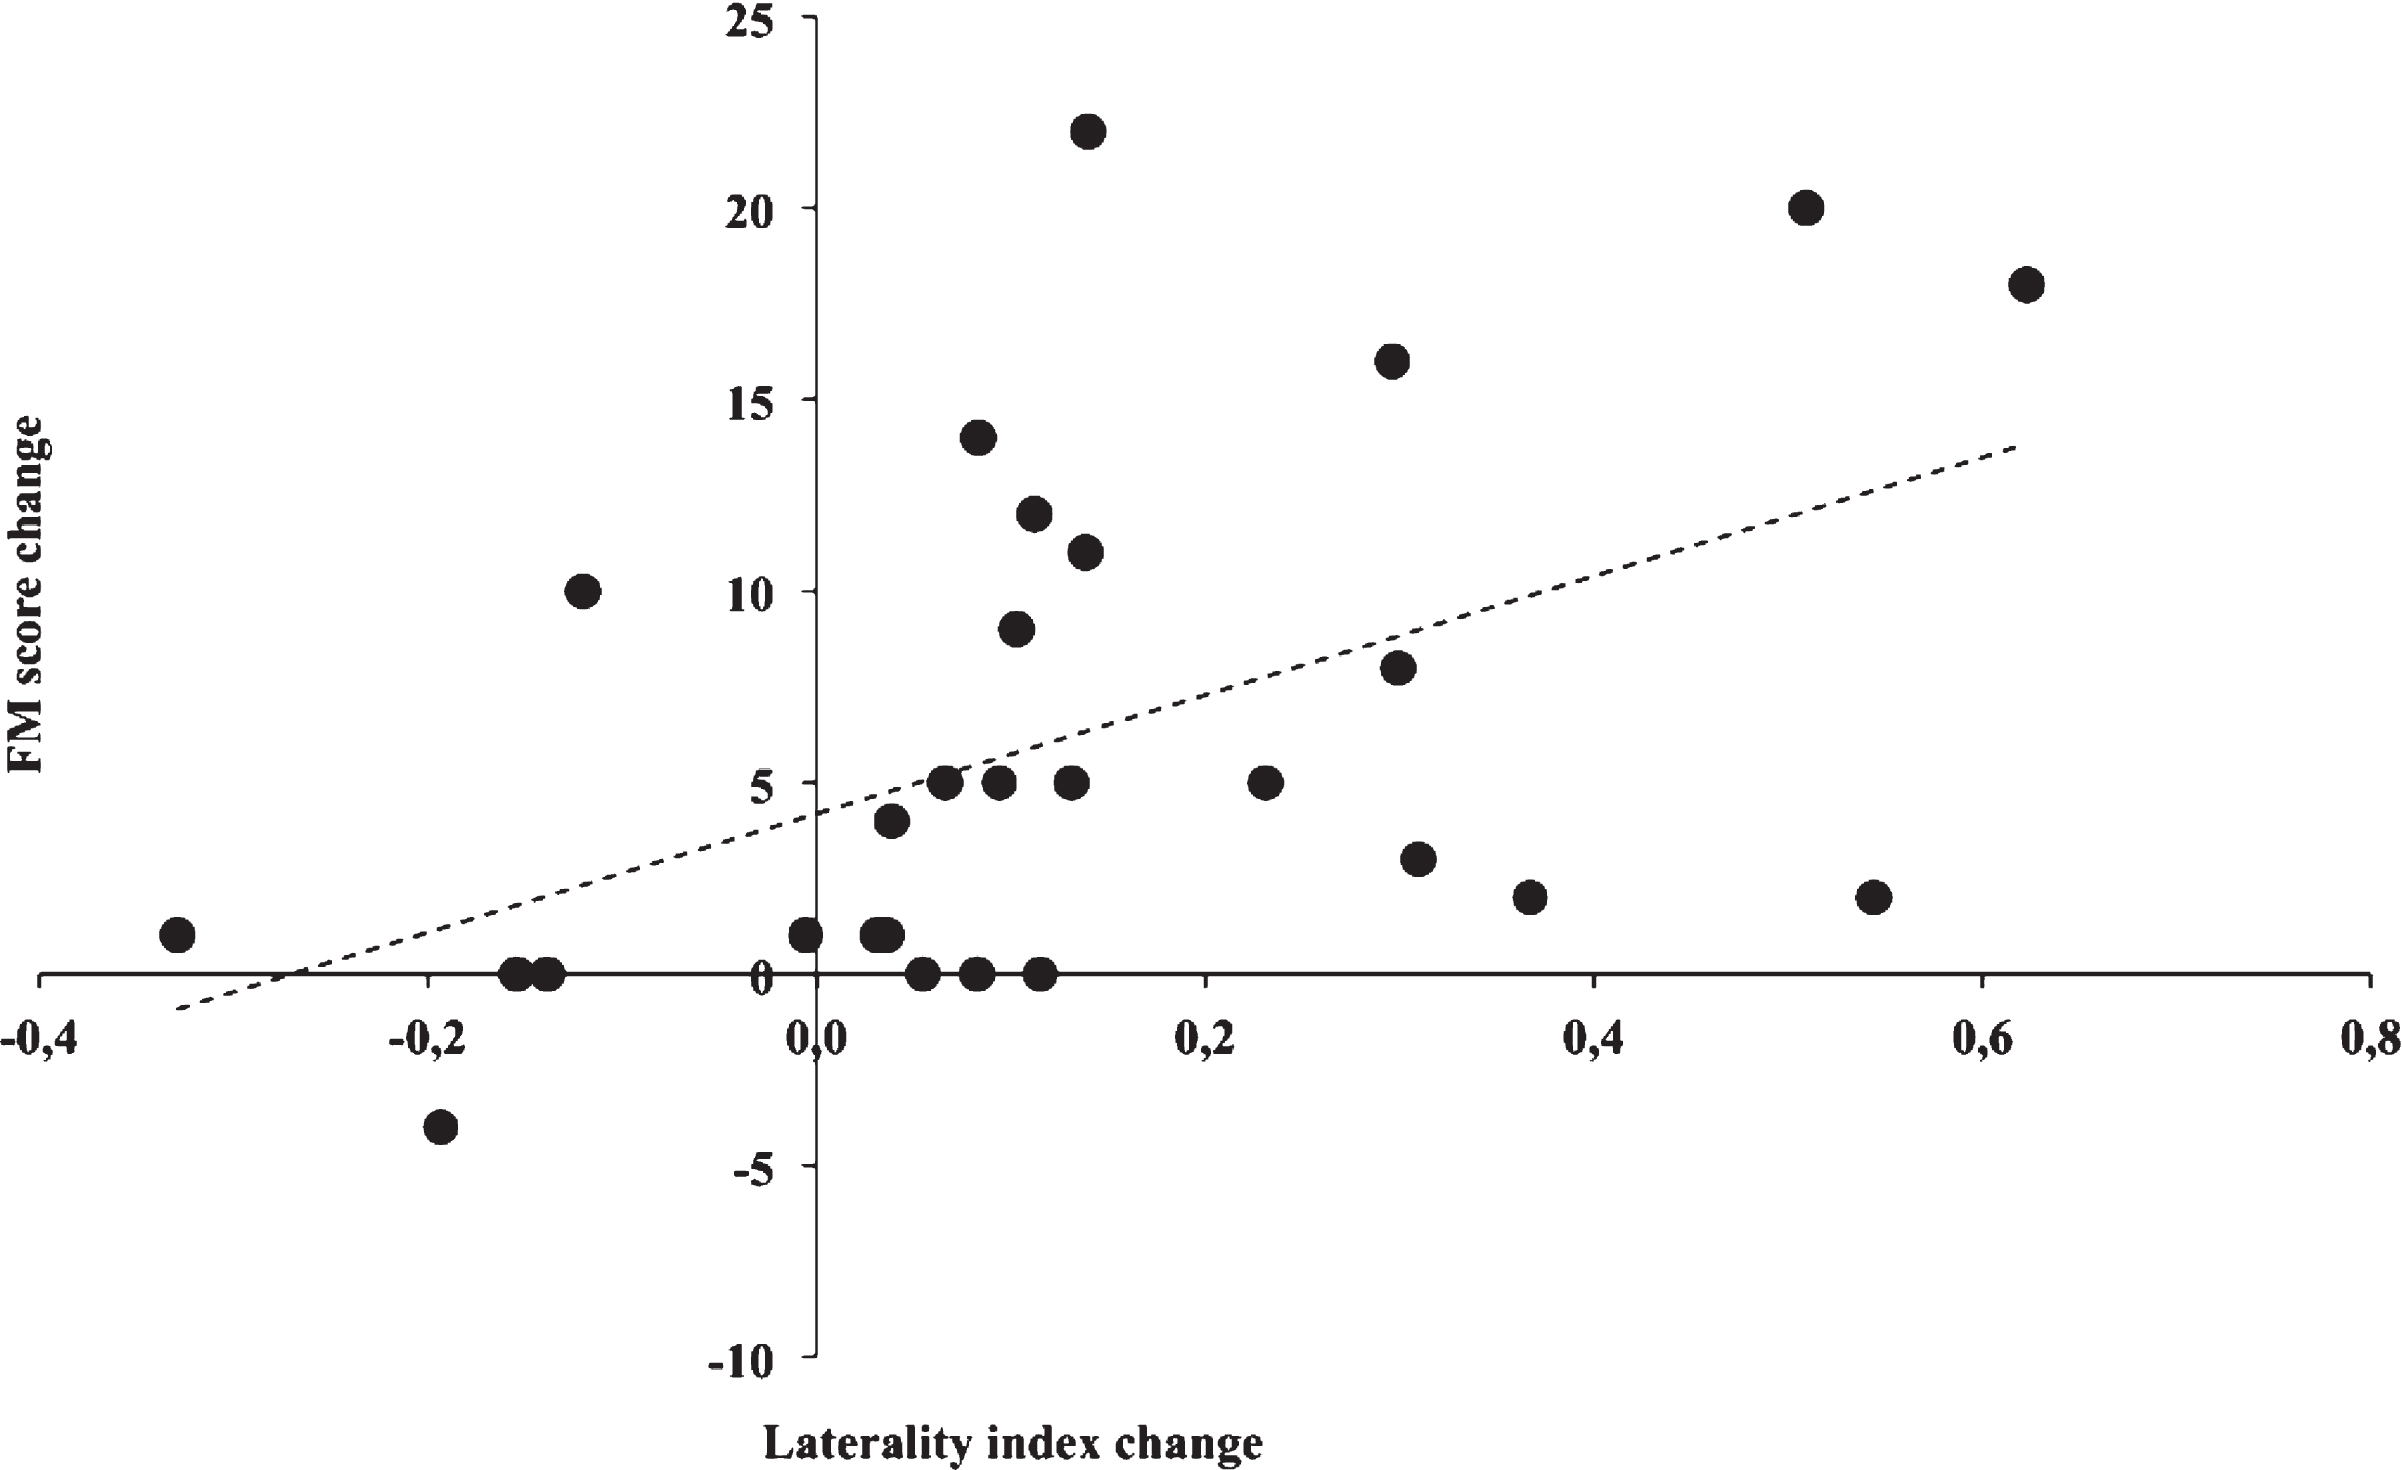
Correlation (ρ= .58, p = .001) for the paretic arm between changes in the laterality index as assessed by fNIRS during upper extremity task and motor recovery test (Fugl-Meyer -FM- score) for all patients during the two-month follow up. A point (black circle) represents a change for a single patient over two consecutive sessions of measurement.
The present study applied repetitive fNIRS measurements to assess the temporal evolution of cortical activation balance between the two hemispheres for SM1 associated with unilateral movement for both arms during the early phase of stroke recovery (< 3 months). Overall, this study showed that cortical activation pattern related to paretic-arm movement corresponded to a progressive shift from the contralesional hemisphere to the ipsilesional hemisphere in correlation with better functional motor recovery over time. Interhemispheric balance for SM1, as revealed by LI values, returned progressively to healthy control levels.
The present study was designed to provide unilateral upper limb motor task in a sitting position combined with multiple fNIRS and FM measurements in a clinical setting. The use of intermittent isometric muscle contractions for each arm via elbow flexion was based on first pilot tests in chronic patients. It was selected for its simplicity, feasibility, ease of understanding and safety in clinical application. In the current study, simultaneous measurement of force related to each movement provided information on both the motor outcome and the absence of associated movements for the non-paretic arm during paretic arm movement, even if the realization of electromyographics recordings could have been performed to control hand activation. Moreover, the motor task paradigm was setup to prevent any possible increased ipsilateral SM1 activation when the force is above 30% MVC during a unilateral task (Derosiere et al., 2014). In most longitudinal post-stroke functional imaging studies, the authors used either a finger-tapping task (Chollet et al., 1991; Cramer et al., 1997) or repeated flexion-extension of a segment of the upper limb (Feydy et al., 2002) or hand grasping (Takeda et al., 2007; Rehme et al., 2011; Grefkes et al., 2008). We focused on the elbow flexion movement because the patients were able to flex the elbow initially and functional elbow flexion recovery occurs in most patients at the early stage of stroke. It should be noticed that most studies did not use fNIRS to quantify changes in cortical activity lateralization, but fMRI or PET methods in non-ecological settings. Here, fNIRS-derived LI provided a physiological indicator of the integrity or alteration of activation for both SM1s to a motor stimulation in stroke patients.
Although this study has a number of limitations (sample size, a few missing data in 3 patients), it shows further light on the concomitant changes between global brain lateralization and behavioral deficit for the upper extremity. One important result of this work is that a significant increase of LI during the paretic arm movement was observed over time (Fig. 4), with a reduction of controlesioned hemisphere activation within the three-month post stroke onset. The present study shows further that at the end of the two-month follow-up, LI values during movements of paretic arm matched those of the non-paretic arm and became similar to controls. For non-paretic arm movements, activation pattern from LI was unaltered as previously described in the seminal fNIRS study of Takeda et al. (2007). In this longitudinal study fNIRS was used to examine twice (early and at least one month later) five ischemic stroke patients with mild to moderate hemiparesis. Paretic hand movements activated bilateral SM1s early after stroke (< 25 days of stroke onset), whereas the activation pattern returned toward normal at later periods (> 35 days). The present study extends these earlier findings of fNIRS sensitivity for monitoring an altered functional organization in the sensorimotor system after stroke. We suggest that the post-stroke brain is able of returning to state of healthy brain’s organization in the course of early recovery.
First, for paretic arm movements, activation pattern in the contralesional SM1 was mainly observed within three weeks of stroke onset. Such pattern is in line with the results of a number of earlier studies using PET and fMRI in stroke patients (Ward et al., 2003; Chollet et al., 1991; Feydy et al., 2002; Calautti et al., 2001; Weiller et al., 1992), suggesting the good potential of fNIRS for evaluating cortical patterns in stroke patients even though the spatial resolution of fNIRS is less than that of fMRI (see Perrey, 2008). Most of cross-sectional studies in stroke patients at chronic stages have shown that the ipsilesional dominant activation pattern is seen in patients with good or complete motor functional recovery but not in poorly recovered patients (Ward et al., 2003; Chollet et al., 1991; Cramer et al., 1997; Weiller et al., 1992; Cao et al., 1998; Serrien & Sovjärvi-Spapé, 2015). Activation of the contralesional hemisphere at the early phase post stroke related to paretic arm movement could ensue from different physiopathological explanations. One hypothesis is a disinhibition phenomenon with loss of inhibition from the lesioned hemisphere on the healthy hemisphere due to the lesion (Grefkes et al., 2008; Calautti et al., 2003). An alternative hypothesis is a phenomenon of recruitment of these contralesioned sensorimotor areas to face the lack of activation of the lesioned hemisphere (Rehme et al., 2011; Calautti et al., 2003). Motor impairment after stroke has been related to the structural and functional integrity of descending corticospinal or pyramidal tracts (Lotze et al., 2012; Stinear et al., 2007). This suggests that corticospinal tract and primary motor cortex integrity could influence the SM1 activation pattern observed. This deserves further investigation with a multimodal approach based on TMS, fMRI and fNIRS techniques that can in turn assist with prediction of the patient’s motor recovery (Stinear et al., 2007).
Second, based on regular and multiple measurement sessions of both SM1s activation, progressive increase in ipsilesional activation leveled off for paretic arm movements after the first nine weeks following stroke onset. In addition, restoration of the inter-hemispheric balance of SM1 activation was significantly correlated with concomitant changes in FM score between two consecutive sessions (Fig. 5). This result confirms our initial hypothesis and is in agreement with a few longitudinal studies using PET and fMRI (Tombari et al., 2004; Calautti et al., 2001; Manganotti et al., 2012; Wiest et al., 2014). In patients with successful recovery of dexterous hand function, cerebral blood flow using arterial spin labeling MRI decreased over time in the contralesional motor areas and interhemispheric balance returned to healthy control levels (Wiest et al., 2014). In contrast, patients with poor recovery presented with sustained hypoperfusion in SM1s encompassing the ischemic tissue and cerebral blood flow remained lateralized to the contralesional hemisphere. In the longitudinal study of Feydy et al. (2002), three fMRI sessions were performed over a period of one to six months after stroke. “Focusing” pattern was identified in nine patients while five patients showed a persistent recruitment with an initial and sustained recruitment of ipsilesional activity. Authors suggested that this persistent pattern is likely to be a compensatory cortico-cortical process related to the lesion of the contralateral M1 and that the process of compensatory recruitment will persist if M1 is lesioned (Feydy et al., 2002). In our study, homogeneous lesion localization in most of our patients (seven with a subcortical stroke, Fig. 1) was probably in favor for a unique pattern of cortical evolution by a normalization of ipsilesional SM1 activation within three months post stroke. Although the fNIRS may detect asymmetry changes in hemodynamics for superficial (cortical) layers between hemispheres in Stroke patients, measurements over different territories of the head, especially for some patients with subcortical infarction recruited in the study, were not possible to assess due to the penetration depth of near-infrared light into the tissue. This is another limitation of the present study. Further investigation will be required in order to detect the origin of the blood flow captured by fNIRS, notably by correlating perfusion maps from computed tomography or magnetic resonance imaging to the fNIRS signals.
Although fNIRS brain imaging of stroke rehabilitation is still modest in the literature and has some main drawbacks (modest spatial resolution and limited depth penetration), the low-cost and transportable NIRS instruments with good temporal resolution can yield a coherent picture of cortical changes underlying rehabilitative changes without restrictions in terms of scan time, achievable task, and/or patient characteristics as compared to fMRI. By establishing that increased SM1 activity levels are associated with improvement of functional capabilities, the fNIRS-based technique might eventually be used in conjunction with traditional therapist-based rehabilitation to help guide therapy and gauge efficacy. For instance, in patients with persistent bilateral activation of the motor cortex during unilateral movements, fNIRS signals could be exploited to quantify the lateralization of brain activity under a specific treatment protocol using non-invasive brain stimulation techniques (i.e, repetitive transcranial magnetic stimulation in Grefkes et al., 2010; transcranial direct current stimulation in Muthalib et al., 2018). With regard to the results of the present study, the regular monitoring of LI evolution can be used as a marker of the underlying neuronal plasticity in conjunction with other clinical scores and functional motor tests. Thus, repeated monitoring of hemodynamic changes signaling normalization of the functional organization of the motor cortices could serve as an alarm to prompt clinical re-evaluation and maybe modify the undergoing rehabilitation protocol. Yet, a better and more detailed understanding of neural plasticity in lesioned cortical networks requires likely a multimodal approach based on fMRI techniques providing spatially refined and multidimensional data (Scarapicchia et al., 2017). Besides, fNIRS in combination with electroencephalography may allow the testing of the integrity of neurovascular coupling in patients with cerebrovascular pathology (Dutta et al., 2015).
Conclusion
In conclusion, assessment of lateralisation index for evaluating interhemispheric balance of regional activation as assessed by fNIRS during the course of motor recovery in stroke patients is promising. Our preliminary results show a progressive increase of LI toward positive values in stroke patients accompanying changes of the FM score. Observation of significant hemodynamic changes mostly at 2-month post stroke onset could attest of an initial premature cerebral reorganization phase (Jorgensen et al., 1995; Takeda et al., 2007; Fujii & Nakada, 2003) followed by a later phase of stabilization. Monitoring LI with a low cost and mineable mobile functional imaging method might provide additional possibility to quantify brain reorganization in an objective but gross way into routine clinical rehabilitation application and in a wider range of motor tasks. Identifying individual pattern of cortical activation balance might also serve as a target for rehabilitation intervention, as the use of non-invasive brain stimulation.
Footnotes
Acknowledgments
We thank the stroke patients who took part in this study, and we thank S. El Sherif and P Armaingaud for helping out with screening and recruiting patients. We also thank V. Cabibel and S. Pla for their help with the equipment and A. Louzir Vergotte for her careful proofreading of the manuscript. The authors disclosed receipt of the following financial support for the research, authorship, and/or publication of this article: Support for this study was provided by the Regional Hospital of Nimes (AOI ERASM LOCAL/2015/JF-02). M. Delorme was supported by a local university grant during the conduct of the study and G. Vergotte was supported by the Gradute School (ED 463) in Human Movement Sciences.