
Abstract
Background:
Color vision has been consistently shown to be unaffected in animals that are raised in dark or in color-deprived environments. However, there are only a few studies that directly addressed the effect of congenital visual deprivation in color perception in humans.
Objective:
The goal of the current study was to assess the effect of congenital visual deprivation on color vision using a panel based color arrangement test.
Methods:
We investigated the recovery of color vision using the Farnsworth D15 test in a group of individuals who had experienced visual deprivation since birth due to bilateral dense congenital cataracts before undergoing cataract-reversal surgery (Congenital cataract, CC, n = 12). In addition, we tested two groups of control participants: (1) individuals who had had non-dense congenital cataract or developed cataract later in their childhood (Developmental cataract, DC, n = 10), and (2) sighted controls with normal or corrected to normal vision (n = 14). Based on the methods proposed by Vingrys and King-Smith (1988), we derived the following metrics of color vision performance: (1) total error score, (2) confusion index, (3) confusion angle, and (4) selectivity index.
Results:
All of the measured indices of color vision performance were unaltered by a period of congenital visual deprivation.
Conclusions:
Our results support the view that, development of visual functions such as color discrimination and color arrangement does not depend on typical visual experience during a sensitive phase in early childhood.
Introduction
Visual input during the early periods after birth has been found to be crucial for the development of various visual and multisensory functions. Even a transient period of absence of vision was shown to cause some irreversible visual damage. For example, individuals who did not experience any patterned visual input for a period of time after birth due to the presence of bilateral dense congenital cataracts were shown to have deficits in visual acuity (Ellemberg, Lewis, Maurer, Lui, & Brent, 1999), stereo-acuity (Tytla, Lewis, Maurer, & Brent, 1993), face and object processing (Le Grand, Mondloch, Maurer, & Brent, 2001; Röder, Ley, Shenoy, Kekunnaya, & Bottari, 2013), and global motion perception (Bottari et al., 2018; Hadad, Maurer, & Lewis, 2012). However, there are other visual functions which were found to be less affected by a transient period of congenital visual deprivation, including biological motion processing (Bottari et al., 2015; Hadad et al., 2012) and the presence of a retinotopic representation and processing in the visual cortex (Sourav, Bottari, Kekunnaya, & Röder, 2018).
Non-human animal studies have consistently shown that different aspects of color processing, including wavelength discrimination, spectral sensitivity, and color-based object categorization are not affected by dark or red-light rearing (Boothe, Teller, & Sackett, 1975; Brenner, Cornelissen, & Nuboer, 1990; Brenner, Schelvis, & Nuboer, 1985; Petry & Kelly, 1991). Boothe et al. (1975) reported that an infant monkey raised in darkness from the age of 2 weeks to 3 months after birth was able to discriminate all of the tested wavelengths from white light. Moreover, both in pigeons (Brenner, Spaan, Wortel, & Nuboer, 1983) and in monkeys (Brenner et al., 1990, 1985), it has been shown that rearing in a color deprived environment (such as red illumination) did not alter the ability to discriminate objects based on colors and spectral sensitivity curves (Brenner et al., 1990, 1985). Furthermore, both chromatic opponency (a retinal aspect of color vision) and chromatic induction (a cortical aspect of color vision; Livingstone & Hubel, 1984; Michael, 1978) were observed to be unaffected in a red light reared macaque monkey (Brenner et al., 1990). Despite this compelling evidence of normal color development in color deprived or visually deprived non-human animals, there are only a few human studies that reported the effect of visual deprivation on the development of color perception.
Maurer, Lewis, & Brent (1989) used the Hardy-Rand-Rittler (HRR) pseudoisochromatic plates and reported normal color vision performance in children treated for bilateral congenital cataract (n = 14 eyes of 9 children, diagnosed before 6 months of age, and optical correction was given between 4.4 to 16.4 months) as well as bilateral developmental cataract (n = 9 eyes from 5 children, diagnosed between 7 months to 66 months, and optically corrected 2.5 to 29 months later). McKyton, Ben-Zion, Doron, & Zohary (2015) found that the ability to identify an odd item that differed in its color content from an array of similar items did not differ between individuals with “early treated cataract” (n = 8, 7 individuals operated ≤6 months of age, and one individual operated at 21 months of age) and sighted control observers (n = 11) whose vision was blurred according to their age-matched cataract cases’ contrast sensitivity deficits. In addition, McKyton et al. (2015) included a group of “late treated cataract” individuals (n = 11, operated between 5.6–9.9 years of age). Within this “late treated cataract” group, individuals who were tested more than 1 year after the cataract surgery had similar color discriminability compared to their contrast sensitivity matched sighted controls. However, despite this initial evidence, these studies either exclusively used shortly deprived individuals (<6 months [Maurer et al., 1989]) or were not sensitive to the identification of color deficits along specific color axes (i.e. long, middle, and short wavelength axes; McKyton et al., 2015).
Given that the detailed psychophysical and electrophysiological investigation of neural mechanisms related to color processing in sight recovery individuals pose logistical challenges (such as poor vision, specific hardware/software requirements), as a first step, it is imperative to exclude any major color vision deficits across any specific color axes in sight recovery individuals. To that end, we took advantage of a tertiary eye care set up and used the Farnsworth D15 color vision test, which allowed us to identify possible axis specific and unspecific color vision deficits. We tested a group of individuals who were diagnosed with bilateral dense congenital cataracts (hereafter referred to as CC), bilateral developmental cataracts or incomplete congenital cataracts (hereafter referred to as DC), and sighted control (SC) participants with normal or corrected to normal visual acuity. Participants in both CC and DC groups underwent cataract surgery with intraocular lens implantation and optical correction. Since our a priori hypothesis predicted a null result, we additionally included a group of individuals who were known to have congenital color vision defects as a positive control. We hypothesized that CC individuals would have similar color discrimination performance to DC and SC individuals.
Methods
Participants
Participant characteristics of CC and DC group (BCVA- Best corrected visual acuity)
Participant characteristics of CC and DC group (BCVA- Best corrected visual acuity)
All participants were recruited and tested at The LV Prasad Eye Institute, Hyderabad, India (LVPEI). The CC group comprised of 12 participants (6 females, mean age: 17.58 years, range: 8–33 years, mean age at surgery: 78.83 months, range: 4–218 months; mean logMAR visual acuity: 0.69, range: 0.29–1.29). The history of bilateral dense congenital cataracts was confirmed by medical records. In addition to the clinical diagnosis, factors such as presence of sensory nystagmus, absence of fundus view prior to surgery, and positive family history, aided in the classification of CC participants. Our control samples included two groups. The DC group consisted of 10 participants (6 females, mean age: 14.5 years, range: 9–37 years; mean logMAR visual acuity: 0.30, range: 0 to 1.04). This group served as control for visual impairments and other effects related to a history of cataracts. The SC group included 14 participants (6 females, mean age: 17.86 years, range: 7–27 years). Additionally, we tested 4 participants (2 females, median age: 19 years, range 13–28 years) who were known to have congenital color deficiency. The participant characteristics of CC and DC groups are given in the table above (Table 1).
All participants and their legal guardians (in case of minors) provided written informed consent prior to taking part in the study. Participants or the legal guardians were reimbursed for the study participation related expenses such as travel costs. Minor participants received a small gift. The study protocol adhered to the tenets of Declarations of Helsinki (World Medical Association, 2013). The study was approved by the Local Ethical Commission of the Faculty of Psychology and Movement Sciences, University of Hamburg, Germany, as well as the Institutional Ethical Review Board of LVPEI.
Figure 1 shows the Farnsworth D15 test used in the present study. The test panel containing the color chips was displayed on a black background, and participants viewed the targets binocularly. The D15 test contains a total of 16 caps (colors of which were designed such that they are isoluminant on the CIE diagram). Out of these 16 caps, the reference cap (indicated by the arrow in Fig. 1) is fixed, and rest of the 15 caps are movable. All of the movable caps are numbered on their backside. At the beginning of the test, all caps were randomly jittered and kept on a black sheet, and the participants were required to keep the cap that closely matches the reference cap next to the reference cap. Then, the participant took the next cap that most closely resembled the previous cap and moved it next to the previous cap. This procedure was repeated for all remaining movable caps. A perfect arrangement of caps by a color normal person is shown in Fig. 1top panel, whereas Fig. 1bottom panel shows the arrangement of caps by a participant with a color vision defect.

Farnsworth D15 panel used for the testing of color vision. The left most chip indicated by the white arrow is the fixed reference panel. The top panel shows the caps arranged by an individual with normal color vision and the bottom panel shows the cap arrangement by an individual with color deficiency.
Participants performed the test on their own pace. Once participants had arranged all of the caps, the panel was turned over, and the numbers on their backs were recorded on a recording sheet. These numbers corresponded to the positions of the tested color chips along the hue circle. The order of the colors in the D15 panel are designed in a manner such that specific color deficiencies would produce specific cap arrangements, in which, connecting their cap numbers in the recording sheet will produce lines along one of the confusion axes of dichromats (See red, green, and blue dotted lines in Fig. 2A-C). This aspect of the test provides the diagnostic value towards identifying a specific color defect. If there were any errors, participants were required to repeat the test, and their repeat measurement was taken for the analysis. The entire test took approximately 10 minutes.
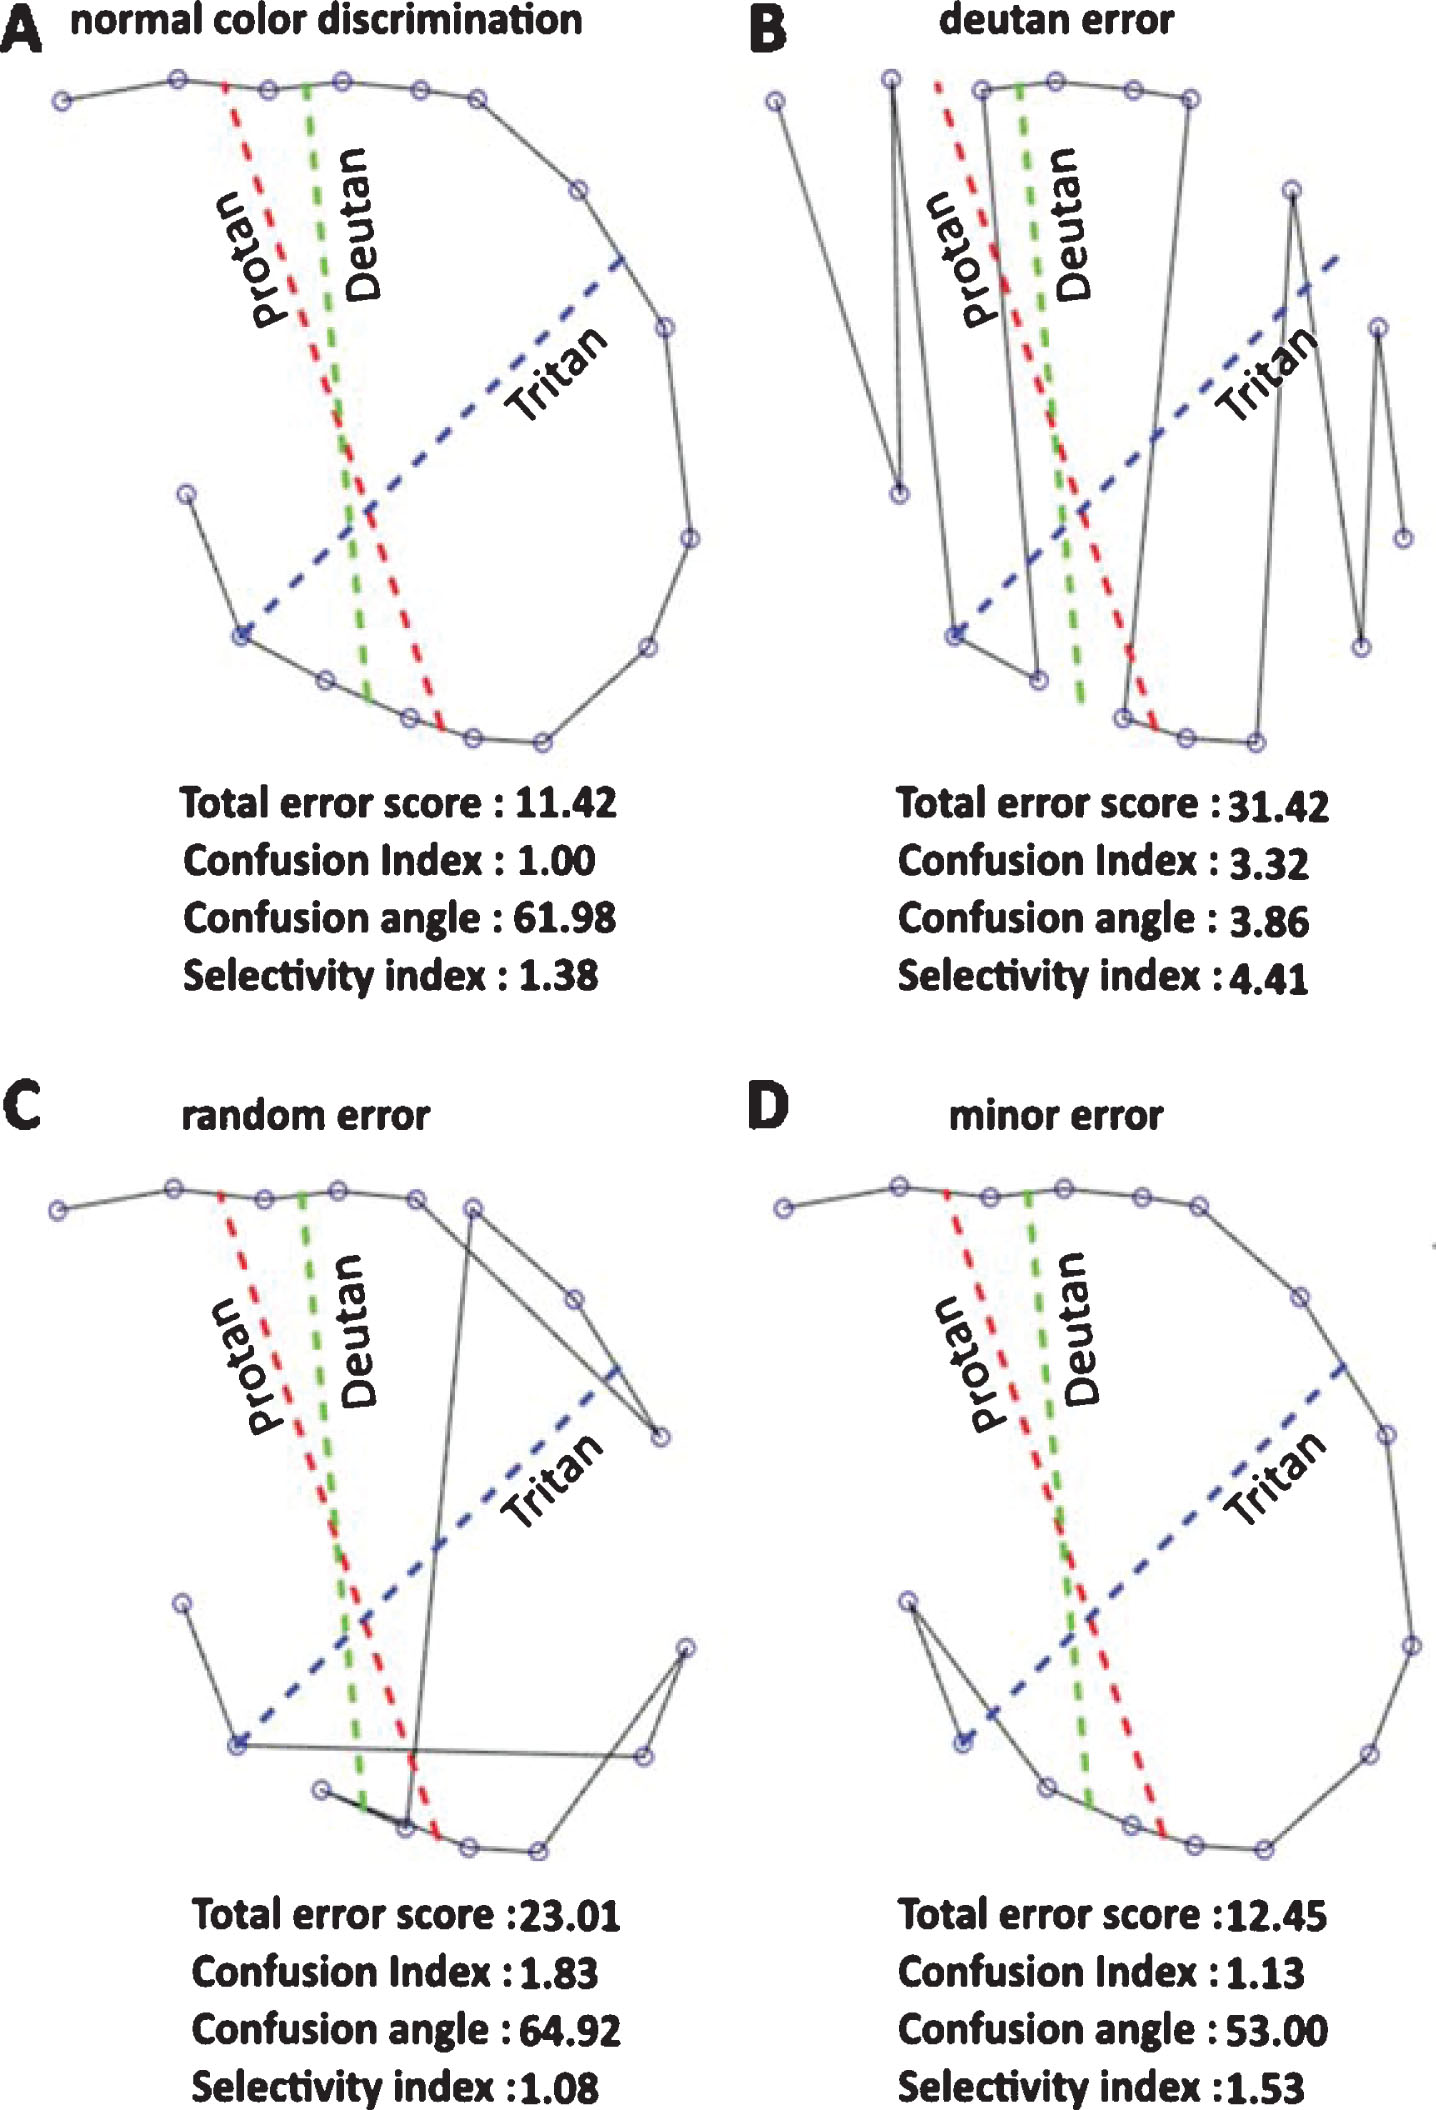
Examples of D15 panel arrangements by participants and their corresponding color vision indices. The red, green, and blue lines indicate long, middle, and short wavelength confusion axes, respectively. Cap arrangements by individuals with normal color discrimination (A), deutan (middle wavelength deficit) error (B), random errors unspecific to any color axis (C), a minor error along the protan (long wavelength deficit) axis (D).
As a clinical test, visual inspection of the D15 recording sheet was used to qualitatively identify a color vision defect. However, we were interested in the quantification of color vision defects, if present. Hence, we used the vector based quantification method proposed by Vingrys and King-Smith (1988) to derive the following parameters: (1) confusion angle which indicates the type of color defect, (2) confusion index which reveals the degree of color loss relative to a perfect arrangement of caps, and (3) selectivity index, which reflects the polarity and lack of randomness in a cap arrangement, and (4) a total error score.
A detailed procedure of the vector analysis can be found elsewhere (Vingrys & King-Smith, 1988). Briefly, each test cap value was transposed into 1976 CIELUV color space and color difference vectors between adjacent caps were calculated. All of these relative color difference vectors were plotted such that normal color vision resulted in a scatter around the origin, whereas different color vision defects produced color difference vectors that aligned themselves in distinct axes (for examples, see Supplementary Figure S1). Assuming these color difference vectors as “rigid, weightless bars”, major and minor moments of inertia of this vector plot can be calculated along its principal axes. The axis angle that produced minimum moment of inertia determined the confusion angle, whereas the length of the major radius of gyration yielded the confusion index, and the ratio of major and minor radii of gyration was calculated as the selectivity index. Figure 2A and 2B show the panel arrangements and their color vision metrics by individuals with normal color discrimination and deutan color deficiency, respectively. A perfect arrangement indicating normal color discrimination resulted in the following values: - confusion index: 1, total error score: 11.42, confusion angle: 61.98, and selectivity index: 1.38. The usefulness of this vector based technique is illustrated in Fig. 2C and 2D: Fig. 2C shows multiple random errors with diametric crossings but not specific to any color confusion axes, while Fig. 2D displays a single small error along the protan axis. Hence, the confusion index and total error score of Fig. 2C were greater than in Fig. 2D, however, the selectivity index of Fig. 2D was greater than in Fig. 2C. Custom written software in Matlabtrademark version 8 (The MathWorks, Inc., Natick, MA, USA) was used to perform the above mentioned analysis. The software is available upon request.
Statistical analysis
Since the data did not follow a normal distribution, between-group comparisons were tested using Kruskall-Wallis (KW) test, and separate KW tests were run for each of the four dependent variables (i.e. total error score, confusion index, confusion angle, and selectivity index). Formal statistics were conducted using IBM SPSS Statistics 20 (SPSS Inc., Chicago, IL). The data from color deficient individuals were used to demonstrate the ability of our set up to isolate color vision deficiencies, and not included in the formal data analysis.
Results
The following table (Table 2) summarizes the descriptive statistics of the measured color vision indices (total error score, confusion index, confusion angle, and selectivity index) across the CC, DC, SC groups.
Summary measures of calculated color vision indices. CC- bilateral dense congenital cataract; DC- bilateral developmental cataract/incomplete congenital cataract; SC- sighted controls
Summary measures of calculated color vision indices. CC- bilateral dense congenital cataract; DC- bilateral developmental cataract/incomplete congenital cataract; SC- sighted controls
Figure 3 shows the measured color vision indices in CC, DC, and SC individuals (along with median and inter-quartile range). All four color indices were indistinguishable between the CC, DC, and SC groups (Total error score: χ2(2) = 4.24, p = 0.12; Confusion index: - χ2(2) = 4.02, p = 0.13; Confusion angle: χ2(2) = 1.57, p = 0.46; selectivity index: χ2(2) = 1.92, p = 0.38). In addition, Spearman rank correlation analysis revealed no association between the visual acuity and color vision indices (Total error score: rs(20) = – 0.09, p = 0.69; Confusion index: rs(20) = – 0.09, p = 0.69; Confusion angle: rs(20) = 0.11, p = 0.63; selectivity index: rs(20) = 0.07, p = 0.77) in individuals with the history of cataract (see Supplementary Figure S2).

Comparison of color vision indices across groups (individual data with median and inter-quartile range; CC- bilateral dense congenital cataract; DC- bilateral developmental cataract/incomplete congenital cataract; SC- sighted controls; CD- individuals with a congenital color deficiency.
Individuals with congenital color vision deficiencies (n = 4, filled symbols in Fig. 3) markedly differed from the CC, DC, and SC groups, and did not overlap with these groups in terms of their total error score (color vision deficiencies range: 29.28 to 37.71),confusion index (color vision deficiencies range: 2.88 to 4.03), and confusion angle (3.86 to – 52.76). The confusion angles of congenital color deficient individuals indicated that two of them had deficiency along the protan axis (3.86, and 5.31), one of them had deficiency along the deutan axis (– 13.47), and the remaining participant had deficiency along the tritan axis (– 52.76). Based on the selectivity index, two of the four congenital color deficiency individuals had relatively selective losses along their respective axes (4.41 and 5.93) compared to the other two individuals (2.16 and 1.25).
The goal of the present study was to examine the effect of transient congenital visual deprivation on the development of color vision as measured using Farnsworth D15 test. To that end, we quantified different color vision metrics in a distinct group of individuals who had a period of severe visual deprivation due to dense bilateral congenital cataracts (CC) and compared them to two control groups. The first control group comprised of individuals who had developed cataract later in their childhood (i.e. developmental cataract, DC) or had a history of non-dense congenital cataract, and the second group of individuals with normal or corrected to normal visual acuity (i.e. sighted controls, SC). All of the computed color vision metrics, namely total error score, confusion angle, confusion index, and selectivity index did not differ between CC, and DC, SC individuals (Fig. 3). Thus, our findings strongly argue against a sensitive period for the development of basic color discrimination and color arrangement.
Our results extend previous reports on color processing in sight recovery individuals after a short (Maurer et al., 1989) or long (McKyton et al., 2015) period of visual deprivation from birth due to cataracts. The methods used by both Maurer et al. (1989) and McKyton et al. (2015) were not sensitive to identify any possible axis specific color vision defects, and it is important to note that congenital color deficiencies are usually axis specific (Simunovic, 2010), as indicated by the individuals in our color deficiency group. In addition, the experimental paradigm of McKyton et al. (2015) randomly sampled the color space (hue values) at fixed, pre-determined intervals, hence, it is unclear how individuals with known color vision deficits would have performed in this paradigm. For example, the probability of sampling someone’s deficient color axis might affect the goodness of fit of the psychometric function itself, rather than exclusively moving the psychometric function to the right, producing an elevated hue difference threshold.
To address the above-mentioned limitations, we took the following steps in our study design and analysis. Firstly, we included CC individuals with more extensive periods of visual deprivation (mean age at surgery: 83.6 months; range: 4–396 months) compared to Maurer et al. (1989) and McKyton et al. (2015). Secondly, we calculated two color metrics that would indicate any axis specific color deficits, namely confusion angle and confusion index. Both of these metrics were unaffected by a transient period of sensory deprivation. Thirdly, we included individuals with developmental cataracts as a control group, and this group served as control for visual impairment and other effects that were related to a history of cataract and cataract surgery (for e.g., differential wavelength absorption characteristics between human crystalline lens and implanted intraocular lens (Davison, Patel, Cunha, Schwiegerling, & Muftuoglu, 2011). Finally, we tested a group of individuals with known congenital color vision deficiencies, who were appropriately isolated by our current testing setup.
Our results might suggest two possible speculative explanations regarding the role of visual experience on the development of color discrimination: (1) the neural mechanisms that are responsible for the color discrimination can start developing later in adulthood, once visual input is available, or (2) these mechanisms mature irrespective of the presence of visual input. While our data do not allow to decide between these two accounts, it could be argued that color discrimination abilities recover after sight restoration based on the following observation: In the study of McKyton et al. (McKyton et al., 2015), some of the “late treated cataract” individuals were tested immediately after (or within weeks of) the cataract surgery, during which they showed elevated color discrimination thresholds compared to their control participants. However, their color discrimination thresholds reached the values that were similar to that of the sighted control participants when tested 1 year after the surgery. These data, together with our results, suggest that color vision evolves without early visual input during the first months of visual experience. Furthermore, newborns aged 1 to 7 days (Adams & Courage, 1998) as well as young infants aged 1 to 3 months (Hamer, Alexander, & Teller, 1982; Packer, Hartmann, & Teller, 1984) were able to discriminatechromatic light from achromatic light, tested using preferential looking methods, and categorization of basic hues (and their boundaries) seems to be adult-like in 4 month old infants (Bornstein, Kessen, & Weiskopf, 1976). These results suggest an early development of color discrimination despite immature cones (Yuodelis & Hendrickson, 1986). Hence, long deprivation does not seem to result in a loss or irreversible damage, neither at the peripheral nor at the central processing level.
Accurate measurement of color discrimination is a challenging task since the non-color related cues, such as luminance, can aid color discrimination, and generating isoluminant patterns has specific hardware requirements. Here, we have taken advantage of a standardized clinical test of color discrimination, namely the Farnsworth D15 panel test. The D15 test is an easily comprehensible test which needs less than 10 minutes of testing for completion. This test does not require the participants to be familiar with numerals in a specific script, unlike the pseudo-isochramatic plate tests, such as Ishihara. These advantages of accessibility and short testing duration are important, as our testing population was a special clinical population with a wide age range including children.
Although we used a standardized clinical test employed for color assessment, and a widely used vector based method (Vingrys & King-Smith, 1988) for quantifying color metrics, there is a potential limitation that needs to be addressed here. The study was conducted at a regular clinical set up under the normal room lighting (correlated color temperature: 5637°K, illuminance: 140.4 lux measured using X-Rite i1 Display Protrademark color calibration device), rather than the standard Illuminant C or Macbeth Easel Lamp that is considered to provide a stable approximation of the natural daylight. Although it has been shown that some fluorescent lamps are comparable to Illuminant C for the purposes color testing (Hovis & Neumann, 1995), we additionally tested the ability of our set up to identify individuals with known congenital color vision deficits. For this purpose, we tested 4 congenitally color blind participants, and our set up was able to pick up all of the congenital color deficiencies.
In conclusion, the present results showed that the major color vision indices were unaltered by a period of congenital visual deprivation, extending previous findings from human and non-human studies (Boothe et al., 1975; Brenner et al., 1990, 1985; Maurer et al., 1989; McKyton et al., 2015; Petry & Kelly, 1991). Therefore, our data strongly argues against a sensitive period for the development of color discrimination.
Disclosure
K Pitchaimuthu, None; S Sourav, None; D Bottari, None; S Banerjee, None; I Shareef, None; R Kekunnaya, None; B Röder, None.
Footnotes
Acknowledgments
The authors thank D. Balasubramanian for supporting the study at LVPEI and Maria Guerreiro and Siddhart Srivatsav for aiding in the participant recruitment and data collection. The study was supported by European Research Council grant ERC-2009-AdG 249425-CriticalBrainChanges (BR) and DFG Ro 2625/10-1 (BR).