
Abstract
Background:
In low vision patients, the assessment of contrast sensitivity is an essential tool to determine the stage of visual impairment. However, traditional contrast sensitivity tests rely on verbal feedback, and the expertise of the examiner.
Objective:
In the current study, a fast, OKN-based virtual diagnosis tool was developed estimating contrast sensitivity automatically without active cooperation of the patient as well as the practitioner within 3.5 minutes.
Methods:
In a HTC Vive headset with an SMI-eye tracker, a virtual rotating drum was implemented, and an algorithm was developed, evaluating the occurrence of an OKN. The tool was evaluated in healthy subjects as well as under low vision simulation for two spatial frequencies and four contrasts. It was then compared to two contrast sensitivity estimates based on manual report on the orientation of static gratings as well as the movement direction of translating gratings.
Results:
An algorithm was developed, which matched ground truth ratings of occurrence of OKN with an accuracy of 88 %. Furthermore, known differences in contrast sensitivity between healthy and low vision conditions as well as a decrease in contrast sensitivity for lower spatial frequencies was successfully reproduced in the developed tool.
Conclusions:
The developed OKN-based sensitivity test represents a reliable proof of concept for technology readiness of virtual reality-based screening tools of visual function in practice, specifically in patients with difficulties to report perception verbally, or under conditions, where no experienced examiner is present.
Introduction
Patients with low vision require specific medical care and frequent exams to preserve residual functional vision. Visual impairment often occurs with additional disabilities, such as hearing impairment (Chia et al., 2006). Other visual impairments exist from birth, and require frequent check-ups in early infancy with limited possibilities of patient interaction, among many others CHARGE syndrome (Blake & Prasad, 2006). Therefore, a considerable amount of low vision patients is limited in their ability to cooperate in test of their visual function.
The estimation of contrast sensitivity is a common examination method in low vision, in aforementioned patients in best case executed with minimal or no cooperation of the patient (Chung & Legge, 2016; Hyvärinen, 1995). Tests like ‘Hiding Heidi’, and the LEA low-contrast symbol test, where gaze behavior is evaluated by an examiner to execute a contrast sensitivity test, are specifically developed for patients with low cooperation (Chen & Mohamed, 2003). Whereas the second test even requires verbal report, both of them definitely can only be executed by a trained examiner, and a cooperating patient.
The current study intends to evaluate a virtual reality-based contrast sensitivity test which does neither require an experienced examiner, nor needs active attention of the patient in a setting. A subject wearing the headset is shown in Fig. 1. It is based on the reflexive movement of the optokinetic nystagmus (OKN), an involuntary pursuit movement, alternating with saccades in the opposite direction (Cohen, Matsuo, & Raphan, 1977). OKN is executed in the presence of a homogeneous optic flow (Liversedge, Gilchrist, & Everling, 2012). The virtual reality (VR) application presented is based on the device used e.g. in infants to estimate visual acuity or oculomotor function, the so-called OKN drum (Dobson & Teller, 1978). The OKN drum is a cylindrical rotatable object covered with a pattern of alternating black and white stripes turned in front of the patient’s eyes. Figure 2 shows an example horizontal eye position signature, in which the successive execution of slow pursuit phases and saccadic eye movements is clearly visible.
The current study integrates the OKN drum into a VR-scenario, extending it with an automated analysis of eye movements in a fully integrated setup. An algorithm is developed to reliably estimate the occurrence of an OKN, it is benchmarked against manual report-based contrast sensitivity estimations of static and moving gratings. In addition to the benefit of fast execution without active cooperation of the patient and experience of the examiner, the tool provides the benefit of an objective analysis with a standardized procedure and standardized lighting conditions.
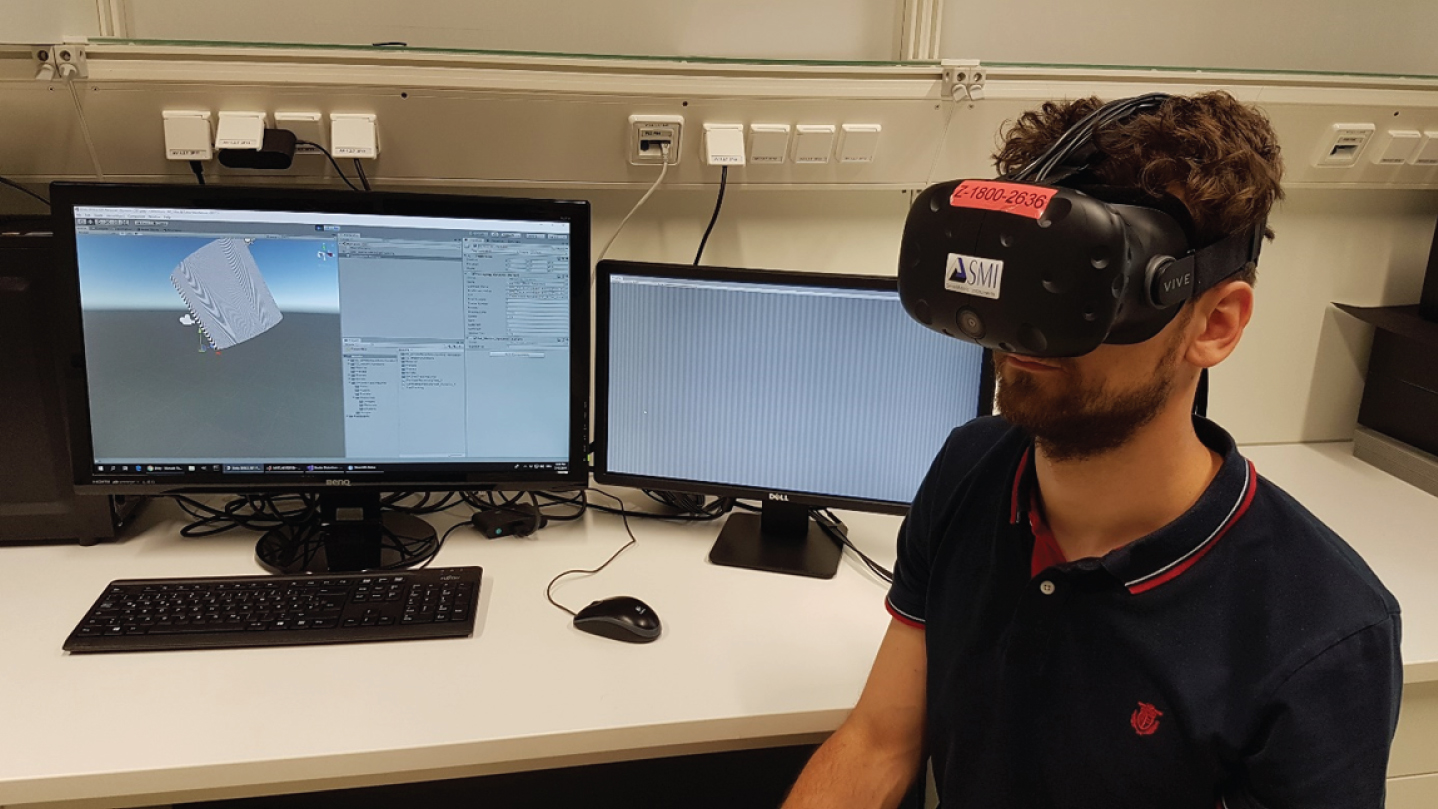
Subject wearing the virtual reality headset during the task.

Exemplary experiment trial from the OKN-based contrast sensitivity test with prominently expressed slow and fast phases of optokinetic nystagmus. Horizontal eye position signature upon viewing a black and white stripe pattern at 10 deg/sec, which changes movement direction after 1.5 seconds. The direction of the slow phases indicates the movement direction of the pattern.
Experimental setup
The hardware used to implement a virtual reality environment was the HTC Vive VR system (High Tech Computer Corporation, Taoyuan, Taiwan). The hardware consisted of a head mounted display (HMD) with an 8 bit screen, together with two-tracking devices, so-called light-houses, as well as a computer, together with a keyboard for manual responses. The lighthouses were placed in opposite corners of the room facing each other to track the area in between.
The VR scene was created in the development environment Unity (Unity Technologies, San Francisco, USA), implemented via Unity’s VR SDK. Visual Studio 2017 was used to determine the environment parameters in C#.
Eye movements were recorded with an SMI eye tracker (SensoMotoric Instruments GmbH, Teltow, Germany) with a sampling rate of 250 Hz, which was embedded into the HTC Vive VR headset. The SMI software plug-in allowed interaction between the eye tracking device and Unity.
Stimulus generation
For our study the Unity coordinate system was assumed to be in meters. To construct the virtual environment, an OKN drum object was placed in the center of the scene. It was a cylinder with a radius of two meters with the crucial black and white stripe pattern of a square-wave grating. The large size of the cylinder was chosen to minimize perspective-induced increase of spatial frequency in the periphery of the visual field. The pattern of the drum filled the full visual field. To change the pattern’s spatial frequency (SPF) during experimental runs, a shader was implemented to control for the width of black and white stripes, which then determined the spatial frequency tested. The SPFs chosen in this study were: 0.25 cpd, 0.5 cpd and 0.75 cpd, based on prior work on OKN (Garbutt et al., 2003; Waddington & Harris, 2015). A further script allowed rotation of the drum at pre-determined velocities and directions throughout the experiment. The velocity for the drum is set to a speed of 10 deg/sec based on prior studies (Garbutt et al., 2003; Sakai et al., 2002; Waddington & Harris, 2015). Contrast modulation was implemented as a screen effect post-processing shader attached to a scene camera. The cylinder was positioned fixed relative to the scene camera’s coordinate system.
The true contrast displayed in the HMD is not known. The present study thus uses Michelson contrast estimates based on contrast levels estimated on the basis of a linearized look-up table in MATLAB R2018a (The MathWorks, Inc., Natick, Massachusetts). Within the text, the term contrast sensitivity is used as well, it is defined to be the inverse of the Michelson contrast at threshold. Consequently, analysis is limited to a relative comparison between different contrast thresholds. For future absolute contrast threshold estimations, a thorough determination of luminance and contrast within the HMD will have to be carried out.
To test whether low vision (LV) impairment has an impact on the OKN during the contrast sensitivity measurements, a simulation of cataract was chosen. Specifically contrast sensitivity is reduced in cataract (Shandiz et al., 2011) and its way of affecting vision can be displayed in a rather realistic way.
The basis of the cataract simulation was provided by a simulation Fractional Brownian Motion noise as displayed in Fig. 3A, where the grayscale value indicated the level of transparency. The pattern was applied as a material to a plane filling the field of view of a separate scene camera, unaffected by the contrast reducing post-processing shader, turning it into a head-fixed see-through object with cloudy parts that are disturbing the vision of the person wearing the headset. A representative view is shown in Fig. 3B. The two camera views are merged with the layering technique, where the original scene camera sees the cylinder with its varying contrast and spatial frequencies, whereas the second camera sees the cataract simulation, together with the view of the original scene camera in the back-ground.

A) Cataract simulation, based on Fractional Brownian Motion noise pattern, B) Representative view in VR scene in the LV condition at 10% contrast.
Eye-tracking data was stored, in addition to frame-by-frame info on rotation direction of the drum, as well as contrast and spatial frequency of the drum pattern. Synchronization markers of direction change of the drum rotation in the eye-tracking data allowed temporal matching of eye-tracking data and visual parameters.
Subjects
12 healthy subjects with normal or corrected-to-normal vision and a mean age of 25.1±1.7 years participated in the study. Two subjects were excluded, as they were not able to perform the reference task of manual-report based contrast sensitivity estimation. The study was approved by the Ethics Committee of the Medical Faculty of the Eberhard Karls University of Tübingen and the University Hospital.
Experimental procedure
Subjects were asked to take seat in front of the computer within the tracked area. Before the experiment started, subjects were introduced to the tasks, until they reported understanding. Throughout the experiment, the area covered by the subject was detected by the light house boxes guaranteeing a correct tracking of the HMD. Before the experiment started, the individual interpupillary distance was measured and set in the HMD of the HTC Vive. Next, the subject put on the HMD and adjusted it to make wearing as comfortable as possible. A subject wearing the HMD is shown in Fig. 1. A 3-point calibration was used in this study. The user fixated a shown point target and followed its motion sequence, which paused in three different locations. The headset was not removed until the experiment was completed to ensure a constantly valid eye tracking calibration.
The main experiment consisted of four different phases: a manual report based static contrast sensitivity test, a manual report based dynamic contrast sensitivity test and an OKN-based contrast sensitivity test. In the manual report-based tests health conditions were tested in randomized trial order. In the OKN-based test the two health states were tested separately. The static and dynamic test relied on manual responses of the subject on a keyboard, while the OKN based test relied on eye traces only. The order of the four experimental phases was randomized. In the static test the OKN drum was presented without rotation at a given orientation, while the dynamic and optokinetic test used a rotating drum. The stimuli for all four phases were generated using the Unity scene described above consisting of the OKN drum with striped pattern.
The static and dynamic manual report test consisted of a total number of 360 trials, with 10 trials of a specific type. Trial types consisted all different combinations of six different contrasts (0 %, 0.42%, 0.85 %, 1.7 %, 3.3 %, 6.8 %), three SPFs (0.25 cpd, 0.5 cpd, 0.75 cpd) and two health states. The order of the stimuli was randomized.
For the static test, the OKN drum was tilted randomly either – 45° or 45° related to the z-axis before presenting the stimuli, resulting in a static tilted stimulus to the left or right side. Each stimulus was shown for 500 ms to the subject. After presentation of each stimulus, the subject reported the perceived tilt via key press of the left or right arrow key, see Fig. 4A.

A) Manual-report based test condition trial procedure scheme, B) OKN-based test condition trial procedure scheme.
The dynamic test followed the same procedure as the static contrast sensitivity estimation, but instead of tilting the OKN drum around the z-axis, it was rotated clockwise or anticlockwise around the y-axis during presentation of the stimulus. This resulted in a stimulus randomly moving either to the right or to the left side. Again, perceived movement direction was reported via keyboard inputs of right or left arrow. The trial procedure is displayed in Fig. 4A.
In the OKN-based contrast sensitivity test condition, 12 different types of stimuli were shown in a randomized order. They originated from all combinations of four contrasts (0.42 %, 0.85 %, 1.7 % and 10 %) and three SPFs (0.25 cpd, 0.5 cpd and 0.75 cpd). In Fig. 4B the procedure of a single trial is displayed. During one trial, the drum rotated in four directions for a duration of three seconds each. First, the drum is rotating clockwise and then anticlockwise around the y-axis, resulting in a horizontal motion of the pattern. Then, the same rotation is repeated around the z-axis, generating a vertical pattern motion. Overall, one test lasted less than 3.5 minutes plus approximately 30 seconds for preparation. In total, the optokinetic contrast sensitivity test was conducted twice, once with low vision simulation, and once without low vision simulation. Subjects were instructed to gaze at the center of the striped pattern. Throughout the OKN-based condition, eye-movements were recorded.
Estimation of contrast sensitivity based on manual reports
In the manual-report based test conditions, a contrast threshold was estimated from the proportion of correct answers at each stimulus contrast. Proportion correct decreased with decreasing stimulus visibility to reach chance level once the stimulus becomes invisible. The decision between left and right tilt, or left or right motion, respectively, represents a two-alternative forced-choice experiment, with a chance level of 50%. For calculation of the sensitivity threshold of 75 pc, MATLAB R2018a was used in combination with the Matlab psignifit 4 toolbox (Schütt, Harmeling, Macke, & Wichmann, 2016). Analysis was performed on a subject-by-subject basis, separately for spatial frequencies, test type and health state.
Estimation of contrast sensitivity based on OKN eye movements
Eye tracking data was evaluated with MATLAB R2018a. OKN eye movements were identified based on their slow pursuit phase. Hence, an algorithm was developed to perform a decision, if an OKN occurred or not, as a potential indicator for visual perception of the respective shown contrast.
Binocular gaze data in arbitrary coordinates together with their corresponding time stamps were analyzed. At first, data was split into different phases according to stimulus contrast, SPF, each phase was thereafter processed separately. Data of opposite stimulus motion was inverted and merged. The collected data was smoothed with a Savitzky-Golay filter (Kolarov, 2009). Afterwards, a saccade filter was applied, using a modified version of existing microsaccade filters (Kliegl & Engbert, 2003). Saccades were deleted from the dataset with the intention to analyze behavior in the pursuit phases of the OKN exclusively. Thereafter, velocity was estimated. Depending on the movement direction, either horizontal or vertical velocity was processed further. Then, a velocity threshold was introduced to separate pursuit eye movements from residual eye movements. As fast saccadic eye movements have been excluded already, slow OKN pursuit movements are assumed to be the fastest movement component. Non-OKN eye movements were considered to show considerably lower velocities. A second threshold was defined, determining a necessary fraction of high-velocity data for the classification as OKN, in the following called OKN threshold.
In the following, two thresholds are defined. To do so, a two-step rational is followed: At first, a velocity threshold distinguishes velocity samples in which pursuit occurred from samples in which the eyes moved randomly or were even fixed, and in which a velocity signal occurs through tracker noise. The two types of samples are distinguished by the assumption that high velocity indicates the occurrence of pursuit. It is thus a criterion which allows to determine the time windows, in which an OKN occurred. The second threshold, termed OKN threshold, determines how much of the time of one trial with a specific stimulus property the eye needs to move at high velocity to be labelled as “stimulus induced an OKN”. Figure 5 does indeed show a bimodal distribution of high-velocity percentages after application of the velocity threshold to all datasets with horizontal stimulus motion. This bimodality indicated that datasets either showed a particularly low number of high-velocity samples, or a particularly high number of high-velocity samples. Time windows with low number of high-velocity samples are considered time windows in which no OKN occurred. In contrast, time windows with a high number of high-velocity samples are considered time windows in which an OKN occurred. The estimated OKN threshold of 48% nicely separates these two types of datasets. The algorithm-based data labelling is performed separately for horizontal and vertical stimulus motion phases. The final criterion for the occurrence of an OKN was fulfilled if data from a specific stimulus type was classified as OKN eliciting either in vertical or horizontal direction. An OKN-based contrast sensitivity threshold was defined as the smallest contrast that elicited an OKN according to the classification of the algorithm. This procedure was executed separately for each of the 12 scenes, and for each participant.
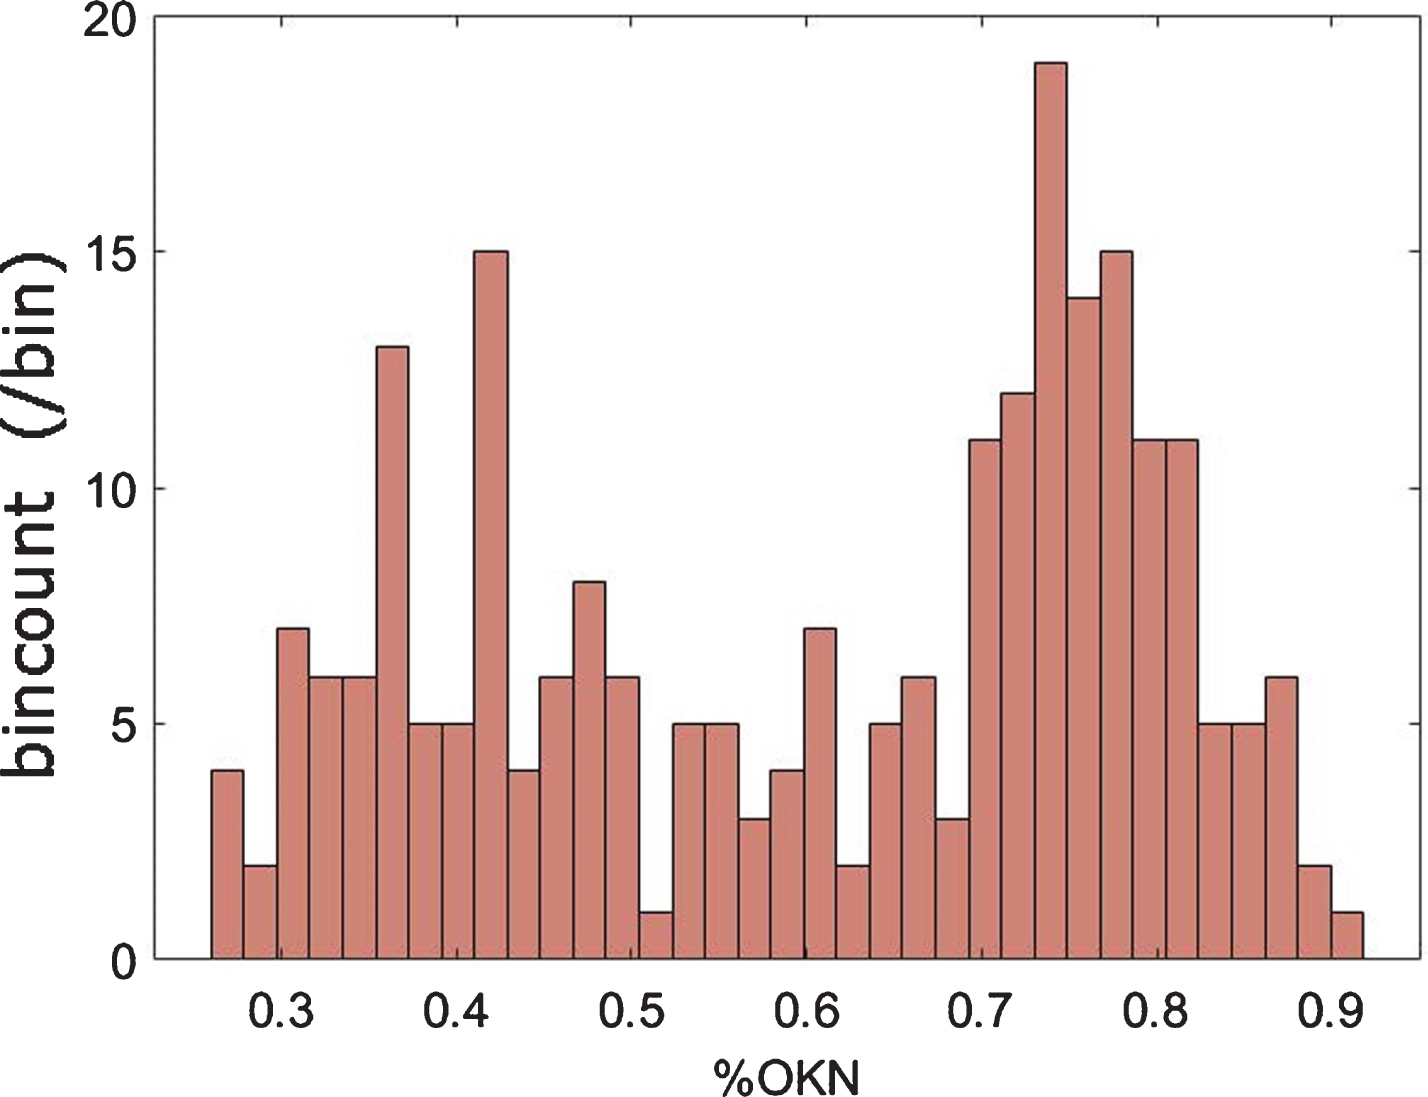
Resulting % OKN responses of horizontal OKN data from all spatial frequencies and both health states, after application of a median velocity threshold of 13 px/s. A bimodal distribution is visible indicating a set of measurements, where an OKN is elicited with a peak at approx. 0.75 % OKN, and a second set of measurement, where rather no OKN is elicited, with a peak at approx. 0.35. This distribution nicely confirms the selected OKN threshold of 48%.
Velocity and the OKN threshold were determined based on a ground truth. The ground truth was generated by visual inspection of the data of half of the subjects in the LV condition. To do so, eye movement data of each subject, contrast, movement direction, and spatial frequency was separately rated according to two the categories: “no OKN”, in contrast to “OKN”.
Five of the ten subjects were selected randomly to estimate the parameters in the manner of the above-described method. The data of the remaining five subjects were labelled for later validation, but not included in the optimization. Velocity threshold and OKN-threshold were optimized to fit the ground truth in these randomly selected subjects. Afterwards, the algorithm was applied on the remaining five subjects to validate performance.
The optimization of the two thresholds, velocity threshold, and OKN threshold resulted in a velocity threshold of 13 px/s horizontally and 5 px/s vertically together with an OKN threshold of 48 %. When pooling data from all participants and all measurement sets for a velocity threshold of 13 px/s and evaluating the distribution of occurring fractions of OKN, a bimodal distribution becomes obvious, confirming the existence of datasets without the occurrence of an OKN, as well as datasets with the occurrence of an OKN. Figure 5 shows the pooled velocity horizontal velocity data.
Upon validation, the acquired thresholds were applied to eye tracking data of the validation dataset, separately for trials in which the gratings moved horizontally, and in which gratings moved vertically. In all 60 validation datasets, consisting out of four contrasts and three spatial frequencies for five subjects, the occurrence of a horizontal OKN was classified correctly. The occurrence of a vertical OKN was classified correctly in 52 out of 60 datasets. The final classification was acquired from the occurrence of an OKN in at least one of the two categories. In this classification, 53 out of 60 datasets were classified correctly. The described algorithm thus shows a classification accuracy of 88% in our dataset.
After estimation of contrast thresholds in all three conditions, namely static manual report based, dynamic manual report based, test types were compared in an ANOVA with the factors test-type, health condition, and spatial frequency. OKN-based data was analyzed via Kruskal-Wallis tests.
Results
Manual-report based contrast sensitivity estimates
Response curves for static and dynamic manual-report based tests at SPF of 0.25cpd of one representative subject are shown in Fig. 6. Response rates in the healthy and LV condition are displayed in the same figure and fitted with the psignifit toobox providing a cumulative gaussian sigmoid curve fit. Upon comparison of the two health states, the LV condition is shifted to the right significantly. This shift transfers directly into a higher threshold at 75 pc. Thresholds were calculated for all three SPFs, both test types, and both health conditions, resulting in 12 contrast sensitivity estimates per subject. At the spatial frequency of 0.75 cpd, thresholds exceeded the expected values, potentially due to VR headset frame sampling induced misperceptions. The SPF 0.75 cpd was thus excluded from further analysis.
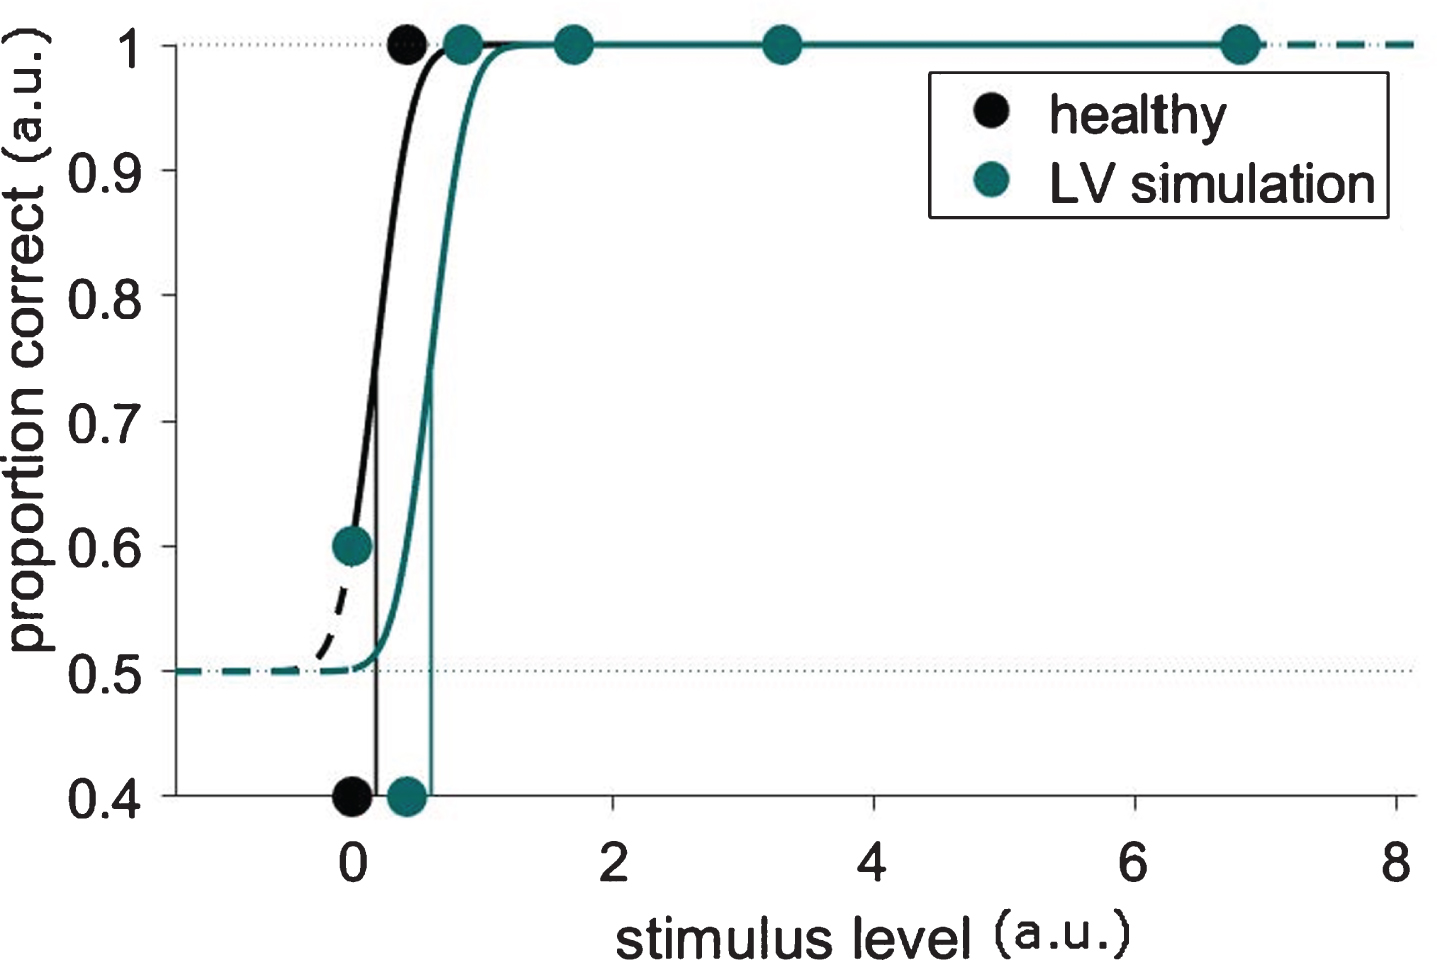
Response curves for dynamic manual-report based tests at SPF of 0.25cpd of one representative subject. A clear shift of the proportion correct curve towards higher stimulus levels is visible, leading to a higher contrast threshold, indicated by the vertical line. Please note that the data points of the healthy conditions are hidden behind the data points of the low vision condition upon saturation.
In a three-factor ANOVA, statistical significant differences between the factors spatial frequency, manual-report test type, and health state were tested. As main effects, LV and healthy condition differed significantly (F(1, 73) = 304.11, p < 0.0001), furthermore test types (F(1, 73) = 36.27, p < 0.0001, and SPFs (F(1, 73) = 12.26, p < 0.001). Contrast thresholds in low vision were consistently higher than in the healthy condition, confirming the effectiveness of our simulation.
Furthermore, an interaction between health state, and test type was found (F(1, 73) = 23.1, p < 0.0001). Post-hoc Tukey-Kramer comparison revealed a difference between manual-report test types in low vision only, but not in the healthy condition (p < 0.001). Furthermore, an interaction between SPF and health status was found (F(1,73) = 11.43, p < 0.01). In Post-hoc Tukey-Kramer comparisons in the LV condition, the dynamic test type shows lower contrast thresholds (p < 0.001). Spatial frequencies differed in the low vision condition as well in the manual-report test type, indicating a higher threshold for the lower spatial frequency of 0.25 cpd (p < 0.01).
Contrast sensitivity based on OKN eye movements
OKN-based estimation of contrast sensitivity is summarized in Table 1. Healthy vision shows a floor effect in threshold of 0.42%, in close agreement with the contrast thresholds from manual report-based contrast sensitivity estimations. Contrast threshold estimations in the LV health state condition show much higher thresholds.
OKN-based contrast sensitivity thresholds
OKN-based contrast sensitivity thresholds
For the statistical analysis of the optokinetic contrast thresholds a non-parametric Kruskal-Wallis test was chosen as the data gathered with the OKN tool is not normally distributed. The LV condition shows significantly higher contrast thresholds than the healthy condition (Chi2 = 51.88, p < 0.001, df = 1,58). The test indicates no significant difference between SPFs at a significance level of 0.05. The tendency of spatial frequency differences is nonetheless identical to the manual-report based tests, namely a higher threshold for 0.25 cpd in the low vision condition (Chi2 = 0.54, p > 0.05, df = 2, 57).
Statistical comparison between manual report test types and OKN test type
To evaluate the developed OKN-based contrast sensitivity test, it was compared to manual-report contrast sensitivity tests that were conducted in the same VR environment. Figure 7 depicts the average contrast thresholds determined with the three different test types in both SPFs. While under healthy conditions (Fig. 7A) the thresholds of all three test types only differ slightly, the variation under LV conditions (Fig. 7B) is more pronounced. The OKN-based contrast threshold is more than two times higher than manual-report-based thresholds. OKN-based thresholds are not normally distributed; thus, a nonparametric method was selected to compare all three test types statistically. The Kruskal-Wallis test indicates a significant difference between the static, dynamic and optokinetic test type (Chi2 = 17.75, p < 0.001, df = 2, 117). Post-hoc comparison indicated a significant difference between the static and the optokinetic test (p < 0.05) and the dynamic and the optokinetic test (p < 0.001), but not between the two manual-report based tests.
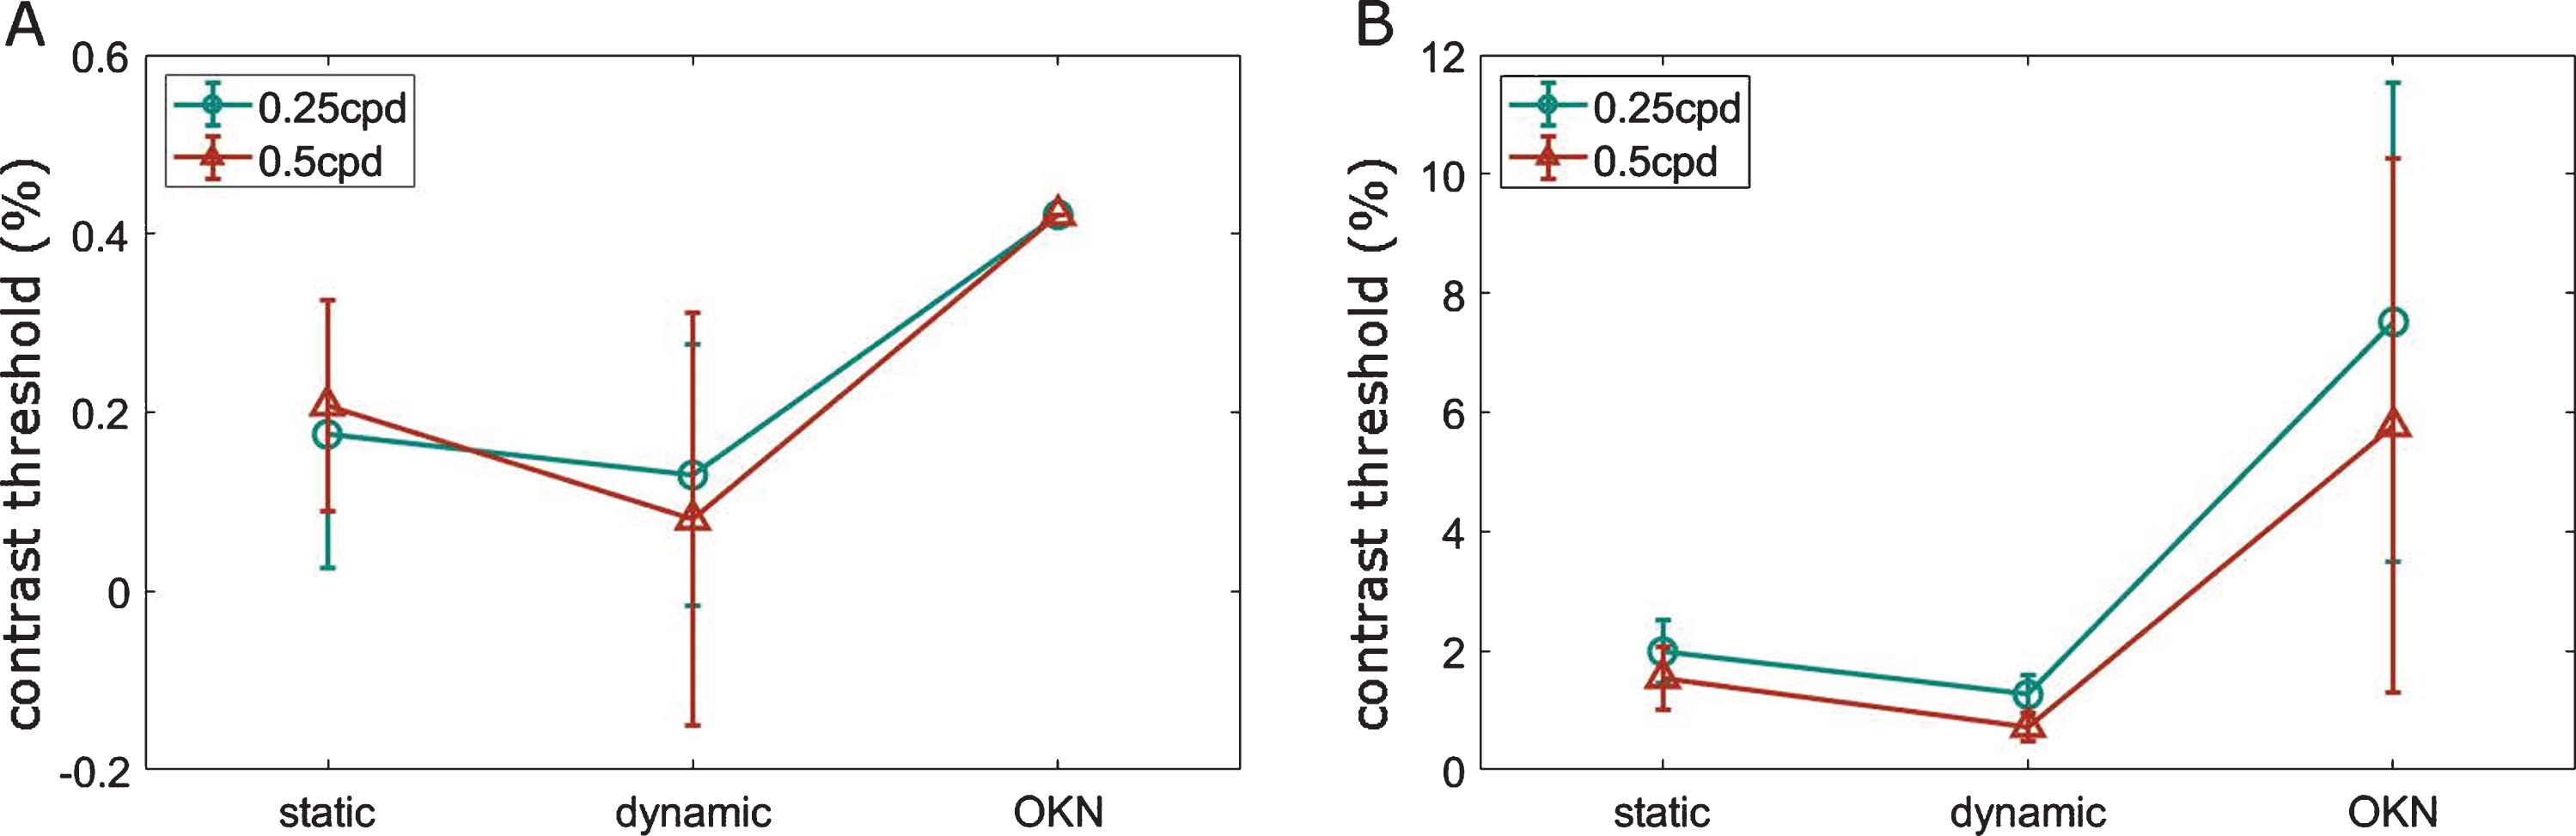
Average contrast thresholds determined with the three different test types in both SPFs. A) healthy condition: thresholds of all three test types differ only slightly, B) LV condition: thresholds vary considerably. Please note, that the scale between healthy and LV data is different. Error bars show standard errors among subjects.
In the present study, an OKN-based VR contrast sensitivity test was developed and validated in an independent dataset. A rotating drum was implemented in a VR environment, and a simulation of cataract implemented in VR. An algorithm for automatic detection of an occurring OKN was developed. A prediction accuracy of 88% for the detection of an OKN was reached.
In our psychophysical evaluation VR based contrast sensitivity was successfully estimated mainly under LV simulation. In healthy vision, contrast sensitivity exceeded contrast resolution of the VR headset. In a direct comparison, all tests successfully mirrored the decrease in contrast sensitivity under LV simulation. In the LV simulation, highest contrast sensitivity was measured for manual-report based estimation of sensitivity to a moving grid pattern, followed from manual-report based estimation of contrast sensitivity to a static grid pattern. The OKN-test successfully reproduces a lower contrast sensitivity in the LV condition, and a correct trend of a higher threshold at a lower spatial frequency. Its sensitivity is nonetheless significantly lower than the manual-report based tests, probably mainly due to contrast levels tested, which were not specifically adjusted to the expected contrast threshold in low vision. Instead, the number and exact values of the contrast sensitivity function were determined on the basis of pre-tests, in which the number of different contrasts was intended to be minimized. After the principle has now been demonstrated to be working future algorithm versions can greatly be improved by exploiting smart threshold estimation algorithms to cover more tested spatial frequencies. Within manual-report test types where contrast sensitivities have not been tested the same way restrictively the dynamic test type attains lower contrast thresholds than the dynamic test type under LV conditions, in agreement with the literature (Atkinson, Braddick, & Moar, 1977; Schor & Levi, 1980). A moving contrast stimulus might thus be a beneficial estimation of contrast perception for many situations in everyday life where we are moving in a dynamic environment. Consequently, adding a dynamic method to traditional examination routine could represent a good overall picture to assess the patient’s visual function (Zavod & Long, 2001). Neurally, these two contrast sensitivities might rely on distinct mechanisms (Kulikowski & Tolhurst, 1973). Differences between spatial and temporal contrast sensitivities have been assigned to magnocellular and parvocellular pathways, respectively (Leonova, Pokorny, & Smith, 2003). In monkey studies a dominant role of the laterale geniculate nucleus was determined (Miller, Pasik, & Pasik, 1980; Schiller & Colby, 1983). Recent voices stress the temporal component of static contrast sensitivity through fixational eye movements (Rucci, Ahissar, & Burr, 2018).
Since the 1990s OKN has been used to evaluate contrast sensitivity in a research context, primarily in infants (Brown, Lindsey, McSweeney, & Walters, 1995; Y. Teller, Succop, & Mar, 1993). The contrast sensitivity function is well described and known to rather mirror contrast sensitivity to moving gratings. OKN-thresholds have been described to be comparable to perceptual thresholds to moving gratings, in healthy as well as amblyopic vision (Leguire et al., 1991). OKN was suggested as clinical measure for visually impaired patients, based on naked-eye observations (Sakai et al., 2002). It was evaluated as tool for visually acuity estimation, but interdependency of OKN and visual acuity has shown to be rather moderate (Çetinkaya, Oto, Akman, & Akova, 2008; Wester, Rizzo, Balkwill, & Wall, 2007). Instead, a correlation with contrast sensitivity was confirmed in children (Çetinkaya et al., 2008). In clinical practice, until now OKN-based estimations of contrast sensitivity do not play any role. The commonly used tests for young or disabled persons, such as ‘Hiding Heidi’ or the LEA low-contrast symbol chart, show floor effects at 1.25%, similar to our test. The minimal measurable contrast of 0.42% originates in the limited bit depth of the HTC Vive display, and might become considerably lower in future displays. Furthermore, bit depth can be enhanced (Tyler, 1997). Thus, for a quick contrast sensitivity estimation in LV patients, the present contrast level of 0.42% already excels clinical practice (Chen & Mohamed, 2003).
The current study is limited to relative comparisons between test types, as the true illumination at the eye within the VR headset is unknown. Furthermore, future tests should reveal, how the results, acquired under simulation of cataract transfer to LV patients. For clinical application the used hardware setup suffers from a set of limitations. A set of limitations originate in the hardware setup itself. First, bit depth of the display was limiting in presenting low contrast stimuli, furthermore pixel resolution and repetition rates limited testable SPFs and velocities. A cable connecting the headset and a computer limited the free positioning of the subject. In addition to that, algorithmic accuracy was limited by eye tracking accuracy. All the aforementioned limitations will be settled in future VR and eye tracking devices and will easily increase OKN detection accuracy. This is probably also true for the hassle of eye tracking calibration, which has already been reduced strongly in the most recent eye tracking devices but will potentially be reduced further soon. A further limitation can be settled by the development of a specific hardware and the implementation of the test tool as standalone application, namely the exact determination of illumination, and the dependency of our system from freely available software. In such a standalone system, quasi real-time data analysis could be easily implemented as well, which would provide contrast thresholds right after the test. Within the software, refinements to contrast levels as well as to tested spatial frequencies and speeds might strongly improve performance. Thus, for clinical application, a hardware development phase, followed by a validation in a variety of pathologies should follow. The application would be of specific benefit in retinal and optic nerve pathologies. Application in pathologies affecting oculomotor behavior would have to be carefully validated, as those might be impacted in their reliability. The objective nature of the developed test further allows an application in perceptual learning, were response-based test paradigms might influence learning (Maniglia et al., 2016). For even finer estimations of contrast sensitivity which allow more challenging test conditions VEP (visually evoked potential)-based recordings can be applied (Dobson & Teller, 1978).
The present study presents a VR tool, which within 3.5 minutes allows automatic estimation of contrast sensitivity in LV requiring only little cooperation of the patient. With the aforementioned improvements from anticipated development of VR technology, it provides a powerful tool in clinical routine, which might strengthen integration of contrast sensitivity testing into clinical practice. The VR tool provides two properties essential for successful integration into the clinical routing: easy applicability, and short test durations. The hardware implementation in one device, and software incorporation of an automated analysis makes the tool applicable even for untrained medical personnel. Current eye tracking setups often consist of separate presentation and tracking units. The overall test duration of 3.5 minutes makes the test competitive with other quick contrast sensitivity estimations, which easily sum up to 5 minutes examination time. But furthermore, the OKN-based contrast sensitivity tool provides an objective measure, measurements from different visits can easily be stored, compared, and longitudinal trends can be assessed. In future implementation, it might even be combined with other tests of visual function, such as perceptual or oculomotor tests. From a more visionary point of view, the developed test might even be applied at home as screening tool, potentially implemented even in augmented reality.
Footnotes
Acknowledgments
The authors thank Prof. Trauzettel-Klosinski for contributions during the development phase of the study. The authors acknowledge the financial support by the Federal Ministry of Education and Research of Germany in the framework of IDeA (project number 16SV8104).