
Abstract
Background:
In the cranial cavity, a space-occupying mass such as epidural hematoma usually leads to compression of brain. Removal of a large compressive mass under the cranial vault is critical to the patients.
Objective:
The purpose of this study was to examine whether and to what extent epidural decompression of the rat primary somatosensory cortex affects the underlying microvessels, spiny stellate neurons and their afferent fibers.
Methods:
Rats received epidural decompression with preceding 1-week compression by implantation of a bead. The thickness of cortex was measured using brain coronal sections. The permeability of blood-brain barrier (BBB) was assessed by Evans Blue and immunoglobulin G extravasation. The dendrites and dendritic spines of the spiny stellate neurons were revealed by Golgi-Cox staining and analyzed. In addition, the thalamocortical afferent (TCA) fibers in the cortex were illustrated using anterograde tracing and examined.
Results:
The cortex gradually regained its thickness over time and became comparable to the sham group at 3 days after decompression. Although the diameter of cortical microvessels were unaltered, a transient disruption of the BBB was observed at 6 hours and 1 day after decompression. Nevertheless, no brain edema was detected. In contrast, the dendrites and dendritic spines of the spiny stellate neurons and the TCA fibers were markedly restored from 2 weeks to 3 months after decompression.
Conclusions:
Epidural decompression caused a breakdown of the BBB, which was early-occurring and short-lasting. In contrast, epidural decompression facilitated a late-onset and prolonged recovery of the spiny stellate neurons and their afferent fibers.
Introduction
In the cranial cavity, a space-occupying mass such as epidural hematoma, intracerebral hematoma, or extradural meningioma (Darkwah Oppong et al., 2018; Gutowski et al., 2018; Liu et al., 2015) usually leads to compression of brain (Martinez et al., 2011; Moreira et al., 2006; Yang et al., 2006). The mainstay of treatment, especially for more severe patients, is surgical decompression. For instance, head traumatic injury to the middle meningeal artery, emissary vein, or dural sinus can result in epidural hematoma which is characterized of accumulation of blood in the space between the inner calvarium and the dura mater (Toner & Prabhu, 2009; Zwayed & Lucke-Wold, 2018). Clinically, large epidural hematomas with a significant mass effect and those associated with neurologic deterioration are symptomatic and life-threatening and require surgical evacuation and decompression to achieve functional neurologic recovery.
Traumatic cerebral compression has been shown to cause decrease of cerebral microvessel perfusion, brain tissue injury (Hekmatpanah, 2007), ischemia (Hoffman et al., 2003; Toyota et al., 2001), disruption of blood-brain barrier (BBB) (Habgood et al., 2007), and brain edema (Cernak et al., 2004). Conversely, cerebral decompression was reported to lower the intracranial pressure (Howard et al., 2008), increase the brain tissue oxygen (Jaeger et al., 2003), and reduce the ischemia (Weiner et al., 2010). Furthermore, our previous work demonstrated that moderate but sustained epidural compression of the rat primary somatosensory cortex impairs the BBB integrity of cortical microvessels and the somatic sensation of animal in the early period (Lin et al., 2010). Thus, it is tempting to hypothesize that cortical microvessels are also implicated in the recovery following surgical decompression.
The essential function of somatosensory cortex is reception and translation of sensory inputs. Furthermore, intact sensory inputs are necessary for proper motor control (Kusoffsky et al., 1982) and physical and cognitive functions (Dobkin, 1991; Gallace & Spence, 2009). The sensation of rodent whiskers is transmitted to the ventral posteromedial (VPM) nucleus of the thalamus. The VPM nucleus sends out the thalamocortical afferent (TCA) fibers to innervate the stellate neurons in layer IV of primary somatosensory cortex (Kharazia & Weinberg, 1994). Traumatic compression on the somatosensory cortex has been shown to cause impairment of somatosensory electrophysiology (Sanders et al., 2001) and suppression of thalamocortical oscillations (Kao et al., 2012). Furthermore, our recent work showed that moderate but sustained epidural compression of the rat primary somatosensory cortex causes reduction of the TCA fibers, shrinkage of the dendritic arbors and stripping of the dendritic spines of cortical layer IV spiny stellate neurons for a prolonged period (Yeh et al., 2017). These results raise the possibility that thalamocortical connections may be involved in the restoration after surgical decompression.
To address these hypotheses, the present study used a bead implantation model that mimics clinical scenarios to investigate the morphological alterations in the primary somatosensory cortex after epidural decompression. The morphology of cortical microvessels and the permeability of BBB were quantified. The dendrites and dendritic spines of spiny stellate neurons were analyzed. In addition, the TCA fibers in the cortex were illustrated and examined.
Materials and methods
Animal experiments
The present series of experiments involved adult male Sprague-Dawley rats (200–250 g; Charles River, BioLASCO Taiwan) that were randomly assigned to three experimental groups. 1) Sham group (n = 36), receiving sham surgery without implantation of a bead. 2) Compression group (n = 36), in which a bead was implanted. 3) Decompression group (n = 156), in which a bead was implanted and subsequently removed. In addition, 21 rats were assigned to normal group. All procedures were performed in accordance with the National Institute of Health (NIH) Guide for the Care and Use of Laboratory Animals and approved by the Institutional Animal Care and Use Committee at Tzu Chi University. All efforts were made to minimize the number of animals used and their suffering. Rats were fed ad libitum and housed in environmentally enriched cages in a room maintained on a 12 h light/dark cycle.
Surgical compression and decompression
Surgical epidural compression was achieved using a reliable bead implantation method as previously described (Chen et al., 2003; Lin et al., 2010; Yeh et al., 2017). In brief, anesthesia was induced using chloral hydrate (315 mg/kg intraperitoneally; Merck, Darmstadt, Germany). Animals were placed on a heating pad to maintain a constant body temperature with their head mounted in a stereotaxic ear bar device (51600, Stoelting, IL, USA). A local anesthetic lidocaine was administered subcutaneously at the site of incision. Following a midline scalp incision, a burr hole was drilled in the right cranial vault under a surgical microscope (OPMI pico, Carl Zeiss Meditec, Jena, Germany) in accordance with previously determined coordinates such that a hemispherical plastic bead (5 mm in diameter and 1.5 mm in thickness) with its convex surface facing down could be implanted into the epidural space. The bead center was located at 0.84 mm posterior to and 4.5 mm lateral to the bregma, thus compressing the right primary somatosensory cortex (Lin et al., 2010; Yeh et al., 2017). The left contralateral side was sham-operated without bead implantation. The scalp was then sutured and the animal was transferred to a temperature-controlled cage for its recovery from anesthesia. The compression group animals were allowed to survive for 1 week. The cranial vault of animals assigned to normal group was not drilled but the animals assigned to sham group were subjected to craniectomy without bead implantation.
The animals assigned to decompression group underwent the same surgery as the compression group. Following a week of sustained epidural compression, the implant was removed by reversing the bead implanting procedure. The 1-week compression time was decided because shrinkage of the dendrites and loss of the dendritic spines of spiny stellate neurons reached the maximum at this time (Yeh et al., 2017). Longer compression time was not adopted to reduce the animal suffering. After removal of the bead, the hole on the cranial vault was covered with a layer of bone wax to prevent the bulging of dura. The rats were allowed to survive for 6 hours (n = 24), 12 hours (n = 6), 18 hours (n = 6), 1 day (n = 36), 3 days (n = 30), 1 week (n = 18), 2 weeks (n = 12), 1 month (n = 12), or 3 months (n = 12).
Tissue processing
All histology was performed at the end of the experiment as previously described (Lin et al., 2010; Yeh et al., 2017). In brief, the rats were administered 630 mg/kg of chloral hydrate intraperitoneally. The left ventricle of heart was catheterized via a midline sternotomy. Saline was perfused for 5 min followed by 4% paraformaldehyde in 0.1 M phosphate buffer (PB) for 30 min. The brain was removed, postfixed in 4 % paraformaldehyde for 4 h, and then immersed in 30% sucrose in 0.1 M PB at 4°C for 3 days. Subsequently, the brain was frozen in Tissue-Tek O.C.T. embedding medium (Sakura Finetek, Torrance, CA, USA). Free-floating 20μm coronal sections were obtained on a cryostat (CM1850, Leica, Nussloch, Germany). Selected sections were processed with histochemistry or immunohistochemistry (see below). All reacted sections were mounted onto gelatin-coated slides, coverslipped using Permount (Fisher, Fair Lawn, NJ, USA), and examined with a Zeiss Axioplan microscope. Images of reacted sections were acquired using a SPOT cooled CCD camera (Diagnostic, Sterling Heights, MI, USA) combined with a SPOT software (VR 4.6.3.8).
Immunohistochemistry
Brain sections from 6 normal group, 6 sham group, 6 compression group, and 24 decompression group (6 hours, 1 day, 3 days, and 1 week) animals were processed with immunohistochemistry, cytochrome oxidase reaction (see below), and alkaline phosphatase histochemistry (see below). For immunohistochemistry, sections were immersed in 1% H2O2 for 1 h and then in 10% normal goat serum (Vector, Burlingame, CA, USA) for 1 h at room temperature. After incubation at 4°C for 18 h in primary antibody rabbit anti-microtubule associated protein 2 (MAP2, 1:1000; M3696, Sigma, St. Louis, MO, USA) or mouse anti-glial fibrillary acidic protein (GFAP, to reveal astrocytes, 1:400; G3893, Sigma) in 0.1 M phosphate-buffered saline (PBS), sections were immersed in secondary antibody biotinylated goat anti-rabbit or goat anti-mouse IgG (1:200; Vector) for 1 h at room temperature. The endogenous IgG is a sensitive marker of BBB permeability and is valuable in the assessment of BBB disruption. To label endogenous IgG, another series of sections were incubated in biotinylated rabbit anti-rat IgG (1:200; Vector). The Vectastain Elite ABC kit (1:100; PK-6100, Vector), 0.05% 3, 3’-diaminobenzidine tetrahydrochloride (DAB; Sigma) and 0.01% H2O2 in Tris buffer were used to visualize the immunostaining signal. The anti-MAP2 labeled sections were used to measure the thickness of cortex. The cortical thickness ratio was derived from the cortical thickness of the injured (right) side over that of the contralateral (left) side in each animal. For endogenous IgG analysis, the optical density (OD) ratio was derived from the OD of the whole area of the injured primary somatosensory cortex over that of the contralateral cortex in each section and the mean OD ratio was the average of OD ratios of the same animal group.
Cytochrome oxidase reaction
The mitochondrial cytochrome oxidase reaction was employed to reveal a series of barrels which are composed of cortical layer IV stellate neurons as described in our previous study (Lin et al., 2010; Yeh et al., 2017), thus verifying if our sections contain the primary somatosensory cortex and distinguishing cortical layers I–IV from V–VI. Selected sections were stained in a solution, 0.05% DAB (Sigma), 4% sucrose (Sigma), and 0.02% cytochrome c (Sigma) in 0.1 M PBS at 37°C for 3 h in the dark and then washed with cold 0.1 M PBS.
Alkaline phosphatase histochemistry
To stain the cortical microvessels, selected sections containing the primary somatosensory cortex were incubated in a solution, 0.1 M NaCl (Sigma), 20 mM MgCl2 (Sigma), 0.0333% nitro-blue tetrazolium (NBT; Sigma), 0.0165% 5-bromo-4-chloro-3-indolyl phosphate p-toluidine salt (BCIP; Sigma), 0.5% Triton X-100 (Sigma), and 0.89% dimethyl formamide (Sigma) in 0.1 M Tris buffer (pH 9.0), for 30 min at room temperature as described in our previous study (Lin et al., 2010). Sections were then washed with 10 mM Tris buffer (pH 7.5). In each section, the total area occupied by cortical microvessels in the right primary somatosensory cortex was divided by the total area of the right primary somatosensory cortex. The obtained value of the right (lesion) side was further divided by that of the left (contralateral) side in each section, acquiring the area ratio. The diameter ratio was derived from the average diameter of all cortical microvessels of the injured cortex over that of the contralateral cortex in each section.
Cerebral infarct measurement
To determine whether cortical decompression causes ischemic damage, 2,3,5-triphenyltetrazolium chloride (TTC; Sigma) was used to stain the brain slices which contain the primary somatosensory cortex as described in our previous study (Lin et al., 2010). Three normal group, 6 sham group, 6 compression group, and 18 decompression group (6 hours, 1 day, and 3 days) animals were processed for TTC staining. First the rats were decapitated under deep anesthesia. Their brains were dissected out and immersed in ice-cold 0.1 M PBS for 20 min to facilitate cutting into 2 mm-thick coronal slices in a rodent brain matrix (RBM-4000C, ASI, Warren, MI, USA). Each side of the brain slice was stained with 2% TTC in 0.1 M PBS at 37°C for 6 min.
Evans Blue extravasation
In order to elucidate how epidural decompression may affect the BBB of cortical microvessels, Evans Blue which has high affinity for serum albumin was used. Three normal group, 6 sham group, 6 compression group, and 24 decompression group (6 hours, 12 hours, 18 hours, and 1 day) animals were processed for this experiment. Three percent Evans Blue (Sigma) in saline was injected (4 ml/kg) slowly into the femoral vein of animal and allowed to circulate for 90 min as described in our previous study (Lin et al., 2010). The rats were then transcardially perfused with saline followed by 4% paraformaldehyde. Their brains were dissected out and photographed. Subsequently, the selected cortical region was cut and immersed in 500μl formamide (Sigma) at 55°C for 24 h. The solution was centrifuged at 20,000 g for 20 min and the OD of the supernatant was measured at 620 nm using a microplate spectrophotometer (xMark, Bio-Rad, Hercules, CA, USA) with software (Microplate Manager 6, Bio-Rad) to determine the relative amount of Evans Blue in each sample solution. The OD ratio was derived from the OD of the injured (right) side over that of the contralateral (left) side in each animal.
Brain edema measurement
This method is commonly used to study the brain edema (Lin et al., 2010). Three normal group, 6 sham group, 6 compression group, and 18 decompression group (6 hours, 1 day, and 3 days) animals were used. After decapitation, the brain was quickly harvested. The cerebellum and brainstem were cut and discarded. The remaining right and left hemispheres were separated and the wet weight of each hemisphere was measured using a high-precision analytical balance (NewClassic ML54/02, Mettler-Toledo, Greifensee, Switzerland). The brain tissues were then completely dried in a desiccating oven at 100°C for 48 h and then the dry weight of each hemisphere was measured. The percentage of brain water content was calculated for each hemisphere as follows: [(wet weight – dry weight)/wet weight]×100.
Golgi-Cox impregnation
To visualize the dendrites and spines of cortical layer IV spiny stellate neurons, 3 normal group, 6 sham group, 6 compression group, and 36 decompression group (1 day, 3 days, 1 week, 2weeks, 1 month, and 3 months) animals were processed for Golgi-Cox impregnation as detailed in our previous study (Yeh et al., 2017). Briefly, the rats were anesthetized and perfused transcardially with saline. Their brains were removed and immersed in a Golgi-Cox solution, 1% HgCl2 (Sigma), 1% K2Cr2O7 (Sigma), and 1% K2CrO4 (Sigma), in the dark for 2 weeks at room temperature. The brains were then incubated in 30% sucrose in 0.1 M PB for 1 week at 4°C. Coronal 100μm brain sections were cut and collected on a vibratome, immersed in 25% ammonium hydroxide (Sigma), and then coverslipped. Cortical layer IV spiny stellate neurons were identified on the basis of their location and their morphological features (Yeh et al., 2017). Each neuron for analysis was reconstructed by tracing the neuronal soma and dendrites in successive coronal sections using Zeiss Plan-Neofluar objectives and a Zeiss camera lucida drawing tube as previously described (Chen et al., 2003; Yeh et al., 2017). Selected 6 neurons in each animal were reconstructed. The soma size (soma area) of a neuron was analyzed in the focal plane with its largest soma diameter. Scholl ring analysis was performed by counting the number of crossings of dendritic branches with each concentric 20μm ring. Two or three secondary dendritic segments of each neuron were selected to measure the spine density (Yeh et al., 2017). This was based on the prior finding that the secondary segments are longest and most numerous compared with other order segments (Ballester-Rosado et al., 2016).
Tracing of thalamocortical afferent fibers
The TCA fibers emitted by the thalamic VPM nucleus were investigated. To visualize the TCA fibers in the primary somatosensory cortex, anterograde tracing was performed on 3 normal group, 6 sham group, 6 compression group, and 36 decompression group (1 day, 3 days, 1 week, 2 weeks, 1 month, and 3 months) animals as previously described (Yeh et al., 2017). One week before sacrifice, the rats received anesthesia and a craniectomy. Two microinjections (1μl each) of 5% anterograde tracer Biotinylated Dextran Amine (BDA, 10,000 MW, Molecular Probes, Eugene, OR, USA) in 0.1 M PBS were applied, using a microliter syringe (87900, Hamilton, Reno, NV, USA), into the right thalamic VPM nucleus for 20 min (10 min for each injection). The coordinates of two microinjections on right side were interaural 5.2 mm, lateral 3.2 mm, inferior 5.8 mm and interaural 5.2 mm, lateral 2.4 mm, inferior 6.6 mm as detailed previously (Yeh et al., 2017). For each animal, another two microinjections were applied into the left thalamic VPM nucleus to serve as contralateral control.
One week after BDA injections, the rats were sacrificed and their brain cryosections were processed to stain the TCA fibers as detailed previously (Yeh et al., 2017). First, the cryosections were treated in 1% H2O2 in 0.1 M PB for 1 h. After rinses with 0.1 M PBS, the sections were reacted with Vectastain Elite ABC kit (1:100; Vector) in 0.1 M PBS at room temperature for 1 h and then stained with 0.05% DAB and 0.01% H2O2 in 0.05 M Tris buffer. To counterstain the neurons, the sections were blocked with 10% normal goat serum in 0.1 M PBS for 1 h at room temperature. After rinses with 0.1 M PBS, the sections were incubated in mouse anti-NeuN (1:400; MAB377, Chemicon, Temecula, CA, USA) in 0.1 M PBS for 18 h at 4°C. After rinses with 0.1 M PBS, the sections were incubated in biotinylated goat anti-mouse IgG (1:200; Vector) in 0.1 M PBS at room temperature for 1 h. After rinses with 0.1 M PBS, the sections were reacted with Vectastain Elite ABC kit (1:100; Vector) in 0.1 M PBS at room temperature for 1 h and then stained with Vector SG (blue/gray) substrate (SK-4700). Six TCA fiber patchs in each animal were selected and the distribution of fibers in barrels was quantified. The area occupied by TCA fibers in a barrel was divided by the total area of the barrel to obtain the area ratio. The area ratios of right cortex were divided by those of left cortex of the same animal to obtain the R/L area ratio. The TCA fiber density ratio was the average of all R/L area ratios of the same animal group. The sections containing BDA injection sites were also stained and validated as shown in our prior study (Yeh et al., 2017).
Image and statistical analyses
Lesioned and contralateral somatosensory cortices were photographed using the same exposure settings. The images of sections and drawings of neurons were analyzed using Image-Pro Plus software (Media Cybernetics, Silver Spring, MD, USA). The data analyses were performed with Prism software (GraphPad, San Diego, CA, USA) and statistical significance of differences was assessed using one-way ANOVA followed by Tukey test unless otherwise noted. P < 0.05 was considered statistically significant. The data were presented as mean±SEM.
Results
Thickness of cortex
The cytochrome oxidase reaction was used to reveal the feature of the rat primary somatosensory cortex. In the face area, the stellate neurons were organized into a series of barrels in the left and right cortices (Fig. 1A, B, black arrowheads). In the forelimb and hindlimb regions, layer IV was still visible but the cellular organization was not in barrel shape (Fig. 1A, B, white arrowheads). Through this experiment, we could verify that the compression site is the primary somatosensory cortex.
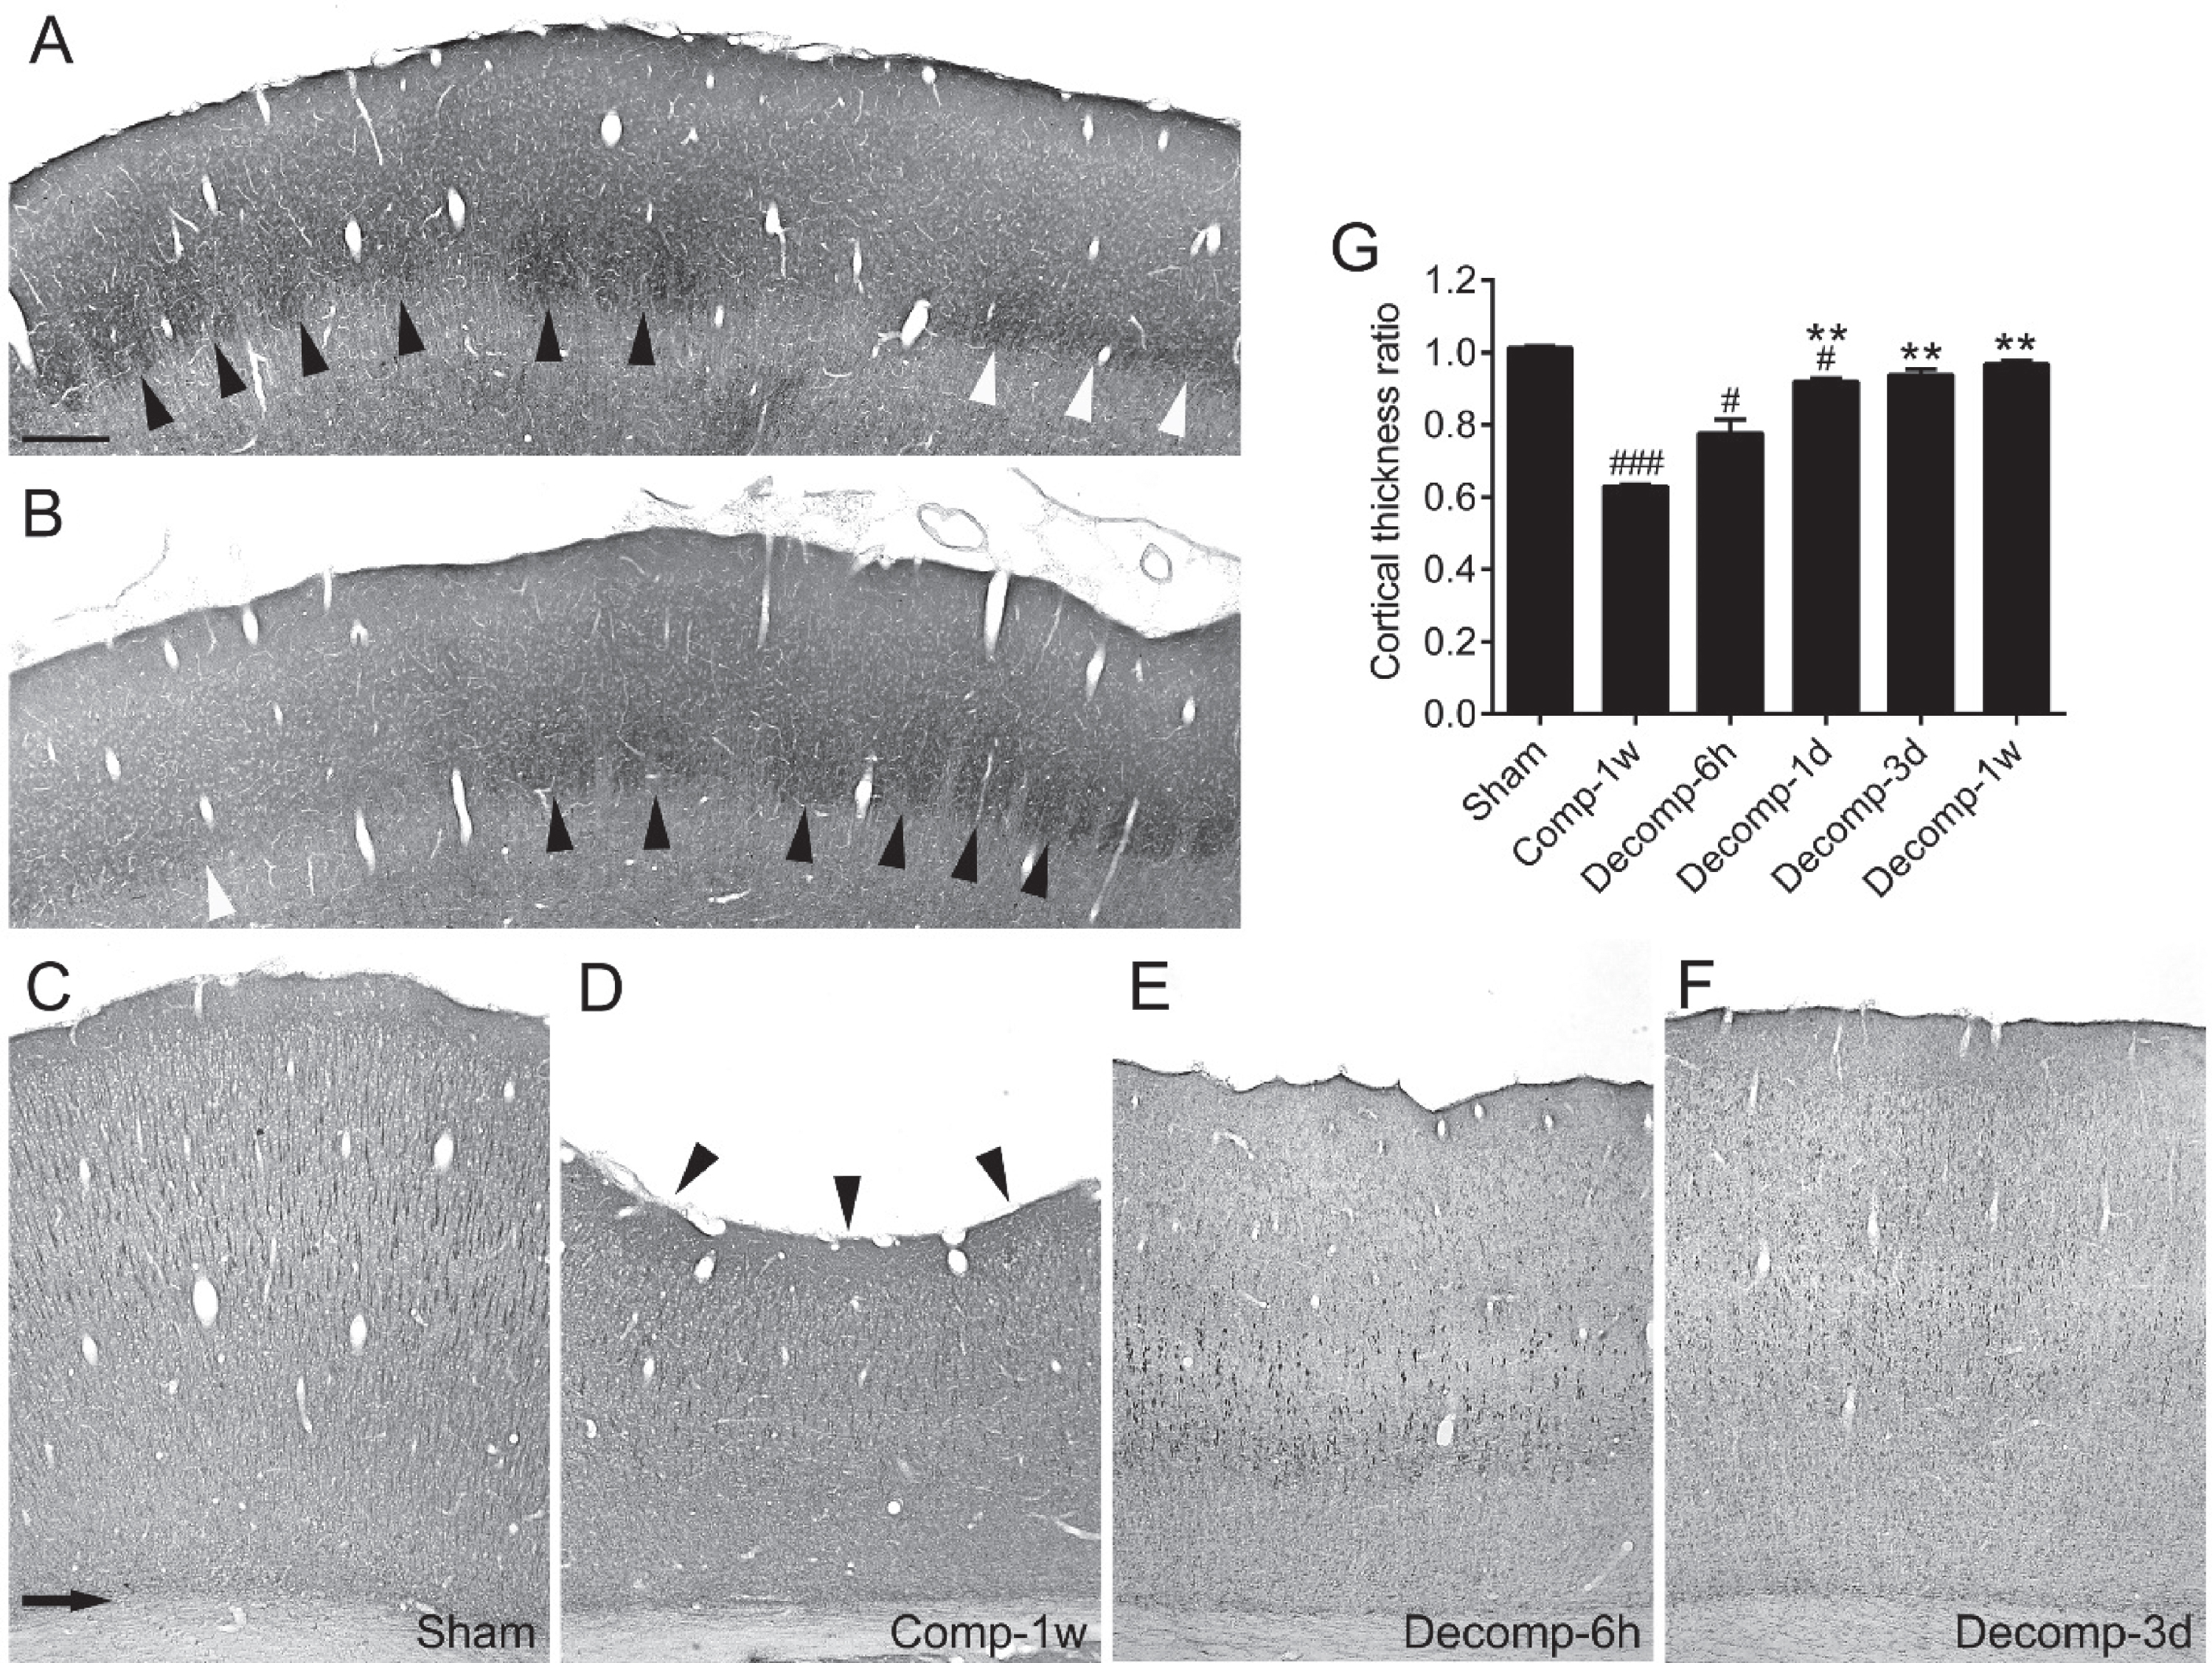
Verification of compression site and time-dependent changes in thickness of primary somatosensory cortices after epidural decompression. (A and B) Photomicrographs from a coronal section of the primary somatosensory cortex processed with cytochrome oxidase reaction. A and B show the contralateral (left) and the decompressed (right) cortices respectively from a representative rat at 3 days after epidural decompression. The black arrowheads indicate the barrels in the face area of cortex. The layer IV of the forelimb and hindlimb area (white arrowheads) is also discernible. (C–F) The sections were processed with anti-MAP2 immunolabeling. The arrow in C indicates the demarcation between the cortex and the underlying white matter in a sham-operated rat. At 1 week after compression (Comp-1w), the concave surface (arrowheads in D) of cortex manifests a marked decrease of cortical thickness. The cortical thickness gradually recovered at 6 hours (E) and 3 days (F) after decompression. G shows time-dependent changes in the cortical thickness ratios. Abbreviations: (h) hour; (d) day; (w) week, n = 6 per group. # P < 0.05, ### P < 0.001, compared with the sham group; ** P < 0.01, compared with the Comp-1w group. Scale bar = 300μm (A and B) or 275μm (C–F).
We then measured the thickness of cortex using anti-MAP2 immunolabeled sections. The average thickness of the primary somatosensory cortices of the sham-operated rats is 2114.49±6.75μm (Fig. 1C). In contrast, epidural compression for 1 week caused a concave surface (Fig. 1D, arrowheads) of the primary somatosensory cortex and the thickness of cortex exhibited a significant reduction of approximately 40% (compare C with D). After decompression, the cortex gradually regained its thickness over time (Fig. 1E–G). The rats showed markedly improved thickness of cortex within the first 24 hours, and became comparable to the sham group at 3 days after decompression (Fig. 1G).
We used alkaline phosphatase histochemistry to stain the cortical microvessels in the primary somatosensory cortex (Fig. S1A, B) and evaluated the morphological alterations of microvessels after epidural decompression. These experiments were primarily motivated by our previous study demonstrating a decrease of the mean diameter ratio and the mean area ratio of the microvessels, and a rapid return to the sham level at 1 week after epidural compression (Lin et al., 2010). In contrast, we found that both ratios in cortical layers I–IV and layers V–VI at any given time point after decompression had no significant difference compared with 1 week after compression (Fig. S1C, D). We further examined whether epidural decompression leads to cerebral infarct. Similar to 1 week after compression (Fig. S1E), no ischemic lesion was discernible at 6 hours, 1 day, and 3 days after decompression (Fig. S1F–H).
Permeability of BBB
We next investigated whether and to what extent epidural decompression affects the BBB permeability of cortical microvessels. We previously reported that the endogenous IgG extravasation is drastic at 1 day but rapidly restored at 1 week after epidural compression (Lin et al., 2010). In the present study, after decompression, IgG leakage into the brain parenchyma started at 6 hours (P < 0.05) and soon reached a maximum at 1 day (P < 0.001). Nevertheless, this pathological alteration rapidly declined at 3 days (P < 0.001) after decompression (Fig. 2A–E).
The Evans Blue extravasation technique was also performed for measurement of the BBB permeability. In the sham group animals, no Evans Blue extravasation was detected in the cerebral cortices; however, the pineal body which is devoid of the BBB was stained by Evans Blue (Fig. 2F, arrowhead). As shown in our previous study (Lin et al., 2010), Evans Blue extravasation was observed starting at 1 day, peaking at 3 days, but apparently decreasing at 1 week after epidural compression. In the present study, after decompression, Evans Blue leakage into the cortical parenchyma soon reached a maximum at 6 hours (P < 0.001) (Fig. 2G, H). However, this phenomenon rapidly waned at 12 hours and the remaining time points (P < 0.001) after decompression (Fig. 2I–L). Our evidence indicates that epidural decompression exerted a significant but short-lasting impact on the BBB permeability of cortical microvessels.
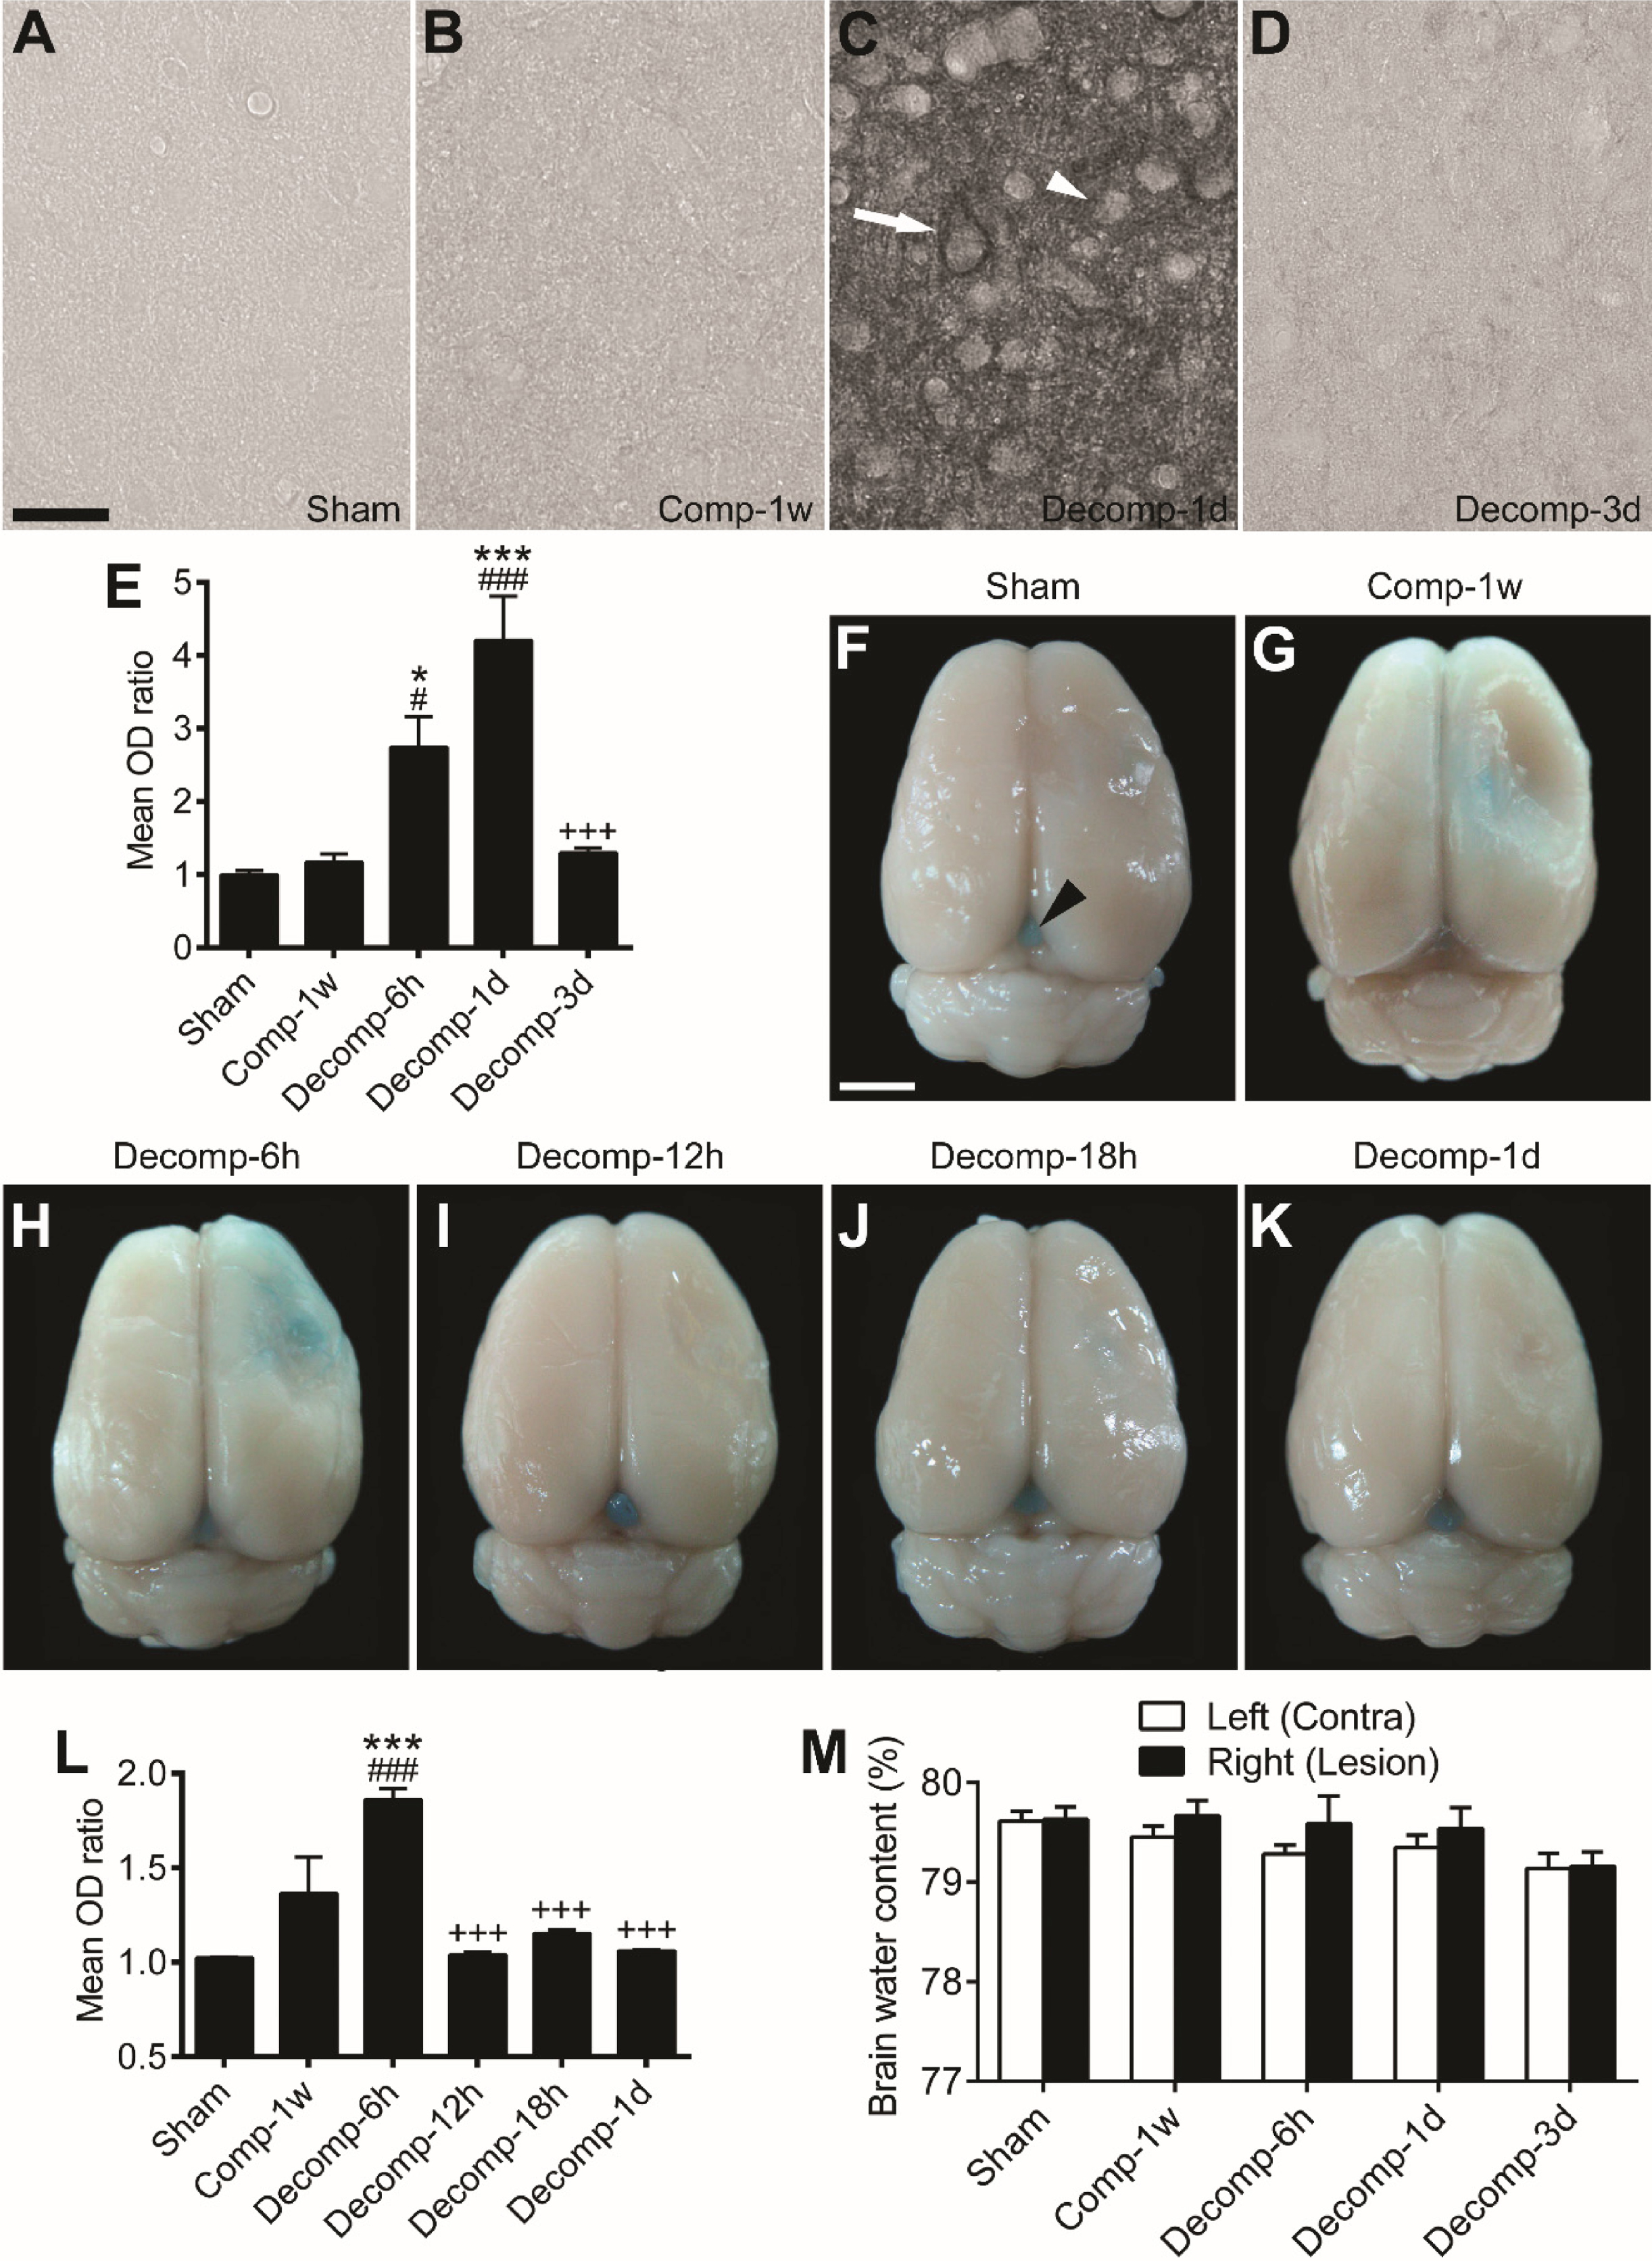
Endogenous IgG extravasation, Evans Blue extravasation, and brain water content after epidural decompression. (A–D) Representative endogenous IgG stained images of primary somatosensory cortices from a sham-operated rat (A), a 1 week-compressed rat (B), a 1 day-decompressed rat (C), and a 3 day-decompressed rat (D). At 1 day (C), the immunoreactivity of IgG was also moderately (arrowhead) or intensely (arrow) expressed in the cytoplasm of neurons. (E) Time-dependent changes in the mean OD ratios of IgG immunoreactivity after decompression. Abbreviations: (h) hour; (d) day; (w) week. (F–K) Representative whole brains from different animal groups receiving Evans Blue perfusion. In the sham-operated animal (F), no Evans Blue was seen in the brain tissue except the pineal gland (arrowhead). At 1 week after compression (G), there was still a little residual Evans Blue in the cortex. Note that after decompression, Evans Blue leakage into cortical parenchyma was drastically increased at 6 hours (H) but restored during 12 hours to 1 day (I–K). (L) Time-dependent changes in the mean OD ratios of extravasated Evans Blue after decompression. (M) The brain water content in left or right cerebral hemisphere of sham-operated rats was 79–80%. No statistical significance was detected between groups. (E and L) n = 6 per group. # P < 0.05, ### P < 0.001, compared with the sham group; * P < 0.05, *** P < 0.001, compared with the Comp-1w group;+++ P < 0.001, compared with the Decomp-1d group (E) or the Decomp-6h group (L). Scale bars = 25μm (A–D) and 5 mm (F–K).
We further explored whether the decompression-induced transient BBB disruption could cause brain edema. We found that the brain water content in the sham group animals was 79–80% (Fig. 2M). The decompression groups were comparable in brain water content to the sham group and the 1-week compression group. These results suggest that none of the rats utilized herein suffered brain edema after epidural decompression.
Astrocytes are a central component of the BBB. By utilizing an approach of combined alkaline phosphatase histochemistry and anti-GFAP immunolabeling, the cortical microvessels and the astrocytes were revealed in the same section. As shown in our previous study (Lin et al., 2010), the astrocytic coverage on cortical microvessels was significantly increased only at 1 day but rapidly decreased at 1 week after epidural compression. In the present study, after decompression, immunolabeling exhibited an abrupt elevation of astrocytic reaction and coverage on the cortical microvessels at 6 hours but an apparent decrease during 1 to 3 days (Fig. S2).
Dendrites of spiny stellate neurons
We next examined the neuronal dendritic plasticity after epidural decompression. The Golgi-Cox-stained spiny stellate neurons were identifiable by their location in cortical layer IV and their radial pattern of spiny dendrites (Yeh et al., 2017). The camera lucida drawings showed that compared to sham-operation (Fig. 3A, B), epidural compression for 1 week resulted in evident shrinkage of the dendritic arbor of the spiny stellate neuron (Fig. 3C). Furthermore, compared to 1 week after compression, the dendritic arbors seemed to be unaltered at 1 day, 3 days, and 1 week after decompression (compare Fig. 3D–F with C). However, partial recovery of the dendritic arbors appeared to occur after decompression over 2 weeks to 3 months (Fig. 3G–I).

Effects of epidural decompression on dendrites of spiny stellate neurons in primary somatosensory cortices. A representative Golgi-Cox-stained spiny stellate neuron of a sham-operated rat is shown in the center of (A). This neuron was further illustrated in (B). The other representative neurons were illustrated from a rat which received epidural compression and survived for 1 week (C), and rats which received epidural decompression and survived for 1 day (D), 3 days (E), 1 week (F), 2 weeks (G), 1 month (H), and 3 months (I). The scale bar in (B) is also for (C–I).
The morphological alterations of the spiny stellate neurons were further quantified. We first analyzed the soma size (Fig. 4A) and the total dendritic length (Fig. 4B) of the spiny stellate neurons. Compared to the sham group, the neuron soma size was unaltered at 1 week after compression (Fig. 4A). The results are consistent with our earlier research (Yeh et al., 2017). After epidural decompression, no significant change of neuron soma size was found (Fig. 4A). On the contrary, epidural compression for 1 week dramatically attenuated the total dendritic length (Fig. 4B). After decompression, the total dendritic length was not restored during 1 day to 1 week but markedly increased at 2 weeks, 1 and 3 months (Fig. 4B). Taken together, these data provide evidence that epidural decompression for a longer period could partially restore the total dendritic length of the spiny stellate neurons.

Analyses of somata and dendrites of spiny stellate neurons in primary somatosensory cortices after epidural decompression. (A and B) Time-dependent changes in the soma size and the total dendritic length of the spiny stellate neurons after decompression. Abbreviations: (d) day; (w) week; (m) month. n = 6 per group. * P < 0.05, *** P < 0.001, compared with the sham group; # P < 0.05, compared with the compression for 1 week group (Comp-1w). (C) A representative drawing of a spiny stellate neuron for dendritic orientation analysis. The blue lines were depicted from the neuron soma center to each dendritic tip. Abbreviations: (RUQ) right upper quadrant; (LUQ) left upper quadrant; (RLQ) right lower quadrant; (LLQ) left lower quadrant. (D) The percentage was calculated as follows: the number of lines in a quadrant / the total number of lines in all four quadrants. (A and D) No statistical significance was detected in the soma size and the dendritic orientation analyses.
We next investigated the effect of epidural decompression on the dendritic orientation of the spiny stellate neurons. The lines from the neuron soma center to each dendritic tip were depicted (Fig. 4C, blue lines). The lines in each quadrant were counted using the surface of cortex as a horizontal reference (Yeh et al., 2017). In case of a line lying between two quadrants, 0.5 was given to each of the two quadrants. The results were analyzed in percentage terms. There were no differences between animal groups (Fig. 4D), indicating that the spiny stellate neurons did not manifest significant deficits in dendritic orientation after epidural decompression.
To investigate the complexity of dendritic branches of the spiny stellate neurons, the number of crossings of dendritic branches with each concentric 20μm ring from the neuron soma center was counted (Fig. 5A, Scholl ring analysis). The number at the distance between 0 and 20μm is the number of the main dendritic trunks emanating from the neuron soma (Fig. 5B–H). We found that compared to the sham group, the numbers of crossings occurring at the 40- to 80-μm distance from the neuron soma center were significantly reduced at 1 week after compression (Fig. 5B, P < 0.05 or P < 0.001). After decompression, the numbers of crossings were unaffected during 1 day to 1 week (Fig. 5C–E) but significantly recovered during 2 weeks to 3 months (Fig. 5F–H). The numbers of crossings at the 40- to 60-μm distance from the soma center were conspicuously enhanced, as well as the number of the main dendritic trunks emanating from the neuron soma (Fig. 5F–H). Together, these data indicate that the complexity of dendritic branches of the spiny stellate neurons exhibited significant recovery during 2 weeks to 3 months after decompression.

Scholl ring analyses of spiny stellate neurons in primary somatosensory cortices after epidural decompression. (A) A representative drawing of a spiny stellate neuron for Scholl ring analysis. (B–H) Distance-dependent changes of the number of crossings of dendritic branches with each concentric 20μm ring from the neuron soma center. The number at the distance between 0 and 20μm is the number of the main dendritic trunks emanating from the neuron soma. Abbreviations: (d) day; (w) week; (m) month. n = 6 per group. * P < 0.05, ** P < 0.01, *** P < 0.001, compared with the corresponding number of crossings from another animal group, two-way ANOVA followed by Sidak post hoc test.
To further explore the impact of epidural decompression on the fine structures of dendrites of the spiny stellate neurons, we next analyzed the density of dendritic spines on their secondary dendritic segments (Yeh et al., 2017). We found that compared to the sham group, sustained epidural compression for 1 week significantly decreased the spine density about 63% (Fig. 6, P < 0.001), consistent with the finding in our earlier study (Yeh et al., 2017). After decompression, the density of dendritic spines was not restored during 1 day to 1 week but significantly increased at 2 weeks, 1 and 3 months (Fig. 6). Together, these results provide clear evidence on the regrowth of dendritic spines of the spiny stellate neurons after a longer period of epidural decompression.

Dendritic spine densities of spiny stellate neurons in primary somatosensory cortices after epidural decompression. (A) Photomicrographs of the secondary dendritic segments of the spiny stellate neurons were acquired from a sham-operated rat, a rat which received epidural compression for 1 week (Comp-1w), and rats surviving for 1 day, 3 days, 1 week, 2 weeks, 1 month, and 3 months after decompression (Decomp). (B) The density of dendritic spines is the number of spines per 10μm of the secondary dendritic segment. Abbreviations: (d) day; (w) week; (m) month. n = 6 per group. *** P < 0.001, compared with the sham group; # P < 0.05, compared with the Comp-1w group.
To evaluate the distribution of TCA fibers in the primary somatosensory cortex, the anterograde tracer BDA was applied into the VPM nucleus of thalamus (Yeh et al., 2017). The TCA fibers were stained brown and the neuronal somata were counterstained blue-gray (Fig. 7). In the sham group, the TCA fibers were elaborately distributed within the barrel field (Fig. 7A). Quantitative analysis revealed that 1-week epidural compression caused a substantial reduction of the TCA fiber density ratio by approximately 54%, compared to the sham group (Fig. 7A, B, I). After decompression, the TCA fiber density ratio was not restored during 1 day to 1 week (Fig. 7C–E, I) but markedly elevated at 2 weeks, 1 and 3 months (Fig. 7F–I). Together, these data indicate that epidural decompression for a longer period could partially recover the TCA fiber density in the primary somatosensory cortex.
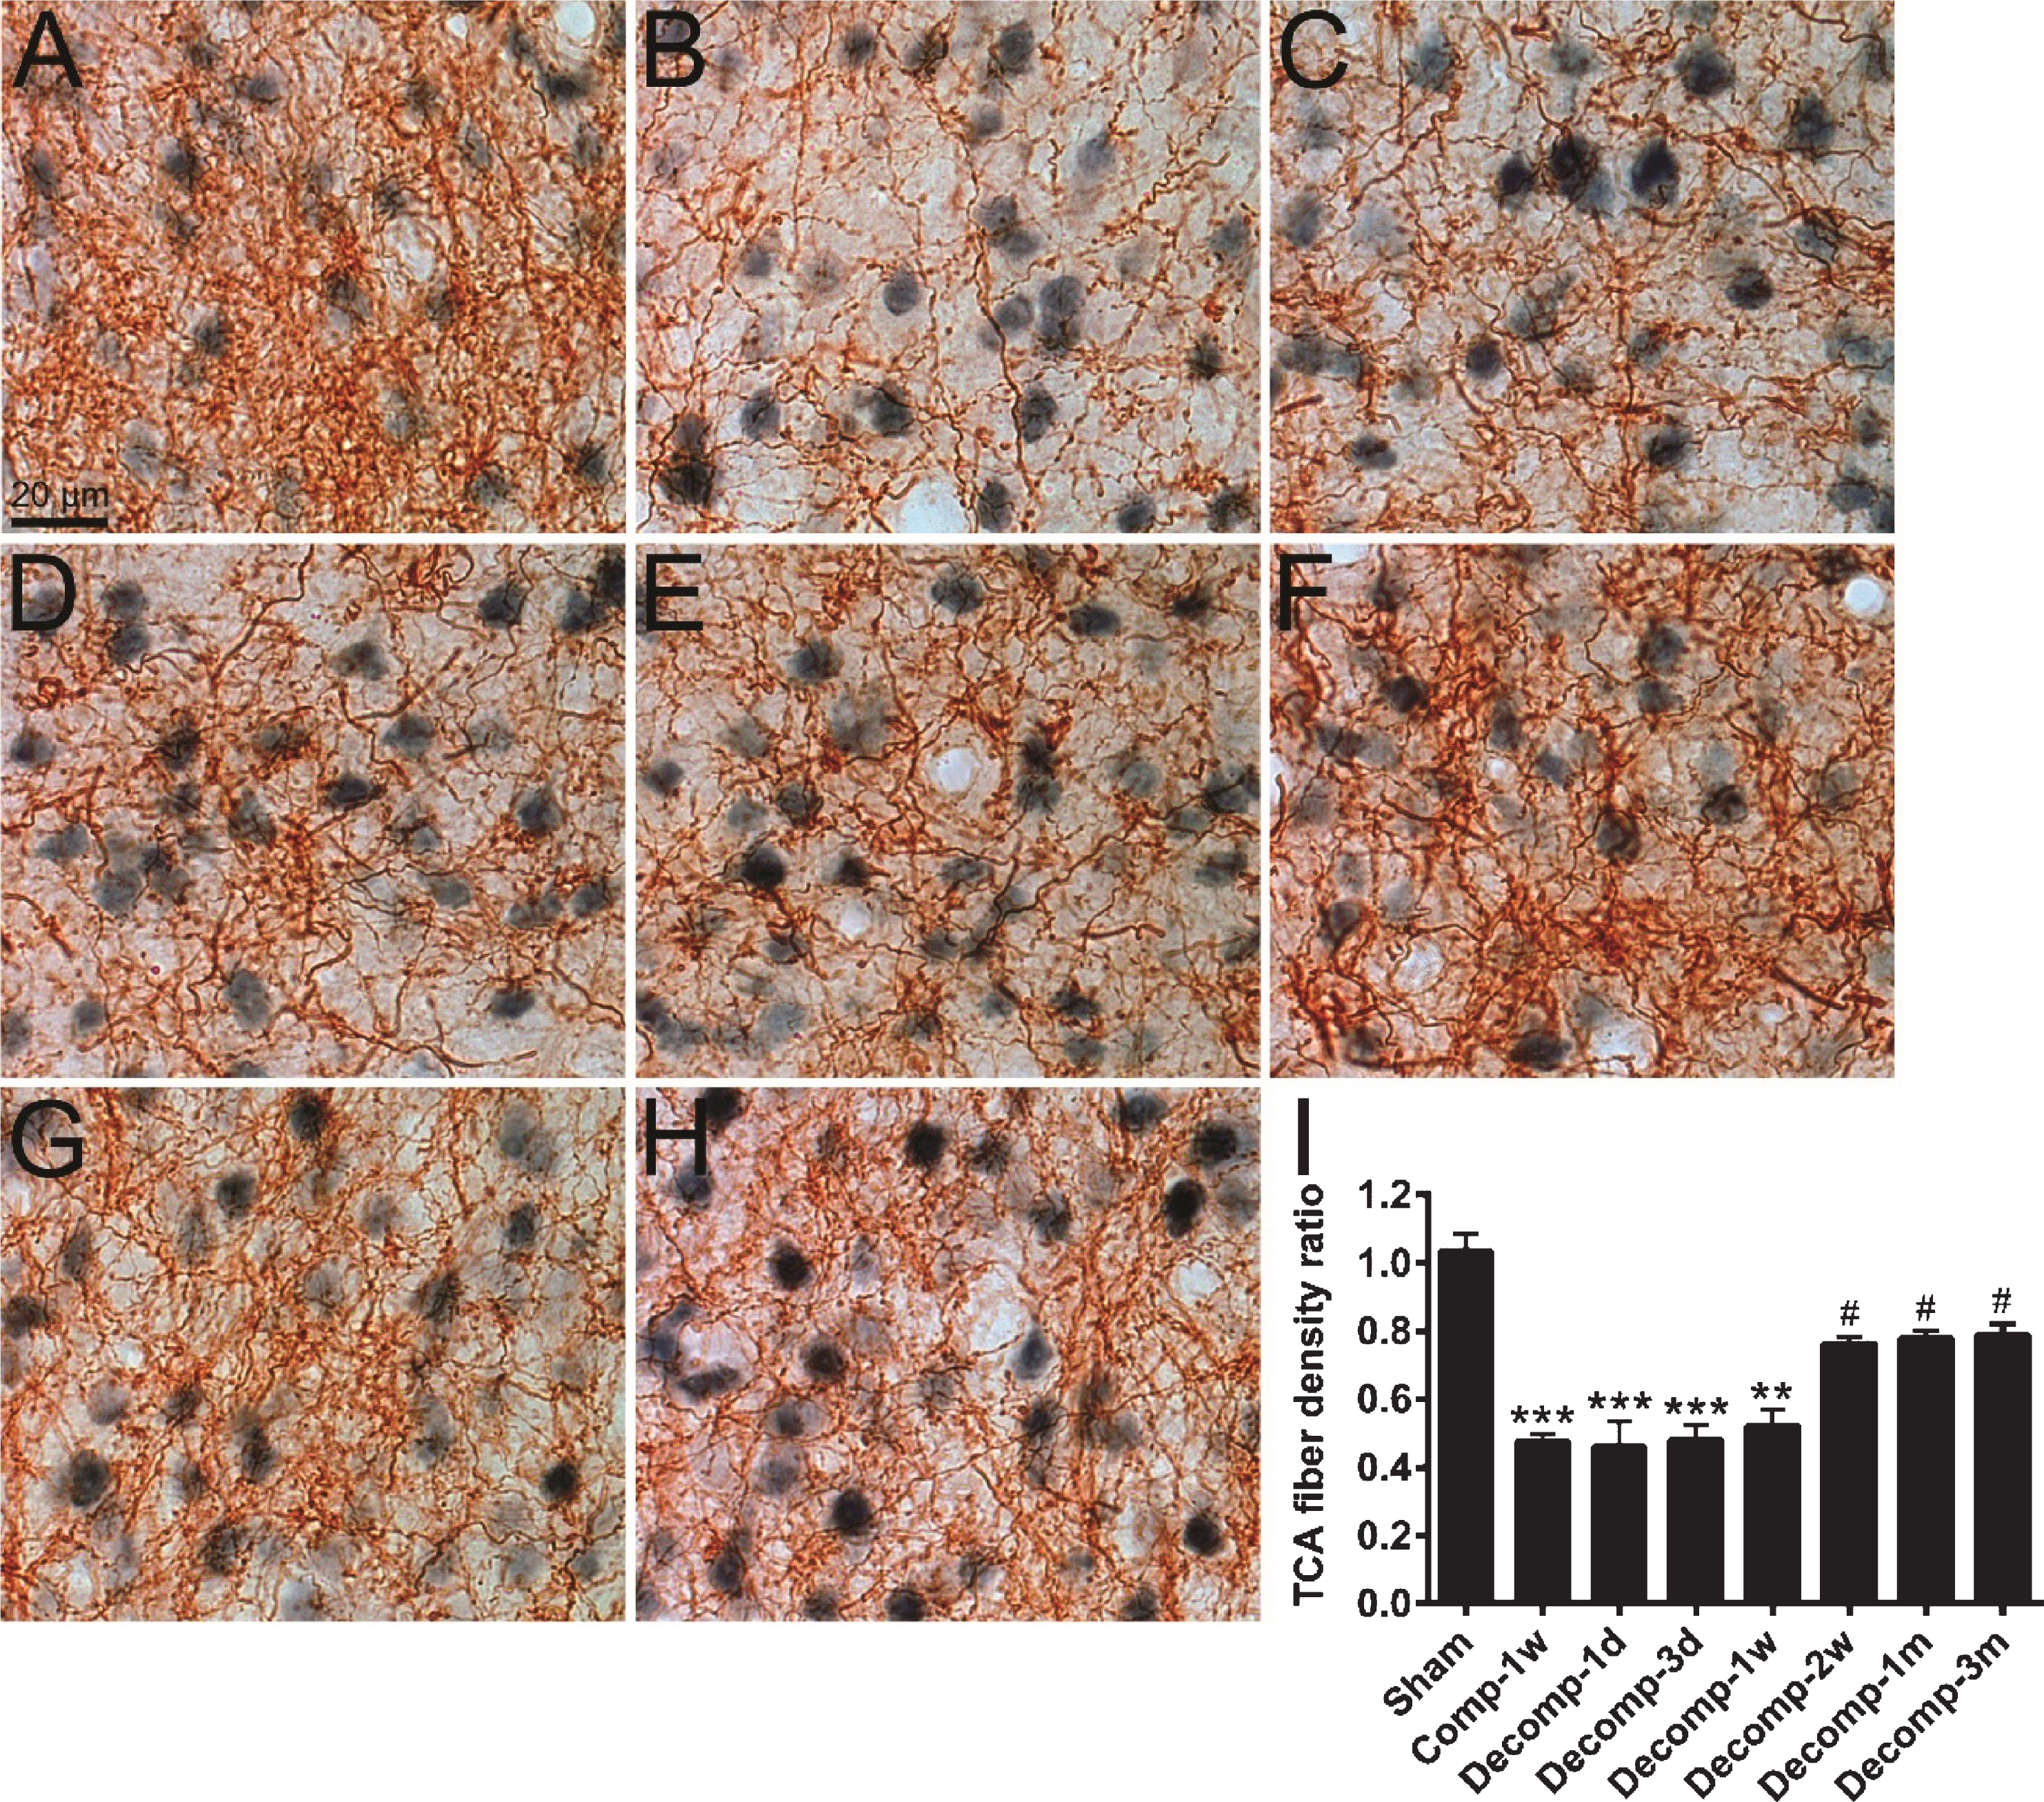
Distribution of thalamocortical afferent (TCA) fibers in primary somatosensory cortices after epidural decompression. (A–H) The BDA-filled TCA fibers (brown) were stained with DAB chromogen and the neuron cell bodies (blue-gray) were counterstained with anti-NeuN immunolabeling. Photomicrographs show the TCA fibers in barrels of the right primary somatosensory cortices of a sham-operated rat (A), a rat which received epidural compression for 1 week (Comp-1w; B), and rats surviving for 1 day (Decomp-1d; C), 3 days (D), 1 week (E), 2 weeks (F), 1 month (G), and 3 months (H) after decompression. (I) Time-dependent changes in TCA fiber density ratios after decompression. Abbreviations: (d) day; (w) week; (m) month. n = 6 per group. ** P < 0.01, *** P < 0.001, compared with the sham group; # P < 0.05, compared with the Comp-1w group.
In animal experiments, cerebral compression has been performed using various tools, such as balloon, Plexiglas piston, brass cylinder, and plastic cylinder (Abe et al., 1984; Burnett et al., 2005; Kundrotiene et al., 2002; Watanabe et al., 2001). These tools can ensure only short-lasting compression to induce a reduction in cerebral blood flow or an increase of intracranial pressure. In contrast, the bead used in the present study could exert long-term and sustained cerebral compression on the animals moving freely. However, our compression tool has several limitations. First, the beads are in uniform contour and size, thus unable to mimic the various size and shape of hematoma in clinical context. Second, the beads are made of plastic which is different from the components of hematoma. Third, the beads were implanted in the epidural space, which can not simulate intracerebral or subdural hematoma of patients.
To our knowledge, the present study for the first time showed the effects of epidural decompression of the primary somatosensory cortex on the cortical microvessels, spiny stellate neurons, and TCA fibers. First this study demonstrates that epidural decompression could facilitate recovery of the thickness of 1-week compressed primary somatosensory cortex. However, the thickness of cortex did not reach the level of the sham group until 3 days after decompression. Accordingly, the thickness of cortex was still changing at 6 hours and 1 day after decompression, leading to a short-term disruption of the BBB and increase of the astrcytic reaction and coverage on the cortical microvessels at this time. In contrast, the neuronal plasticity, including the recoveries of the dendrites and spines of the spiny stellate neurons and the TCA fibers, was initially observed at 2 weeks after decompression. This suggests that the neuronal plasticity was a slow onset event in response to epidural decompression. Collectively, epidural decompression caused a two-stage effect, including an earlier stage involving cortical microvessels and a later one associated with neuronal plasticity.
In the current study, we used two methods to evaluate the BBB permeability. As shown in Fig. 2E, the IgG labeling increased at 6 hours, peaked at 1 day, but nearly disappeared at 3 days after decompression. On the contrary, the labeling of Evans Blue which can bind serum albumin rapidly increased at 6 hours but vanished at 12 hours after decompression (Fig. 2L). Like that observed in earlier studies (Hallene et al., 2006; Orr et al., 2005; Rigau et al., 2007), the extravasated IgGs were labeled not only in the neuropil but also in the neuronal cytoplasm in the present study (Fig. 2C). This may lead to longer time for clearance of IgG than Evans Blue from cortical tissue, resulting in the accumulation of IgG until 1 day after decompression. However, the BBB integrity was completely restored before 3 days post-decompression as demonstrated by the observation that both serum proteins were removed at this time.
We have previously shown that at 1 day after epidural compression, the mean diameter ratio and the mean area ratio of the cortical microvessels are transiently reduced in both cortical layers I–IV and V–VI (Lin et al., 2010). In contrast, the present study shows that epidural decompression did not cause significant change of both ratios in layers I–IV and V–VI. This may be explained by the finding that the cortex slowly (for at least 3 days) regained its thickness after decompression, thus minimizing the physical effect of decompression on the morphology of the cortical microvessels. Additionally, our previous study revealed a dramatic increase of the BBB permeability during 1 to 3 days after epidural compression (Lin et al., 2010). Similarly, the present study showed a transient disruption of the BBB in the early period (6 hours to 1 day) after decompression and this was accompanied by an increase of the astrocytic reaction and coverage on the cortical microvessels. Earlier study suggested the crucial role of hypertrophied astrocytic processes with water channel protein aquaporin-4 in retarding vasogenic edema caused by the BBB breakdown (Tomas-Camardiel et al., 2005). Moreover, astrocytes are known to elicit the increase of expression of tight junction proteins in endothelial cells, and hence maintaining the integrity of the BBB (Colgan et al., 2008). Accordingly, it is evident that the increased astrocytic reaction during 6 hours to 1 day after decompression in the present study can prevent the brain edema in spite of a transient disruption of the BBB. Taken together, in our animal model, both epidural compression and decompression gave rise to only short-lasting effects on the BBB and did not result in brain edema.
In cerebral cortex, claudin and occludin are abundant tight junction proteins essential for linkage between microvascular endothelial cells and thus block the paracellular diffusion (Furuse et al., 1993; Furuse et al., 1998). Numerous studies have consistently shown that the machinery of the BBB is highly regulated by phosphorylation (Andras et al., 2007; Haorah et al., 2007; Rochfort et al., 2015; Yamamoto et al., 2008) and ubiquitination (Leclair et al., 2016; Mandel et al., 2012; Murakami et al., 2009; Traweger et al., 2002) of tight junction proteins. The central function of these two protein modifications is to mediate the intracellular trafficking and redistribution of tight junction proteins between the cell membrane and the cytoplasmic fraction of the endothelial cells (Farshori & Kachar, 1999; Inamura et al., 2013; Stamatovic et al., 2006). We recently found that epidural compression elevated the phosphorylation and ubiquitination of claudin-5 both in the cytosol and the membrane fractions (unpublished). Altogether, these findings suggest that the intracellular trafficking and redistribution of tight junction proteins may be implicated in the rapid compromise and reverse of the BBB after epidural decompression.
Our recent work demonstrated that epidural compression causes marked shrinkage of the dendritic arbors and stripping of the dendritic spines of cortical layer IV spiny stellate neurons for at least 3 months (Yeh et al., 2017). Compression is also associated with extensive axonal retraction, reflected in the progressive decline of TCA fiber density in the cortex for 6 months (Yeh et al., 2017). In the present study, surgical decompression with preceding 1-week compression partially reversed these deficits starting at 2 weeks. These findings indicate that decompression effectively ameliorate the compression-induced pathological alterations of dendrites of the spiny stellate neurons and the TCA fibers. It is worth noting that epidural decompression for 2 weeks also restores the total dendritic length of cortical layer III and V pyramidal neurons (Chen et al., 2004). However, decompression is unable to reverse the loss of dendritic spines of the pyramidal neurons caused by compression (Chen et al., 2004). Collectively, the total dendritic lengths of both the spiny stellate neurons and the pyramidal neurons are recoverable after epidural decompression; however, the dendritic spines of the spiny stellate neurons (in the present study) appear more resilient compared to the pyramidal neurons (Chen et al., 2004). Moreover, enhanced dendritic spine density of the spiny stellate neurons was strongly correlated with increased TCA fiber density ratio in a similar temporal pattern after decompression as shown in the current study. This raises a possibility that epidural decompression evoked the return of TCA fibers to the cortex and may thus elicit the regrowth of dendritic spines of the spiny stellate neurons, whereas decompression may not reverse the loss of basal forebrain cholinergic fibers in the cortex and is therefore unable to restore the dendritic spines of the pyramidal neurons. This deduction is also supported by the findings that traumatic brain injury results in a loss of cholinergic neurons in the basal forebrain and their presynaptic terminals in the cortex (Jorgensen et al., 1997; Murdoch et al., 1998; Schmidt & Grady, 1995). Furthermore, depletion of cholinergic function in the basal forebrain completely abolishes the cortical plasticity needed to mediate functional recovery after brain injury (Conner et al., 2005). Conversely, inhibition of acetylcholinesterase elicits an increase in the dendritic length and spine density of cortical neurons (Alcantara-Gonzalez et al., 2012). In agreement with this, application of nerve growth factor can stimulate sprouting of basal forebrain cholinergic fibers (Burgos et al., 1995; Heisenberg et al., 1994; Kordower et al., 1994) which was proposed to be the key inducement to regrowth of the dendritic spines of the pyramidal neurons (Chen et al., 2004). Overall, the fact of differential dendritic spine recoverabilities of the spiny stellate neurons and the pyramidal neurons after decompression provides a new perspective on the plasticity discrepancy between these two populations of neurons. We surmised that comparing and contrasting the essential difference of their plasticity may provide insight into the clinical therapeutic strategies at the cellular level.
Epidural hematoma is a common traumatic lesion in patients with closed head injuries. Rapid spontaneous resolution of an acute epidural hematoma is rarely observed in clinical practice (Aydemir et al., 2016; Eom et al., 2009). Nevertheless, sensory impairment is seen only in initial several days after sustained epidural compression on the primary somatosensory cortex, demonstrated by the von Frey behavioral test and the electrophysiological method (Lin et al., 2010). Consistently, the somatosensory asymmetry test and the vibrissae-evoked forelimb placing test showed similar results (Yang et al., 2006). These findings indicate that sensory impairment spontaneously resolves in spite of a structural disruption of thalamocortical connections caused by persistent epidural compression. Thus, surgical decompression seems to be unnecessary to the restoration of somatosensory deficit. However, the thalamic VPM nuclei of patients receive various sensory modalities such as touch, pressure, pain, and temperature. Thus, sensory deficits might be underestimated in clinical practice. The composition of the affected somatosensory modalities of patients with epidural compression and/or decompression needs to be characterized in future investigations. In addition, the fact that the somatosensory cortex plays a very important role in higher-order coordinated functions such as sensory-motor coordination (Ferezou et al., 2007; Johansson & Cole, 1992) and physical and cognitive functions (Dobkin, 1991; Gallace & Spence, 2009) reinforces the importance of structural restoration of the thalamocortical connections. The present study demonstrated that epidural decompression could confer a significant but only partial recovery in the dendrites of the stellate neurons and in the distribution of the TCA fibers. Thus, further research in pursuit of complete restoration of the thalamocortical connections after epidural decompression is still needed.
In conclusion, although epidural decompression caused a breakdown of the BBB, this event was early-occurring, short-lasting, and not leading to brain edema. In contrast, epidural decompression facilitated a marked recovery of the TCA fiber distribution in barrels, as well as the dendrites and spines of the spiny stellate neurons.