
Abstract
Background:
Peripheral nerve injury (PNI) is the most common type of nerve trauma yet, while injured motoneurons exhibit a robust capacity for regeneration, behavioral recovery is protracted and typically poor. Neurotherapeutic approaches to PNI and repair have primarily focused on the enhancement of axonal regeneration, in terms of rate, axonal sprouting, and reconnection connectivity. Both electrical stimulation (ES) and treatment with androgens [e.g., testosterone propionate (TP)] have been demonstrated to enhance axonal sprouting, regeneration rate and functional recovery following PNI. To date, very little work has been done to examine the effects of ES and/or TP on dendritic morphology and organization within the spinal cord after PNI.
Objective:
The objective of the current study was to examine the impact of treatment with TP and ES, alone or in combination, on the dendritic arbor of spinal motoneurons after target disconnection via sciatic nerve crush injury in the rat.
Methods:
Rats received a crush injury to the sciatic nerve. Following injury, some animals received either (1) no further treatment beyond implantation with empty Silastic capsules, (2) electrical nerve stimulation immediately after injury, (3) implantation with Silastic capsules filled with TP, or (4) electrical nerve stimulation immediately after injury as well as implantation with TP. All of these groups of axotomized animals also received bi-weekly electromyography (EMG) testing. Additional groups of intact untreated animals as well as a group of injured animals who received no further treatment or EMG testing were also included. Eight weeks after injury, motoneurons innervating the anterior tibialis muscle were labeled with cholera toxin-conjugated horseradish peroxidase, and dendritic arbors were reconstructed in three dimensions.
Results:
After nerve crush and ES and/or TP treatment, motoneurons innervating the anterior tibialis underwent marked dendritic hypertrophy. Surprisingly, this dendritic hypertrophy occurred in all animals receiving repeated bi-weekly EMG testing, regardless of treatment. When the EMG testing was eliminated, the dendritic arbor extent and distribution after nerve crush in the treated groups did not significantly differ from intact untreated animals.
Conclusions:
The ability of repeated EMG testing to so dramatically affect central plasticity following a peripheral nerve injury was unexpected. It was also unexpected that gonadal steroid hormones and/or ES, two neurotherapeutic approaches with demonstrated molecular/behavioral changes consistent with peripheral improvements in axonal repair and target reconnection, do not appear to impact central plasticity in a similar manner. The significance of peripheral EMG testing and resulting central plasticity reorganization remains to be determined.
Introduction
Following peripheral nerve damage, disconnected distal axonal segments undergo obligatory Wallerian degeneration within days of injury (Brushart, 2011). As has been well-documented by our work and others, gonadal steroid hormones and electrical stimulation (ES), alone or in combination, have been shown to accelerate functional recovery following peripheral nerve injury (PNI) in rodent models (Sharma et al., 2010). Based upon that literature, both gonadal steroid hormones and ES have potential as neurotherapeutics in a number of clinically relevant PNI situations (Lal et al., 2008). The primary focus on gonadal steroid hormones and/or ES enhancement of functional recovery after PNI has been on elucidation of the underlying mechanisms associated with axonal regeneration. With regard to successful axonal regeneration and reconnection to target muscle, key elements underlying functional recovery include shortening in the delay time before axonal sprouting begins and/or acceleration in the rate of regeneration after PNI (Kujawa & Jones, 1995). Numerous studies have demonstrated that the gonadal steroid, testosterone propionate (TP), significantly accelerates axonal regeneration rates through increased expression of axonal cytoskeletal components (Jones et al., 1999). Interestingly, Sharma et al. (2009a; 2009b) examined gonadal steroid hormones vs. ES as neurotherapeutics in PNI and discovered that there were differential effects of both treatments after injury. ES specifically affected only axonal sprouting initiation, but not axonal regeneration rates, whereas, TP, had the opposite effect by accelerating axonal regeneration rates but not sprouting. In exploring underlying mechanisms to explain the selective actions of gonadal steroid hormones and ES on PNI and repair, Sharma et al. (2009b) discovered differential molecular consequences complementary to the effects of either or both treatments on axonal regeneration.
The studies cited above focused on treatments for axonal regeneration following axotomy. Following peripheral axotomy, motoneuron somata and dendrites also show a variety of structural, functional, and biochemical changes (Grafstein & McQuarrie, 1978; Titmus & Faber, 1990; Bisby & Tetzlaff, 1992). For example, after axotomy synaptic inputs are withdrawn from the somata and proximal dendrites of the affected motoneurons (Alvarez et al., 2011; Blinzinger & Kreutzberg, 1968; Rotterman et al., 2014; Wiberg et al., 2017). The loss of some of these synaptic inputs is reversed upon muscle reinnervation (Alvarez et al., 2011), but other synaptic inputs, particularly those of Ia afferent neurons innervating muscle spindles, are permanently lost (Alvarez et al., 2011; Rotterman et al., 2014). Axotomy also results in changes in the electrophysiological properties of motoneuron dendrites, for example giving rise to novel sodium-dependent partial spikes (Sernagor et al., 1986). Morphologically, 10 months after distal sciatic nerve crush, motoneurons ipsilateral to the injury had thicker proximal dendrites, which sometimes abruptly tapered (Bowe et al., 1992). In addition, nerve crush (O’Hanlon & Lowrie, 1995) or transection (Wiberg et al., 2017) causes motoneuron dendritic retraction. Permanent axotomy of gastrocnemius motoneurons reduces dendritic diameter within 3 weeks, and dramatically reduces dendritic membrane area and volume within 12 weeks (Brännström et al., 1992a). Disconnection of motoneurons from their target musculature is not required to induce dendritic retraction. For example, chemical blockade of functional contact between hypoglossal motoneurons and the tongue results in dendritic retraction (Sumner & Watson, 1971). The dendritic regressions that occur in motoneuron dendritic arbors after axotomy can be reversed upon muscle reinnervation (Sumner & Watson, 1971; Brännström et al., 1992b; O’Hanlon & Lowrie, 1995).
The objective of the current study was to examine impact of treatment with TP and ES, alone or in combination on the dendritic arbor of spinal motoneurons after target disconnection via crush injury. We report that following sciatic nerve crush and treatment with TP and ES, alone or in combination, motoneurons innervating the anterior tibialis underwent marked dendritic hypertrophy. Surprisingly, this dendritic hypertrophy was only present in animals who received repeated ES through bi-weekly EMG testing. We conclude that gonadal steroid hormones and/or ES, two neurotherapeutic approaches with demonstrated molecular/behavioral changes consistent with peripheral improvements in axonal repair and target reconnection, do not appear to impact central plasticity in a similar manner. Furthermore, repeated ES and resulting central plasticity may have negative consequences for functional recovery after peripheral nerve injury.
Methods
Subjects
All surgical procedures were reviewed and approved by the Indiana University School of Medicine Institutional Animal Care and Use Committee and were conducted in accordance with National Institute of Health guidelines. Adult male Wistar rats (175–199 g) were purchased from Harlan (Indianapolis, IN) and used for all experiments. All animals were maintained with a 12/12 h light/dark cycle with standard feed and water ad libitum.
To examine the potential effects of electrical stimulation or testosterone treatment, alone or in combination, on dendritic morphology following peripheral axotomy, animals received axotomies via crush injury to the sciatic nerve (see below). Following injury, some animals received either no further treatment beyond implantation with empty Silastic capsules (crush + blank; n = 5), or electrical nerve stimulation immediately after injury (crush + ES; n = 5), implantation with Silastic capsules filled with testosterone propionate (crush + TP; n = 5), or electrical nerve stimulation immediately after injury as well as implantation with Silastic capsules filled with testosterone propionate (crush + ES + TP; n = 5). All of these groups of axotomized animals also received bi-weekly electromyography (EMG) testing. Additional groups of intact untreated animals (n = 7) as well as a group of injured animals who received no further treatment or EMG testing [crush (no EMG)] were also included (n = 5; overall n = 32).
Axotomy
Surgeries were completed in a sterile, aseptic environment. Rats were anesthetized with 3% isoflurane gas with 1.5 L/min oxygen. The surgical site was shaven and cleaned. An incision approximately 2 cm in length was made on the dorsal surface of the right hip and the skin was retracted to expose the underlying musculature. Using blunt dissection, the heads of biceps femoris were separated to expose the sciatic nerve. The right sciatic nerve was crushed approximately 2 mm proximal to its trifurcation with Dumont forceps (#3). Two successive 30 second crushes from alternating directions were completed while leaving the epineurium intact. Visible loss of motor function in the right hind foot was used as confirmation to ensure a successful crush. After injury, the heads of biceps femoris were sutured together and the overlying skin closed with wound clips and coated with triple antibiotic ointment. Immediately after surgery, 0.025 mg/kg of buprenorphine was administered. Wound clips were removed 7–10 days post-axotomy.
Electrical stimulation
For animals receiving ES, immediately prior to the sciatic nerve crush injury a sterilized, flexible thin disk receiver (3 mm × 18 mm; Red Rock Laboratories, St. Louis, MI) was implanted subcutaneously on the rat’s dorsum, posterior to the scapulae. The receiver was attached to a Silastic nerve cuff (2 mm I.D., 8 mm length) via two, thin aluminum chloride or platinum insulated multi-conductor wires threaded under the skin through a sterile trocar to the right hip area. The cuff was gently wrapped around the sciatic nerve, proximal to the injury site, and sutured shut. The device remained in the animal for the length of the study. An Automated Functional Assessment Station (FASt; Red Rock Laboratories, St. Louis, MO, USA) was used to deliver ES via a wireless transducer placed above the subcutaneously implanted disk receiver. Immediately after axotomy, rats were stimulated at 20 Hz (200μs pulses, 1 V) continuously for 30 minutes.
Hormone administration
TP was administered through subcutaneous capsule implants. The capsules were made out of Silastic tubing 0.062 in. (1.57 mm) I.D. by 0.095 in (2.41 mm) O.D. and were 16 mm in total length, 10 mm of which contained 100% crystalline TP (Sigma-Aldrich, St. Louis, MO, USA). Wooden plugs sealed both ends of the capsule. As a control, animals receiving axotomy, but no treatment were implanted with blank capsules. Capsules were equilibrated in physiological saline for 30–60 minutes prior to implantation. Immediately following injury or ES, a subcutaneous pocket was formed by making an incision on the dorsal surface of the animal between the scapulae. Two TP capsules were implanted in the pocket and the wound site was closed with wound clips. Wound clips were removed 7–10 days post-axotomy. Capsules were left in the animals for the length of the study.
Electromyography recording
Rats were anesthetized with isofluorane and the FASt (Red Rock Laboratories) was used for EMG measurements. EMG responses were assessed prior to injury and immediately after, and functional recovery was monitored by taking recordings on day 1 and 5 of each week beginning immediately after injury for 8 consecutive weeks. Cathodic, monophasic electrical impulses (0.2 ms pulse duration, and 0 Hz) were generated using a single-channel isolated pulse stimulator (Model 2100, A-M Systems Inc., Carlsborg, WA, USA). For each recording trial a total of nine trials with an inter-trial delay of 10 seconds were acquired for each animal, with stimulus amplitude ranging from 0.35–4.24 V. Recordings were taken from lateral head of gastrocnemius and tibialis anterior muscles by placing 30 G needles into the belly of each muscle. Anode and cathode connector pins were attached to the needle probes, while a ground connector pin was attached to a 25 G needle placed subcutaneously on the back of the animal. Measurements were achieved using custom data acquisition software (RRL V.1.3, Red Rock Laboratories). Data was exported for analysis using MATLAB software (The Mathworks Inc., Natick, MA, USA) and is expressed as the maximal EMG amplitude (mV)±SEM. Three animals were removed from EMG analysis due to malfunctioning wireless electrodes.
Histological and histochemical processing
Eight weeks after injury, animals were anesthetized with isofluorane, and the right anterior tibialis muscle was exposed and injected with horseradish peroxidase conjugated to the cholera toxin B subunit (BHRP; 0.5μl, 0.2%; List Biological, Inc.). BHRP labeling permits population-level quantitative analysis of motoneuron somal and dendritic morphologies (Kurz et al., 1986; Goldstein et al., 1990). Forty-eight hours after BHRP injection, a period that ensures optimal labeling of motoneurons (Kurz et al., 1986; Goldstein et al., 1990), animals were weighed, anesthetized with Ketamine/Xylazine (i.p.), and perfused intracardially with saline followed by cold fixative (4% paraformaldehyde).
Motoneuron number and morphology
The tibialis anterior muscle is innervated by motoneurons located in column 4 of the lateral motor column in the L3 spinal segment (Nicolopoulos-Stournaras and Iles, 1983). Following perfusion, the lumbar portion of the spinal cord of each animal was removed, postfixed 5 hours in 1% paraformaldehyde/1.25% glutaraldehyde, and then transferred to sucrose phosphate buffer (10% w/v, pH 7.4) overnight for cryoprotection. Spinal cords were then embedded in gelatin, frozen, and sectioned transversely at 40μm; all sections were collected into four alternate series. One series was stained with thionin for use in cell counts. For visualization of BHRP, the three remaining series were immediately reacted using a modified tetramethylbenzidine protocol (Mesulam, 1982), mounted on gelatin-coated slides, and counterstained with thionin.
Motoneuron counts
To assess potential motoneuron loss after nerve crush, counts of motoneurons in the tibialis motor pool were performed. Motoneurons innervating the tibialis anterior muscles do not form a discrete nucleus, but instead are contained within the large continuous populations of motoneurons located within the lateral motor column. Thus, to identify the appropriate area within the lateral motor column for motoneuron counts in the unreacted series, we used a method similar to that of Little et al. (2009). Briefly, for each animal the range of sections in which motoneurons labeled with BHRP after injection into the tibialis anterior muscle were present in the reacted series was identified, and then motoneuron counts were performed in the appropriate matching sections in the unreacted series. For each animal, estimates of the total number of motoneurons in the left and right lateral motor columns were obtained using the optical disector method as previously described (Little et al., 2009). Counts were made using a video-based morphometry system (Stereo Investigator; MBF Bioscience, Williston, VT, USA) at 937.5X under brightfield illumination. Motoneurons are easily recognizable as large, darkly staining, multipolar cells. A counting frame (110μm × 80μm) was moved systematically throughout an area of each ventral horn (approximately 300μm × 300μm, defined by the actual distribution of BHRP labeled somata from all of the animals used in the study) in each section within the identified range. Only motoneurons in which there was a clear nucleus and nucleolus were counted, provided they did not contact the forbidden lines of the counting frame; motoneuron nucleoli were counted as they appeared while focusing through the z axis, and nucleoli in the first focal plane (i.e., “tops”) were excluded to avoid double counting. The length of the dissector was approximately 16μm, which was adequate for visualizing nucleoli in multiple focal planes. Motoneuron counts were derived from a mean of 14.5 sections spaced 480μm apart and distributed uniformly through the entire rostrocaudal extent of the tibialis motoneuron pool range. This sampling scheme produced average estimated coefficients of error (CE) of 0.051 for intact untreated animals and 0.047 for crush animals. Cell counts for each animal were corrected for the proportion of sections sampled, and then expressed as a ratio [(motoneuron number on the right/crush side relative to that on the left/intact side) × 100] to quantify the magnitude of potential motoneuron loss.
Using similar methods, the number of BHRP-labeled motoneurons was assessed in all sections of the reacted series through the entire rostrocaudal extent of their distribution for all animals. Counts of labeled tibialis motoneurons were made under brightfield illumination, where somata could be visualized and cytoplasmic inclusion of BHRP reaction product confirmed.
Soma volume
To assess potential changes in motoneuron morphology after nerve crush, soma volumes were measured. The volume of tibialis motoneuron somata was assessed in at least one set of alternate sections (160μm apart) using the Nucleator method (Gundersen, 1988). A set of 4 rays emanating from a point randomly chosen within each BHRP-labeled motoneuron soma was drawn and oriented randomly. Soma volumes of an average of 28.44 motoneurons were measured for each animal using Stereo Investigator at a final magnification of 780X. Average estimated coefficients of error (CEs) were .022 for intact untreated animals and .028 for crush animals. Soma volumes within each animal were then averaged for statistical analysis.
Dendritic length
To assess potential changes in motoneuron morphology after nerve crush, dendritic lengths and distributions were measured. For each animal, dendritic lengths in a single representative set of alternate sections were measured under darkfield illumination. Beginning with the first section in which BHRP-labeled fibers were present, labeling through the entire rostrocaudal extent of the tibialis motoneuron dendritic field was assessed in every third section (480μm apart) in three dimensions using a computer-based morphometry system (Neurolucida; MBF Bioscience, Williston, VT, USA) at a final magnification of 250X. No attempt was made to identify BHRP-labeled fibers as either dendrites or axons. Average dendritic length per labeled motoneuron was estimated by summing the measured dendritic lengths of the series of sections, multiplying by three to correct for sampling, then dividing by the total number of labeled motoneurons in that series. This method does not attempt to assess the actual total dendritic length of labeled motoneurons (Kurz et al., 1991), but has been shown to be a sensitive and reliable indicator of changes in dendritic morphology in normal development (Goldstein et al., 1990; Goldstein et al., 1993; Goldstein & Sengelaub, 1994), after changes in dendritic interactions (Goldstein et al., 1993), afferent input (Kalb, 1994; Hebbeler et al., 2002; Hebbeler & Sengelaub, 2003), and after injury (Little et al., 2009; Byers et al., 2012; Ghergherehchi et al., 2019).
Dendritic distribution
To assess potential redistributions of dendrites across treatment groups, for each animal the composite dendritic arbor created in the length analysis was divided using a set of axes oriented radially around the center of the collective labeled somata. These axes divided the spinal cord into twelve bins of 30° each. The portion of each animal’s dendritic arbor per labeled motoneuron contained within each location was then determined. This method provides a sensitive measure of dendritic redistribution in response to changes in dendritic interactions (Goldstein et al., 1993), afferent input (Hebbeler et al., 2002; Hebbeler & Sengelaub, 2003), and injury (Little et al., 2009; Byers et al., 2012; Ghergherehchi et al., 2019).
Dendritic extent
The comparability of BHRP labeling across groups was assessed by quantifying both the radial (in the transverse plane) and rostrocaudal extent of tibialis motoneuron dendritic arbors. The maximal radial extent of the arbor was measured for each animal using the same radial axes and resultant 30° bins used for the dendritic distribution analysis. For each bin, the linear distance between the center of the tibialis motor pool and the most distal BHRP filled process was measured. The rostrocaudal extent of the dendritic arbor was determined by recording the rostrocaudal distance spanned by tibialis motoneuron dendrites for each animal. Dendritic extent is independent of overall dendritic length and reflects the maximal linear distance of BHRP transport to the most distal dendritic processes.
Data analysis
All data were expressed as mean±SEM. For histological analyses, all data were analyzed by t-tests or analyses of variance (one-way, two-way, with repeated measures as appropriate) followed by post hoc analyses using Fisher’s least significant difference (LSD). Digital light micrographs were obtained using an MDS 290 digital camera system (Eastman Kodak Company, Rochester, NY, USA). Brightness and contrast of these images were adjusted in Adobe Photoshop (Adobe Systems, San Jose, CA, USA).
Results
EMG recordings
For statistical and graphical purposes, bi-weekly EMG recordings for each animal were averaged into a single value for each week of post-injury testing. Prior to injury, no differences in maximal EMG amplitude were present across groups for either the lateral gastrocnemius [F(3,20) = 2.92, ns] or tibialis anterior [F(3,20) = 1.00, ns] muscles (Fig. 1). Immediately following crush injury, EMG responses were eliminated in both muscles [Fs(3,20)>3.48, ps < .05]; abolition of the EMG response was equally effective across groups [Fs(3,20)<.75, ns]. EMG responses recovered over the 8 post-injury weeks in both the lateral gastrocnemius [F(8,40) = 10.89, p < .0001] and tibialis anterior [F(8,112) = 20.66, p < .0001] muscles, significantly increasing above post-injury levels starting at 3 weeks post-injury [Fs(3,20)>21.62, ps < .0002] and continuing through 8 weeks post-injury [lateral gastrocnemius, F(3,10) = 38.01, p < .0001; anterior tibialis, F(3,17) = 33.23, p < .0001] muscles. By 8 weeks post-injury, EMG amplitude in the lateral gastrocnemius did not differ from baseline values [F(1,10) = .53, ns], but was still suppressed in the anterior tibialis F(1,17) = 12.16, p < .003].

Maximal EMG amplitudes pre-injury, immediately post-injury, and over the 8 week post-injury recovery period recorded from the (A) lateral gastrocnemius, LG, and (B) anterior tibialis, TA, muscles of axotomized animals that were left untreated (crush + blank, filled circles) or treated with either ES (crush + ES, filled triangles), TP (crush + TP, open triangles), or combined treatment (crush + ES + TP, open circles). EMG responses were eliminated following crush injury and recovered over the 8 post-injury weeks. There were no differences across treatment groups. For graphical purposes, bi-weekly recordings post-injury for each animal have been averaged into a single value per week. Point heights represent group means±SEM. * indicates significantly different from pre-injury values; †indicates significantly different from immediately post-injury values.
Recovery did not vary by treatment, with no main effect of group [lateral gastrocnemius, F(3,40) = .35, ns; anterior tibialis, F(3,112) = .84, ns] and no group x post-injury time interaction [lateral gastrocnemius, F(24,40) = .62, ns; anterior tibialis, F(24,112) = 1.12, ns; Fig. 1].
In intact untreated animals, the number of motoneurons within the identified tibialis range did not differ between the left (125.83±13.01, Mean±SEM) and right (134.91±17.62) motor columns [paired t-test, t(6) = –0.37, ns; right/left ratio = 116.65±21.06]. Motoneuron counts indicated that nerve crush with or without subsequent treatment had no effect on either tibialis motoneuron number [F(5,26) = 1.13, ns] or ratios of motoneuron numbers on the crush side relative to the intact side [F(5,26) = 0.29, ns] of tibialis motoneurons (crush + blank left, 147.77±18.49, right 154.42±27.80, right/left ratio = 103.60±12.88; crush + ES left, 181.95±23.81, right 173.18±23.98, right/left ratio = 95.85±8.13; crush + TP left, 144.72±15.48, right 146.33±18.97, right/left ratio = 107.57±18.84; crush + ES +TP left, 144.24±22.81, right 156.48±27.04, right/left ratio = 112.72±15.43; crush (no EMG) left, 157.68±15.03, right 149.04±14.01, right/left ratio = 96.22±8.72; Fig. 2].

Numbers of tibialis anterior motoneurons in intact untreated animals, axotomized animals that were left untreated (crush + blank) or treated with either ES (crush + ES), TP (crush + TP), or combined treatment (crush + ES + TP), as well as axotomized animals that received no EMG testing. (A) Location of tibialis anterior motoneurons in column 4 of the lateral motor column in the L3 spinal segment. Scale bar = 300μm (B) Image of thionin-stained tibialis anterior motoneurons. Scale bar = 100μm. (C) Number of tibialis anterior motoneurons contralateral (intact) and ipsilateral (crush) to the injury at 8 weeks post axotomy. (D) Number of tibialis anterior motoneurons as a percent ratio of ipsilateral/contralateral side. Bar heights represent group means±SEM. Motoneuron number was not affected by crush injury or treatment.
Injection of BHRP into the anterior tibialis successfully labeled ipsilateral motoneurons in all treatment groups (Fig. 3). Labeled motoneurons were located in the lateral motor column in the L3 spinal segment (Nicolopoulos-Stournaras & Iles, 1983). Dendritic arbors were strictly unilateral, with extensive ramification along the ventrolateral edges of the gray matter and in the lateral funiculus, as well as throughout the ventral horn. An average of 33.38±3.07 motoneurons per animal were labeled with BHRP and did not differ by group [F(5,26) = .57, ns].
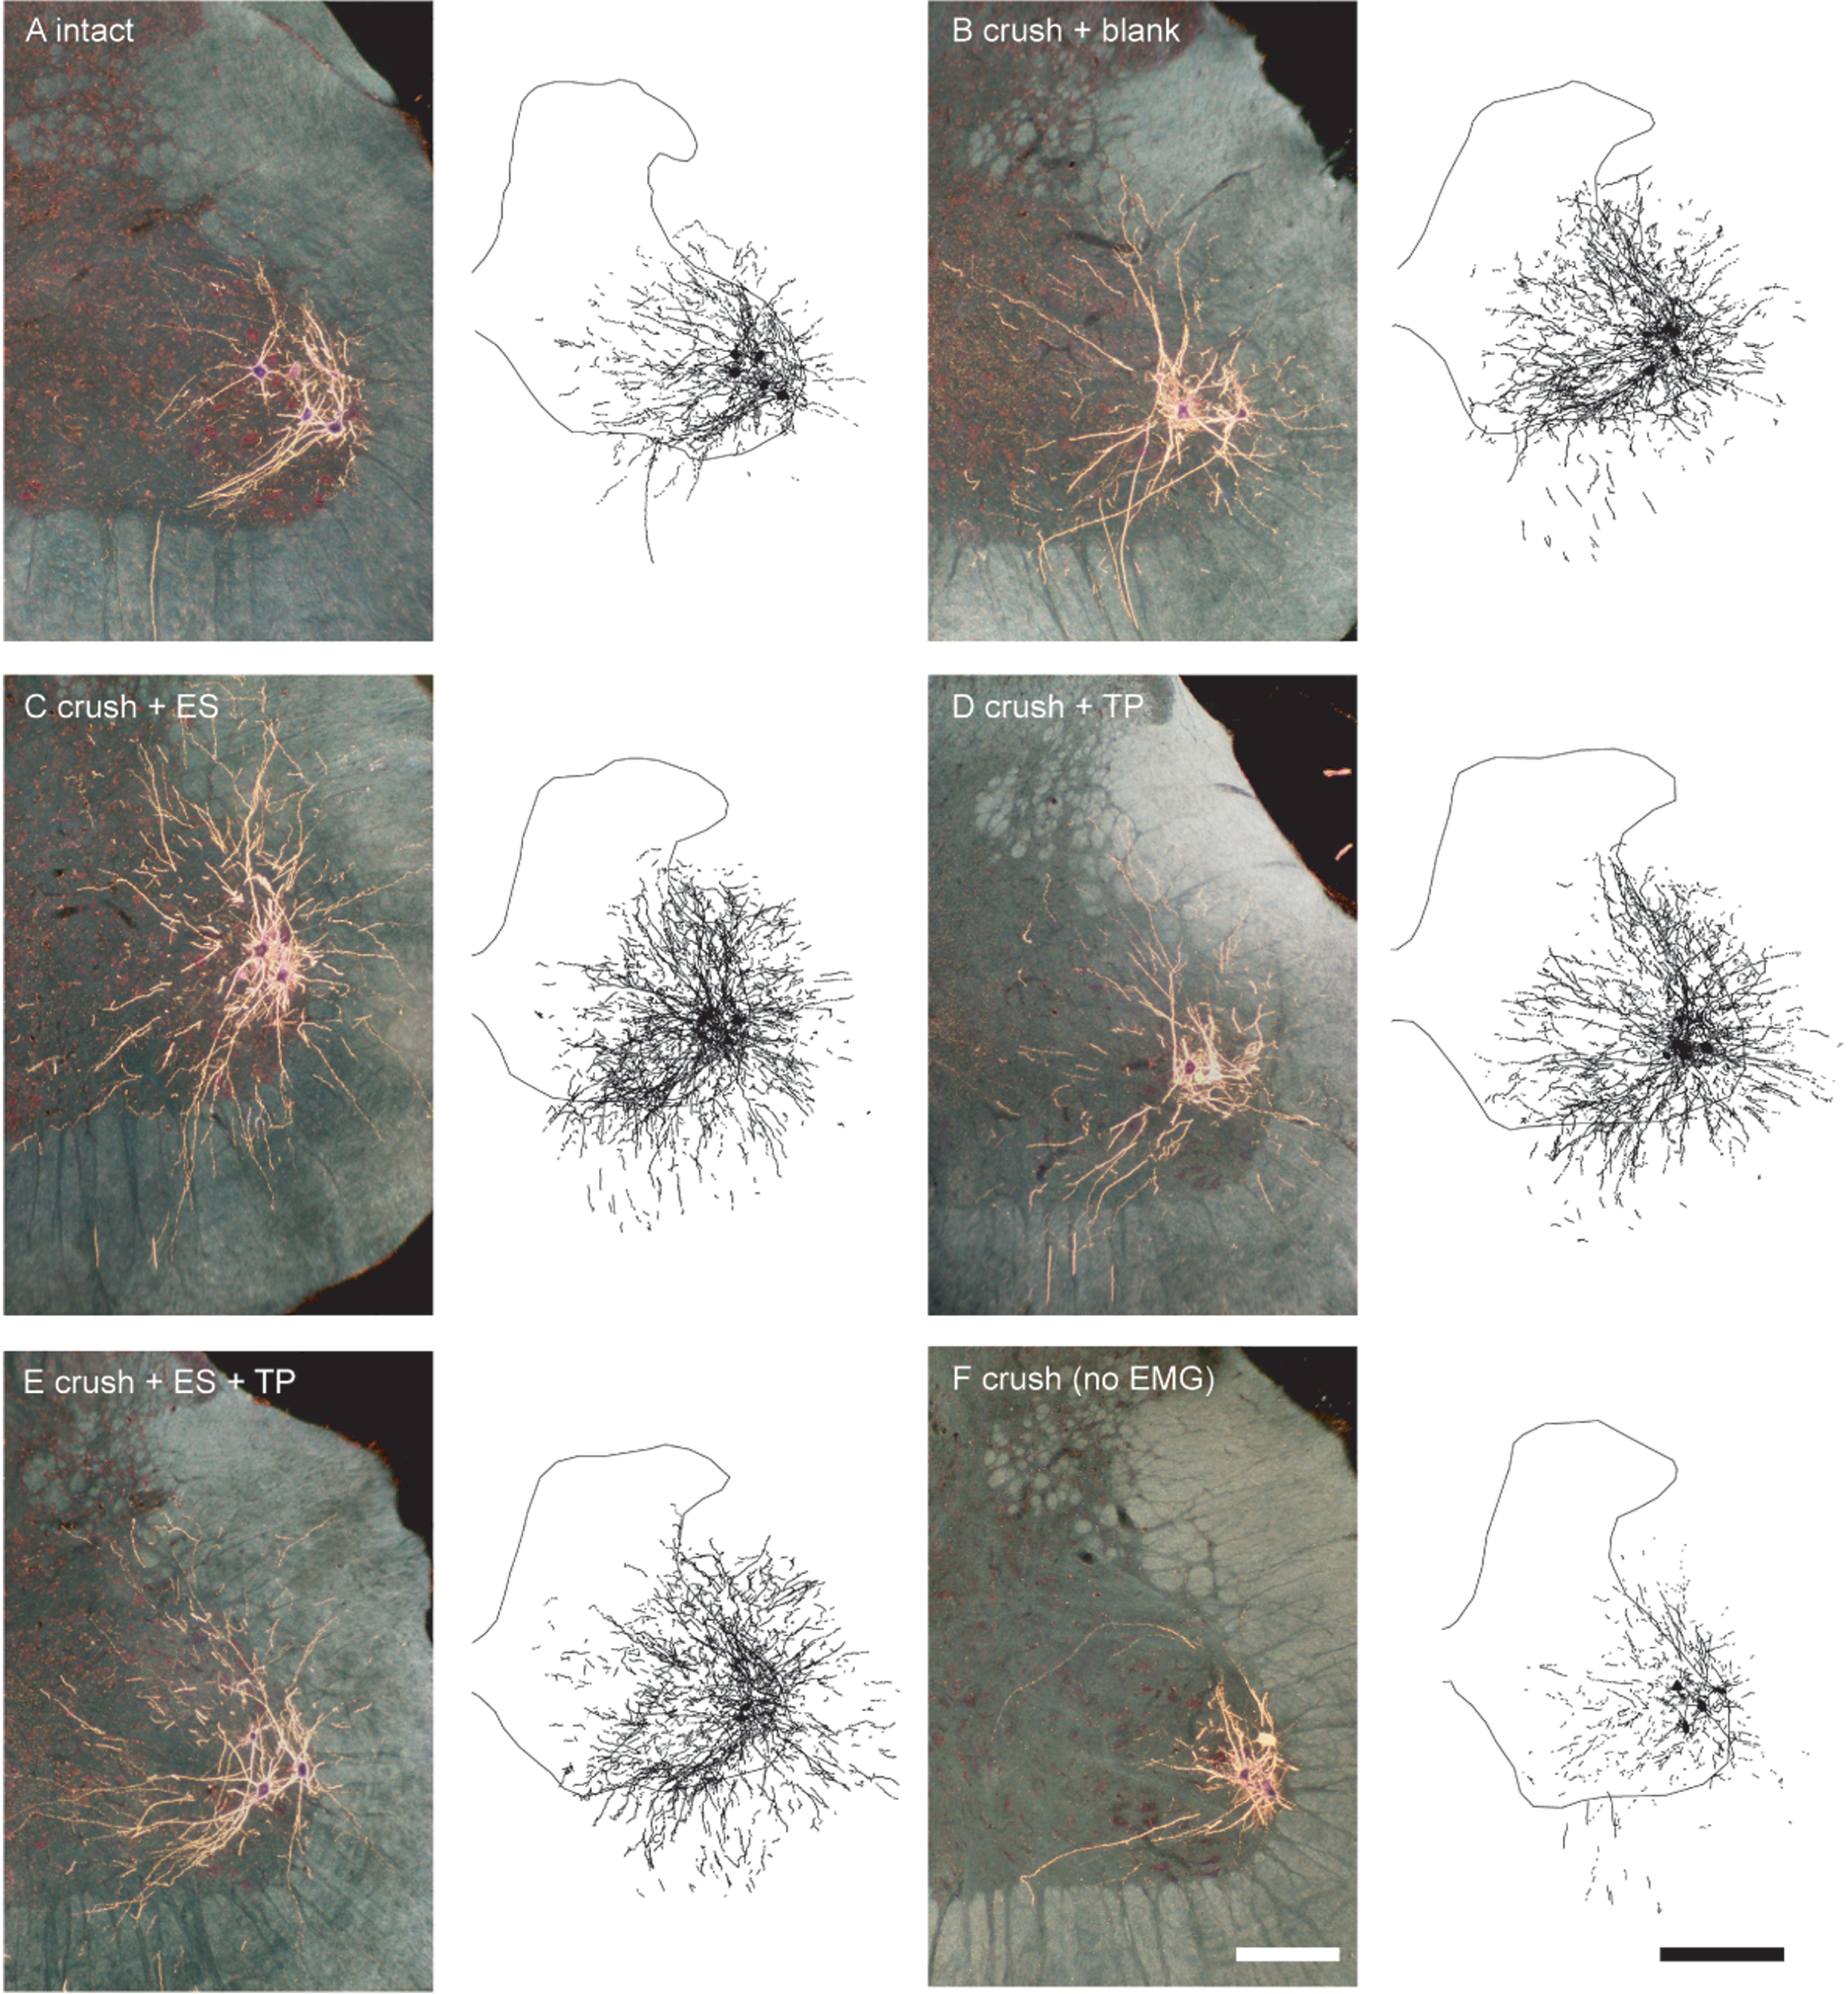
Darkfield digital micrographs of transverse hemisections through the lumbar spinal cords and computer-generated reconstructions of BHRP-labeled somata and processes of an intact untreated animal (A) and axotomized animals that were left untreated (crush + blank, B) or treated with either ES (crush + ES, C), TP (crush + TP, D), or combined treatment (crush + ES + TP, E), as well an axotomized animal that received no EMG testing (F) after BHRP injection into the right anterior tibialis muscle. Computer-generated composites of BHRP labeling were drawn at 480μm intervals through the entire rostrocaudal extent of the quadriceps motor pool; these composites were selected because they are representative of their respective group average dendritic lengths. Scale bars = 250μm (micrographs), 500μm (composites).
In intact untreated animals, tibialis motoneuron somata were typical in size (24985.63±1946.05μm3) and did not differ from those of crush +blank (24204.64±1747.93μm3), crush + ES (24880.64±1085.61μm3), crush + TP (27944.66±1064.91μm3), crush + ES + TP (29511.34±2470.25μm3), or crush (no EMG) animals (21987.32±3303.70μm3), [F(5,26) = 1.58, ns; Fig. 4].

Soma volumes of tibialis anterior motoneurons in intact untreated animals, axotomized animals that were left untreated (crush + blank) or treated with either ES (crush + ES), TP (crush + TP), or combined treatment (crush + ES + TP), as well as axotomized animals that received no EMG testing. Bar heights represent group means±SEM. Motoneuron soma size was not affected by crush injury or treatment.
Following nerve crush and subsequent EMG testing, tibialis motoneurons underwent marked dendritic hypertrophy. Dendritic length increased by 174.57% [11741.62±1931.11μm in crush + blank animals compared to 4276.42±928.54μm for intact untreated animals, LSD, p < .05; overall test for the effect of group on dendritic length F(5,26) = 7.49, p < .0002; Fig. 5]. Dendritic hypertrophy was also present in animals treated with ES, TP, or ES + TP: dendritic lengths in crush + ES animals (11233.80±2449.38μm), crush + TP (8985.91±1296.40μm), and crush + ES + TP (13345.94±2449.38μm) were 162.69%, 110.13%, and 212.08% (respectively) longer than those of intact untreated animals (LSDs p < .05), and did not differ from each other (LSDs, ns). In contrast, dendritic length in crush (no EMG) animals (3576.76±580.81μm) did not differ from that of intact untreated animals (LSD, ns), but was significantly shorter than those of all other crush groups (LSDs, ps < .02).

Dendritic lengths of tibialis anterior motoneurons in intact untreated animals, axotomized animals that were left untreated (crush + blank) or treated with either ES (crush + ES), TP (crush + TP), or combined treatment (crush + ES + TP), as well as axotomized animals that received no EMG testing. Bar heights represent group means±SEM. Marked dendritic hypertrophy was present in all treatment groups that received bi-weekly EMG testing. *indicates significantly different from intact untreated animals.
Dendritic length per bin was nonuniform across radial bins, and a repeated-measures ANOVA revealed a significant effect of radial location [F(11,286) = 41.80, p < .0001; Fig. 6]. Consistent with the results of the dendritic length analysis, there was also a significant effect of group [F(5,286) = 7.56, p < .0002]. Increases in dendritic length occurred throughout the radial distribution in crush + blank animals compared to that of intact untreated animals [an average of 275.91%; F(1,110) = 14.46, p < .004]. Similar increases in length throughout the radial distribution of the dendritic arbor were present in animals treated with ES (averaging 271.18%), TP (averaging 211.71%), or ES + TP (averaging 326.87%) [Fs(1,110)>9.29, ps < .02]. In contrast, the radial distribution of dendritic arbor in crush (no EMG) animals (averaging 90.18%) did not differ from that of intact untreated animals [F(1,110) = .38, ns], but was significantly shorter than those of all other crush groups [Fs(1,88)>15.10, ps < .005].
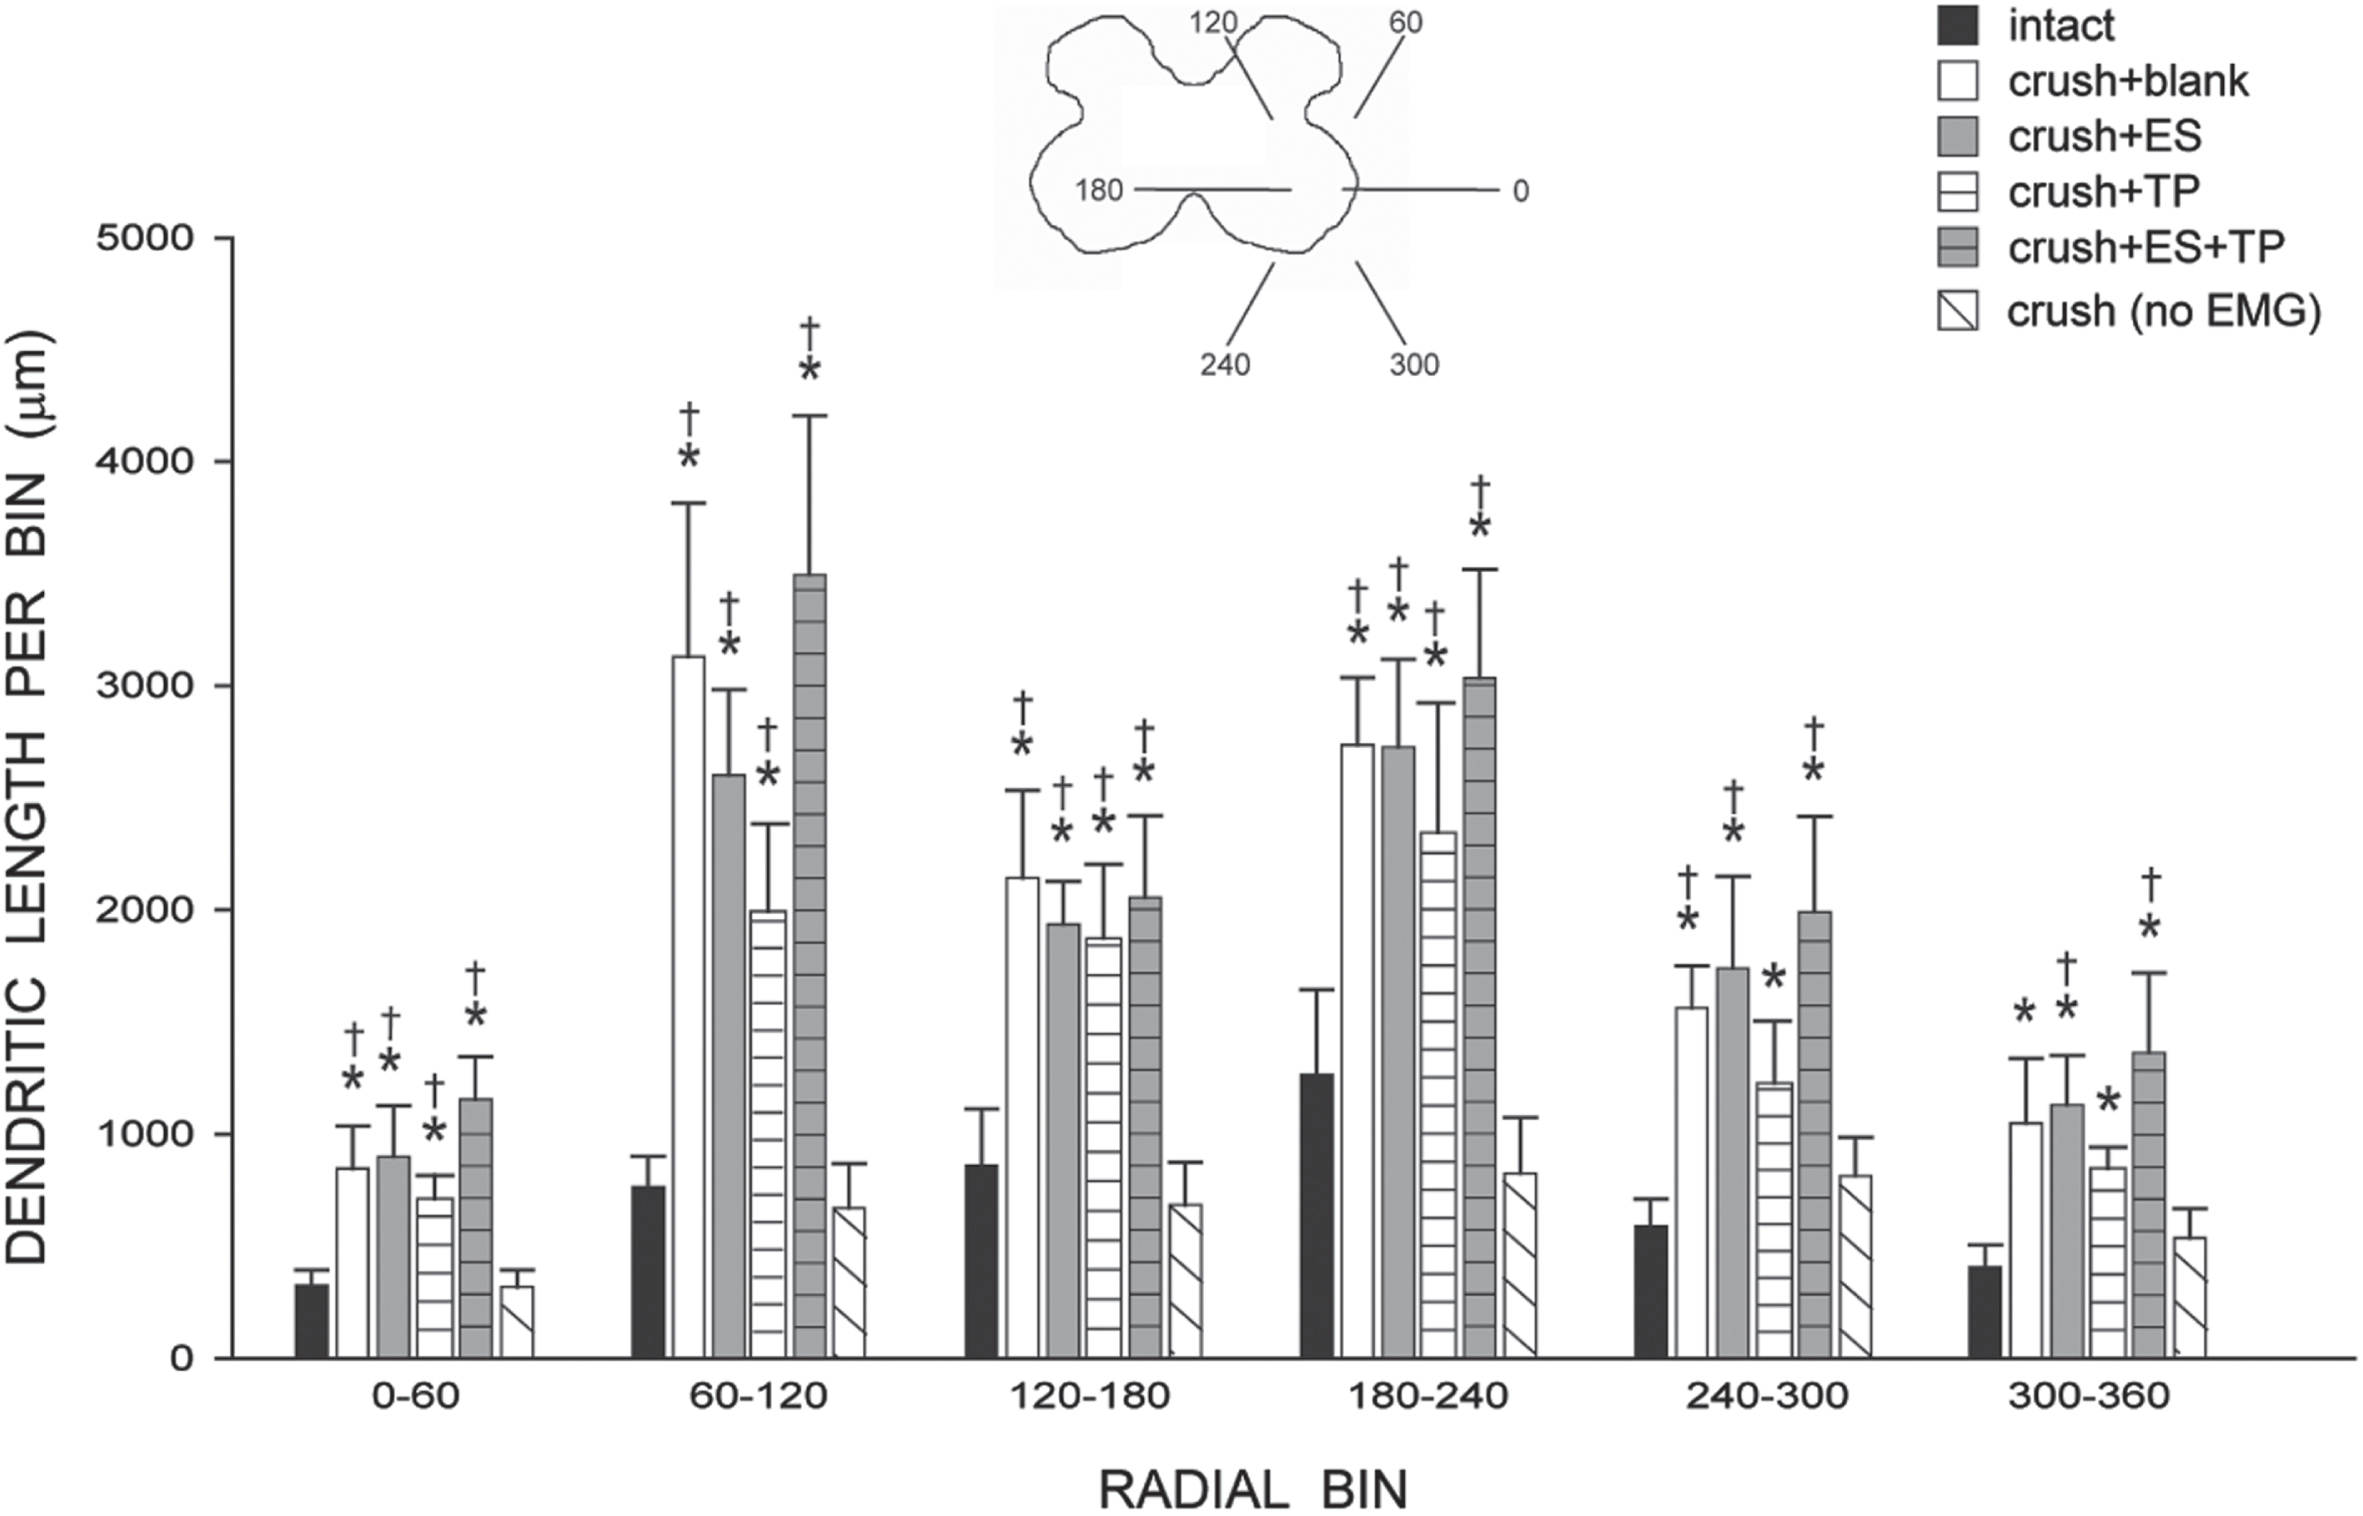
Inset: Drawing of spinal gray matter divided into radial sectors for measure of tibialis anterior motoneuron dendritic distribution. Dendritic length per radial bin of tibialis anterior motoneurons in intact untreated animals, axotomized animals that were left untreated (crush + blank) or treated with either ES (crush + ES), TP (crush + TP), or combined treatment (crush + ES + TP), as well as axotomized animals that received no EMG testing. Increases in dendritic length were present throughout the radial distribution of the dendritic arbor in all treatment groups that received bi-weekly EMG testing. For graphical purposes, dendritic length measures have been collapsed into 6 bins of 60° each. Bar heights represent group means±SEM. *indicates significantly different from intact untreated animals; †indicates significantly different from axotomized animals that received no EMG testing.
Consistent with the nonuniform dendritic distribution of tibialis motoneurons apparent in Fig. 3, radial dendritic extent differed across bins (Fig. 7) and repeated-measures ANOVA revealed a significant effect of location [F(11,286) = 63.96, p < .0001]. Radial dendritic extent also differed across groups [F(5,228) = 9.41, p < .0001]. Increases in dendritic extent occurred throughout the radial distribution in crush + blank animals compared to that of intact untreated animals [an average of 159.59%; F(1,110) = 20.12, p < .002]. Similar increases in extent throughout the radial distribution of the dendritic arbor were present in animals treated with ES (averaging 154.09%), TP (averaging 137.22%), or ES + TP (averaging 160.62%) [Fs(1,110)>6.65, ps < .03]. In contrast, radial dendritic extent in crush (no EMG) animals (averaging 104.38%) did not differ from that of intact untreated animals [F(1,110) = .00, ns] but was significantly shorter than those of all other crush groups [Fs(1,88)>6.61, ps < .04]. Rostrocaudal dendritic extent also differed across groups [F(5,26) = 3.69, p < .02; Fig. 8], spanning 2605.70±147.00μm in intact untreated animals, and increasing to 4000.00±572.40μm in crush + ES animals, and 4128.00±478.4μm in crush + ES + TP animals [LSDs, ps < .05]. Rostrocaudal extent in crush + blank (3424.00±164.7μm), crush + TP (3328.00±163.2μm) and crush (no EMG) (2880.00±242.65μm) animals did not differ from that of intact untreated animals (LSDs, ns).
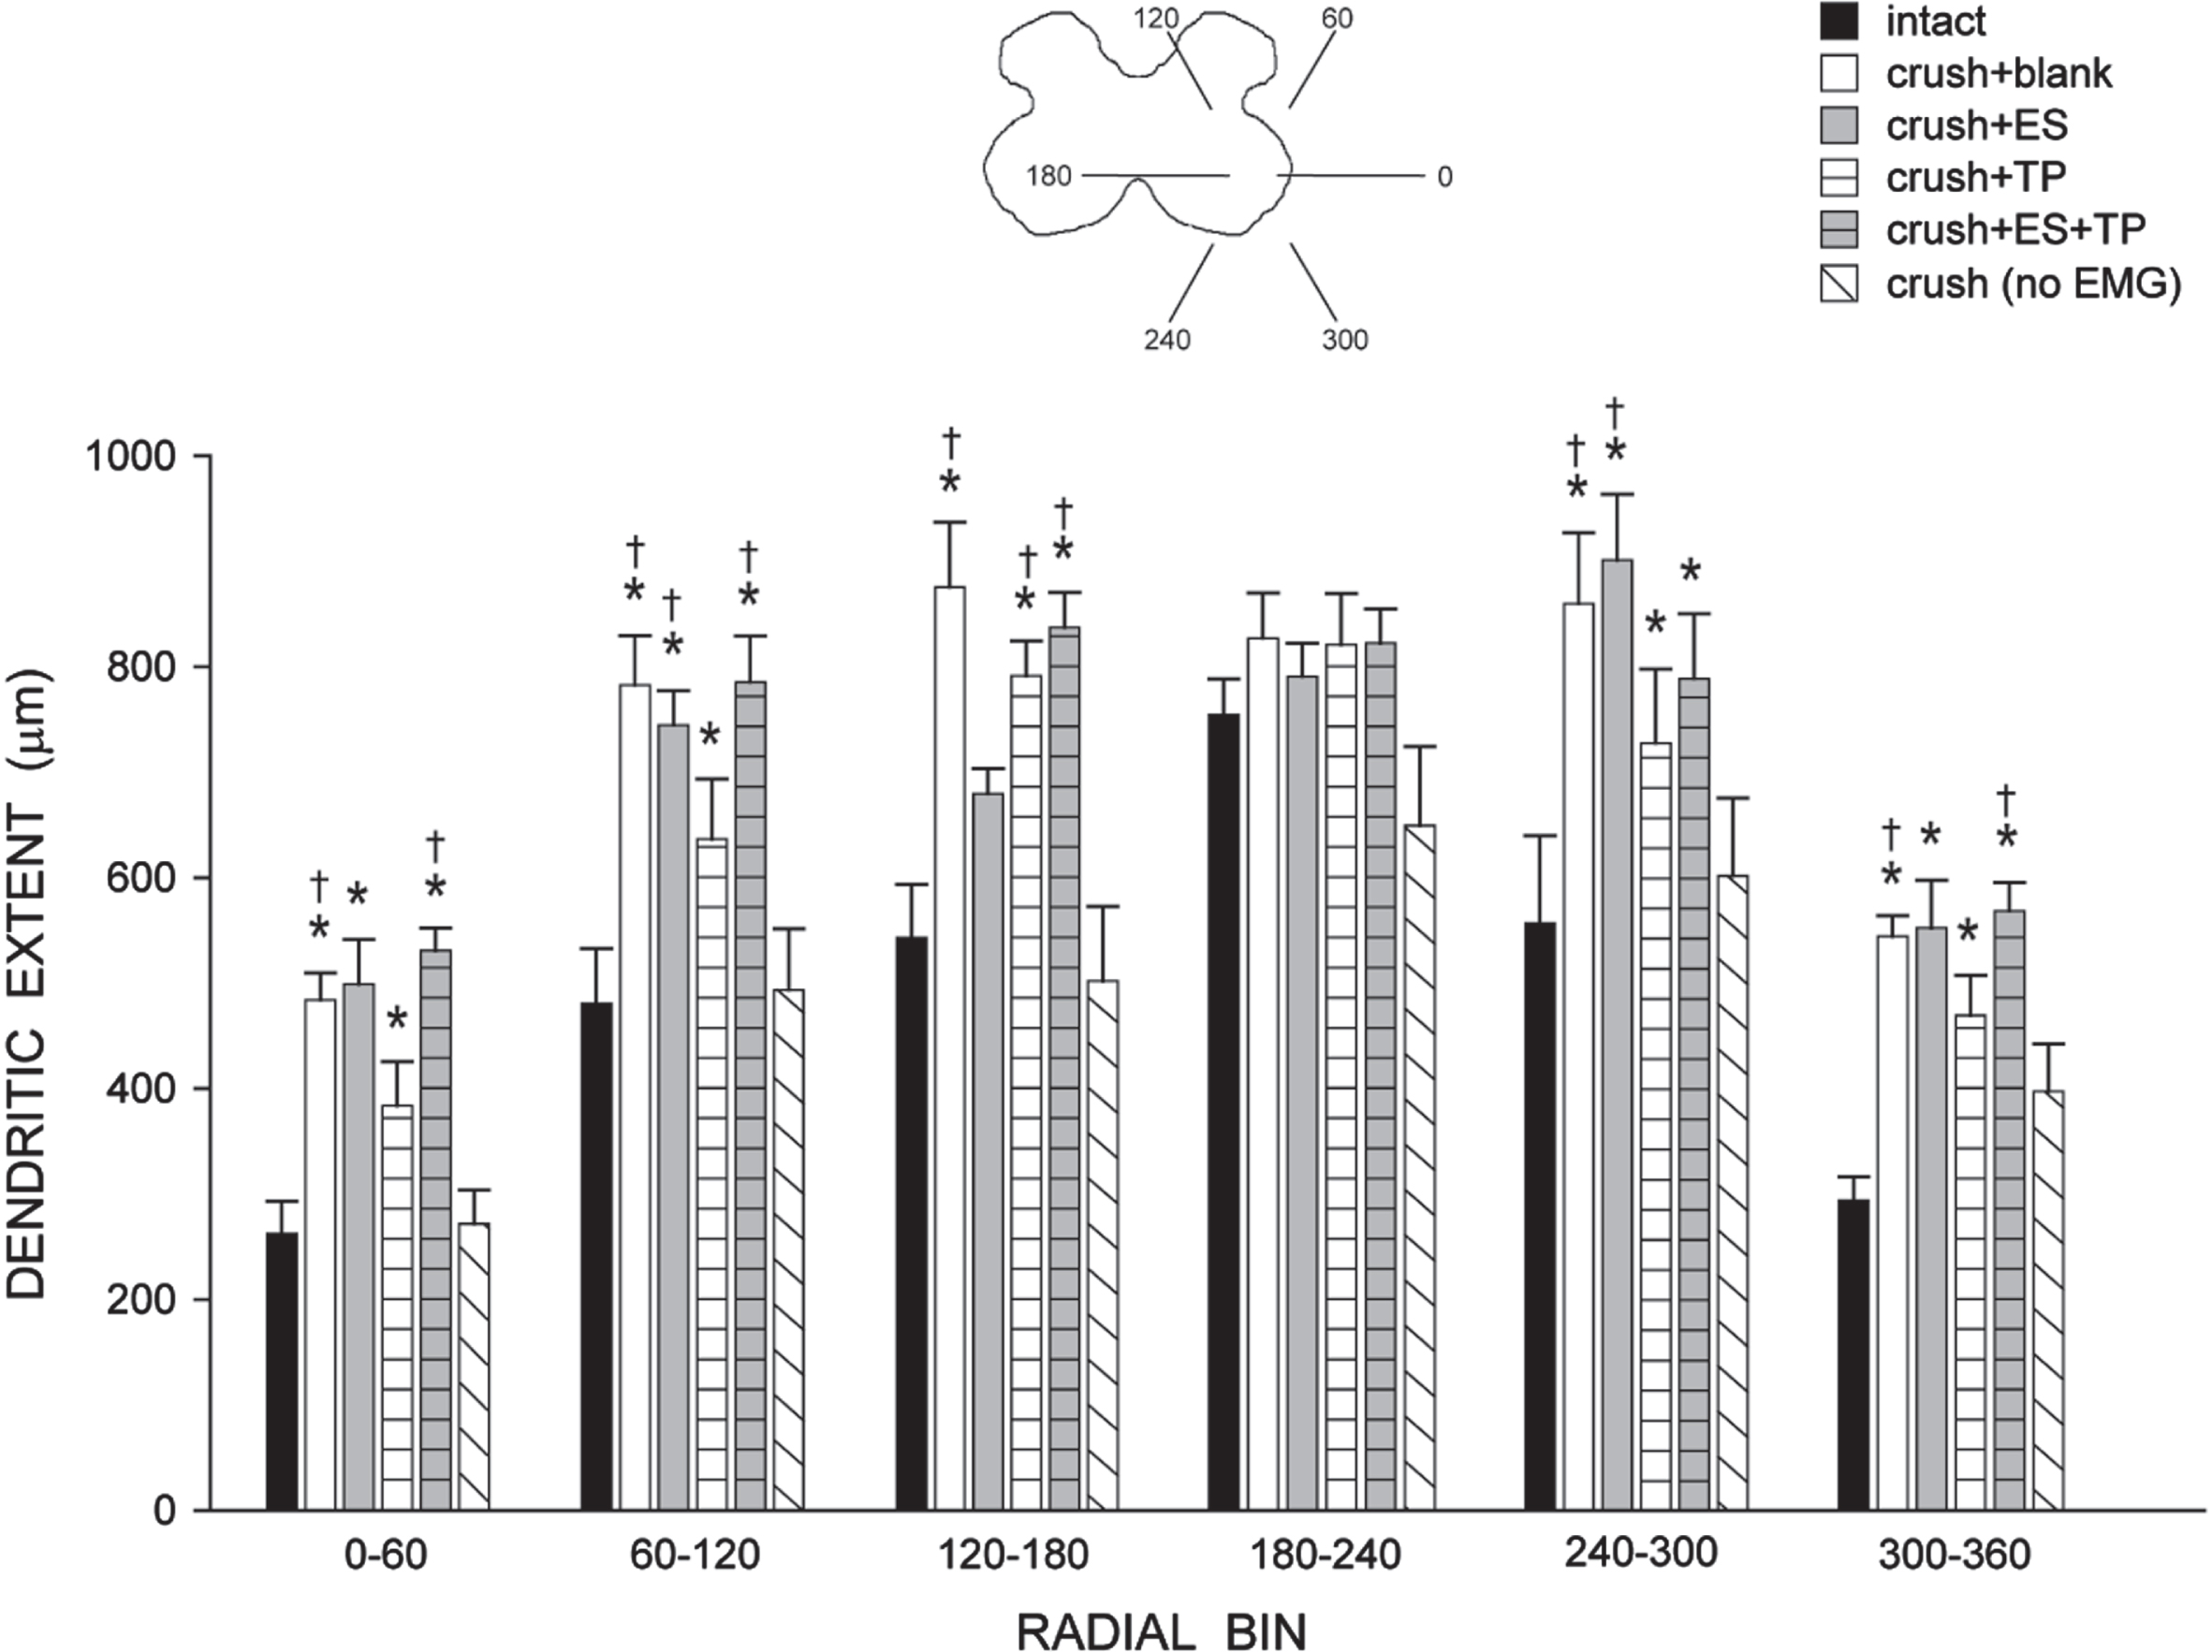
Inset: Drawing of spinal gray matter divided into radial sectors for measure of tibialis anterior motoneuron radial dendritic extent. Radial extents of tibialis anterior motoneuron dendrites in intact untreated animals, axotomized animals that were left untreated (crush + blank) or treated with either ES (crush + ES), TP (crush + TP), or combined treatment (crush + ES + TP), as well as axotomized animals that received no EMG testing. Increases in radial extent were present throughout the distribution of the dendritic arbor in all treatment groups that received bi-weekly EMG testing. For graphical purposes, dendritic length measures have been collapsed into 6 bins of 60° each. Bar heights represent group means±SEM. *indicates significantly different from intact untreated animals; †indicates significantly different from axotomized animals that received no EMG testing.
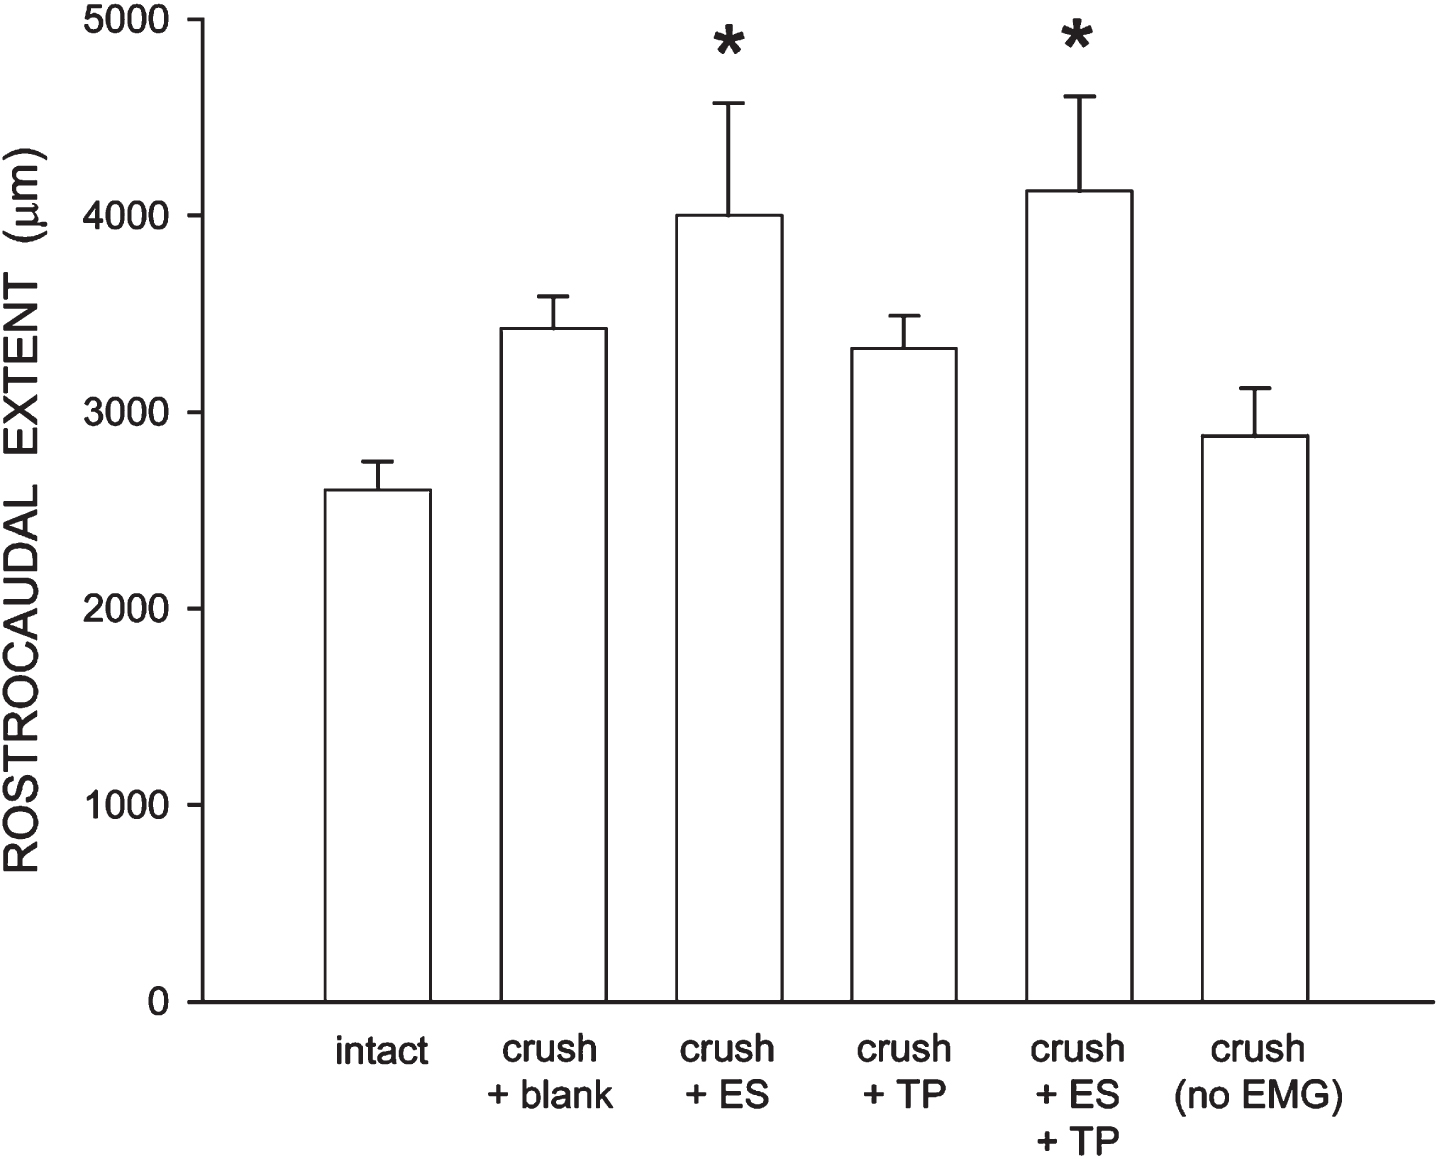
Rostrocaudal extent of tibialis anterior motoneuron dendrites in intact untreated animals, axotomized animals that were left untreated (crush + blank) or treated with either ES (crush + ES), TP (crush + TP), or combined treatment (crush + ES + TP), as well as axotomized animals that received no EMG testing. Increases in rostrocaudal extent were present in all treatment groups that received bi-weekly EMG testing, and significantly so in crush + ES and crush + ES + TP animals. Bar heights represent group means±SEM. *indicates significantly different from intact untreated animals.
Peripheral or lower motoneurons have the inherent capacity for significant regeneration after peripheral nerve injury (PNI) disconnection from target musculature (Grafstein, 1975). Unfortunately, many outlying factors impede successful target reconnection and full functional recovery (Brushart, 2011). Among the many neurotherapeutic approaches to PNI repair, electrical stimulation and steroid hormone (testosterone propionate) treatment, individually or in combination, have been shown to improve functional recovery after nerve damage, from both qualitative and quantitative perspectives (Sharma et al., 2009a,b; 2010). Regain of functional recovery is of significant value clinically in terms of improving activities of daily living (ADL) and quality of life for the neurologically impaired individual. Heretofore, much of the focus of nerve reparative approaches has been dedicated to accelerating axonal regeneration and reducing synkinesis upon reconnection to target musculature (Kujawa & Jones, 1995; Brushart, 2011). In the current study, we assessed the potential consequences of axotomy and effectiveness of treatment with ES and/or TP on motoneuron dendrites, using bi-weekly EMG testing to assess functional recovery after sciatic nerve injury in the rat. We discovered exuberant changes in dendritic morphology by 8 weeks post-injury. Specifically, the dendritic morphology of motoneurons innervating the anterior tibialis muscle showed an unusual hypertrophy in length with expansion into novel areas of both the gray and white matter. Surprisingly, we found that bi-weekly EMG testing alone was responsible for these dendritic changes after injury and functional recovery, as the effects occurred regardless of treatment with ES and/or TP and were completely absent in animals who did not receive EMG testing.
Motoneuron number and size
It is well-established that newborn rat motoneurons are susceptible to cell death following spinal nerve axotomy (Schmalbruch, 1984); however, there is very limited motoneuron death in adult animals (Vanden Noven et al., 1993; Gu et al., 1997; Wu & Kaas, 2000). In the current study, crush injury did not affect motoneuron number, and treatment with ES and/or TP had no effect. This is an important observation, as changes in motoneuron number can have effects on the morphology of remaining motoneurons, potentially confounding our results. For example, previous studies have shown that following induced motoneuron death in adulthood, surrounding neurons undergo morphological change, retracting their dendritic arbors (Fargo & Sengelaub, 2004a; Little et al., 2009). Because motoneuron number was not affected by axotomy in the current study, the changes we observed in dendritic morphology, particularly hypertrophy in length, cannot be ascribed to axotomy-induced motoneuron death.
Decreases in soma size can occur after axotomy, for example after protracted periods (e.g., Ma et al., 2001). In the current study, crush injury did not affect motoneuron somal volume. Although it is possible that axotomized motoneurons underwent somal atrophy following crush injury earlier in the recovery period, no differences in soma size in axotomized groups from intact animals were seen at 8 weeks post-injury. This absence of an effect of axotomy was clearly present after target reconnection, as measurements were made from retrogradely labeled TA motoneurons after intramuscular injection. Again, as for motoneuron number, treatment with ES and/or TP had no effect.
Dendritic morphology
The dendritic arbors of spinal motoneurons play a critical role in motoneuron function (Ulfhake & Cullheim, 1988; Burke, 1990), providing the majority of the surface area for synapses (Ulfhake & Kellerth, 1981; Chen & Wolpaw, 1994), integrating inputs and excitation (Mainen & Sejnowski, 1996; Markram et al., 1997), and allowing neurons to locally regulate the distribution of ion channels and receptors (Crino & Eberwine, 1996; Johnston et al., 1996). Differences in dendritic branching patterns, distribution, and overall shape determine important functional properties in motoneurons (e.g., Ulfhake & Kellerth, 1981; Schoenen, 1982; Cameron et al., 1985; Cullheim et al., 1987a; Cullheim et al., 1987b; Furicchia & Goshgarian, 1987; Ritz et al., 1992), and the morphology of spinal neurons correlates with their electrophysiological properties (Rumberger et al., 1998; Lu et al., 2001; Grudt & Perl, 2002). Dendrites are highly plastic, dynamically regulated by a combination of molecular and activity-dependent cues (McAllister et al., 1995; Lu et al., 2005; Horch, 2004), and alterations in dendritic morphology have a profound influence on neuron function (Mainen & Sejnowski, 1996; Vetter et al., 2001).
Steroid hormones have been shown to be powerful regulators of dendritic morphology in spinal motoneurons. For example, in young adult male rats, castration results in a substantial reduction in dendritic length of motoneurons in the spinal nucleus of the bulbocavernosus (SNB), which can be completely reversed with androgen replacement (Kurz et al., 1986). Similarly, circulating testosterone levels decline with advancing age, and SNB motoneuron dendritic length declines to less than 50% of young adult levels. Treatment of aged animals with testosterone completely reverses the age-related declines in SNB motoneuron morphology (Fargo et al., 2007). Treatment with testosterone is also neuroprotective after injury. Experimentally induced partial depletion of motoneurons results in dendritic atrophy in surviving motoneurons, with reductions of over 60% in dendritic length (Fargo & Sengelaub, 2004a,b, 2007; Little et al., 2009; Wilson et al., 2009; Cai et al, 2017). These regressive changes in motoneuron dendritic morphology correlate with changes in motor activation: concomitant with atrophy, stimulation-evoked activation of motoneurons is attenuated (Little et al., 2009; Fargo et al., 2009). Testosterone treatment attenuates this dendritic atrophy (Fargo & Sengelaub, 2004a,b, 2007; Little et al., 2009) and improves motor activation (Little et al., 2009; Fargo et al., 2009). Similarly, following a contusive spinal cord injury in rats, surviving motoneurons have significantly decreased dendritic lengths (over 40%; Byers et al., 2012), likely reflecting the deafferentation resulting from the loss of descending motor and propriospinal tracts. This atrophy was almost completely attenuated after testosterone treatment, potentially providing a mechanism for the improved locomotor performance previously observed with hormonal treatments following spinal cord injury (Clark et al., 2008).
ES has also been shown to affect neurite and growth cone guidance in vitro. For example, application of an electrical field increases neurite outgrowth of chick dorsal root ganglion explants (Jaffe & Poo, 1979). Later reports confirmed these results in Xenopus laevis, but also revealed that electrical fields alter neurite orientation and branching in a way that is dependent upon duration, amplitude, and frequency of the stimulus pulse (Patel & Poo, 1982; Patel & Poo, 1984; McCaig, 1990). Despite the aforementioned evidence for steroid hormone-mediated effects on motoneuron dendrites, the application of TP and/or ES in the sciatic nerve crush injury paradigm failed to affect dendritic properties in concert with their well-documented positive effects on axonal outgrowth and target disconnection. As discussed above, a considerable amount of work demonstrating the neurotherapeutic potential of both TP and ES in PNI has been done in the rodent facial nerve injury model. One future direction of the present study will be to examine the effects of treatment on dendritic plasticity in the brainstem after cranial nerve damage.
EMG testing as repeated electrical stimulation
Repeated stimulation paradigms vary, but typically consist of an initial stimulation delivered immediately after axotomy and then repeated over weeks of recovery. For example, after transection and surgical repair of the femoral nerve trunk in rats, Geremia et al. (2007) applied electrical stimulation (supramaximal intensity of 3 V, 20 Hz for 1 h, 100μs duration pulses) immediately, and then continuously for 3 h, 1 day, 7 days or 14 days. Similarly, Asensio-Pinilla et al. (2009) applied stimulation after transection and surgical repair of the sciatic nerve in rats (supramaximal intensity of 3 V, 20 Hz for 1 h, 0.1 ms duration pulses) immediately, and then delivered for 1 h daily, 5 days a week for 4 weeks. Koo et al. (2018) applied stimulation after transection and surgical repair of the sciatic nerve in rats (threshold voltage: 100–300 mV, 20 Hz for 1 h, 200μs duration pulses) delivered daily for up to 8 weeks. After axotomy of the sciatic nerves in mice, Park et al. (2019) applied electrical stimulation to the repaired nerve (20 Hz for 1 h, 0.3 ms duration pulses), delivered at twice the intensity needed to evoke a muscle response, and then repeated that stimulation regimen every third day for two weeks.
Although it was not intended to be so, the bi-weekly EMG testing performed in the current study appears to have resulted in a repeated electrical stimulation paradigm. Across all of the groups who received EMG testing, stimulation of the sciatic nerve was applied on days 1 and 5 of each week beginning immediately after injury and continuing for eight consecutive weeks to produce EMG recordings. For each EMG recording trial, nine stimulations were delivered to the sciatic nerve (200μs pulse duration), at intensities ranging from 0.408–8.16 V. This repeated stimulation for EMG testing throughout the axonal regenerative and target reconnection process produced extraordinary central plasticity effects on tibialis motoneuron dendrites, irrespective of treatment with ES and/or TP, and no dendritic hypertrophy was present in axotomized animals who did not receive repeated stimulation.
Negative consequences of repeated electrical stimulation
As pointed out by Park et al. (2019), the effects of application of repeated ES on the regrowth of axons after nerve injury are mixed. Although some reports of repeated ES show greater axon regeneration than that seen with only a single application (e.g., Koo et al., 2018), others show an inhibition. For example, continuous stimulation for 3 hours or up to 14 days was less effective than 1 hour of treatment immediately after injury and repair of sensory axons (Geremia et al., 2007). Similarly, animals receiving 1 hour of daily stimulation, 5 days a week for 4 weeks, showed lower levels of muscle reinnervation and decreased numbers of regenerated myelinated axons compared to those that received only immediate ES post-injury and repair of the sciatic nerve (Asensio-Pinilla et al., 2009).
Reorganizations of spinal circuitry similar to what we report in the current study have also been reported. Park et al. (2019) reported that, following sciatic nerve transection and repair, repeated applications of brief ES did not enhance the rate of restoration of functional muscle reinnervation and, in fact, resulted in the retention of exaggerated reflexes. EMG activity recorded from reinnervated muscles was observed earlier in electrically stimulated animals compared to untreated controls, but, while the amplitudes of muscle response increased over the recovery period, the rate of this progression was significantly decreased in animals receiving repeated ES, relative to a single stimulation. Repeated ES also prevented the recovery of monosynaptic H reflexes, which were maintained at more than twice that recorded prior to injury. Both excitatory and inhibitory synaptic contacts onto the somata of injured motoneurons were sustained in animals treated repeatedly but not in single-treated or control mice. This reorganization of spinal circuitry and synaptic rearrangement after repeated ES may also be reflected in the dendritic hypertrophy we observed in tibialis motoneurons after repeated electrical stimulation.
Conclusion
In summary, the results of this study provide evidence for spinal cord plasticity induced by repeated EMG testing during the time period associated with PNI repair and recovery of motor function. Importantly, the magnitude of dendritic hypertrophy extends well into gray matter, white matter, radially and in a rostrocaudal direction. Interestingly, the results also indicate that ES and/or TP, two neurotherapeutic approaches with demonstrated molecular/behavioral changes consistent with peripheral improvements in axonal repair and target reconnection, do not appear to impact central plasticity in a similar manner. Future directions will be to explore the functional significance of EMG-induced central plasticity. Do new synapses form and, if so, is there increased excitatory and/or inhibitory input to injured motoneurons that have functional significance? Are there negative and/or positive ramifications associated with functional recovery that ultimately impact ADL for the neurologically impaired individual? Further morphological and behavioral studies will be necessary to address these questions in follow-up to the results reported in our work.
Footnotes
Acknowledgments
The authors have no acknowledgments to report.
Funding
Funding was provided through an Indiana University Collaborative Research Grant fund of the Office of the Vice President for Research to K.J.J. and D.R.S.
Conflict of interest
The authors have no conflict of interest to report.