
Abstract
Tensile strength and fatigue strength of friction-welded joints of pure titanium to tough pitch copper were statistically analyzed and validated by experimental tensile and fatigue testing. In the tensile testing, it was found that the shape parameter of the Weibull distribution increased with an increase in mean value of the tensile strength and with a decrease in dispersion of the tensile strength. The shape parameter was useful for judging the suitability of the friction welding conditions. An appropriate shape parameter could be estimated by Weibull analysis from the data of 10 pieces of joint specimens. In the fatigue testing, P–S–N curves showed that the dispersion in the fatigue life distribution of the sound joint was stabilized regardless of stress level, whereas that of a poor joint dispersed as the stress level decreased. Moreover, the guarantee fatigue life of sound joints could be estimated by Weibull analysis.
Introduction
Friction welding is used in many fields because it is possible to weld dissimilar materials, the welding energy is low, and the procedure is easily automated. However, this method still has some unresolved issues: setting the appropriate welding conditions is difficult for some materials, the optimum welding conditions depend on friction welding machines because of differences of upset timing and breaking timing, and so on. Recently, the authors evaluated friction welding conditions by statistical analysis and heat input. In the friction welding of similar and dissimilar materials, the statistical analysis was useful for evaluating joint performance because the tensile strength of joints welded under the same welding conditions dispersed [1–3].
Chemical compositions of base metals (mass %)
Chemical compositions of base metals (mass %)
Mechanical properties of base metals
Friction welding parameters
The materials used in this study were TB340H commercial pure titanium (TB340H-JIS) and C1100-H tough pitch copper (C1100-JIS). The chemical compositions and mechanical properties of the base metals are listed in Tables 1 and 2, respectively. For each base metal, a cylindrical bar 20 mm in diameter was cut to a length of 140 mm, and a length of 30 mm of the welding end of the bar was machined down to a diameter of 14 mm. Friction welding was conducted using a brake-type friction welding machine. The friction welding parameters used are shown in Table 3.
The joint strength of the friction-welded joints was evaluated by tensile testing and fatigue testing using the test specimens shown in Fig. 1. The tensile test and the fatigue test were carried out using an Instron-type universal testing machine and Ono’s rotary bending fatigue testing machine, respectively. For comparison, a base metal specimen of the same joint shape was tested. For the statistical investigation, three typical welding conditions were selected from the tensile testing result. In general, 20–30 pieces of test specimens are needed in a statistical analysis. The tensile strength distribution of 20 pieces of joints welded under typical welding conditions was statistically analyzed by a Weibull distribution. Moreover, the authors examined whether the statistical analysis could be applied to less than 20 pieces of test specimens. The fatigue limit in the fatigue testing was the highest stress level that did not fracture during the course of 107 loading cycles of the S–N curves. Next, the fatigue test of 10 pieces of joints was conducted at stress levels that were 1.1-fold and 1.3-fold the fatigue limits. On the basis of these data, the fatigue life distribution of joints was investigated from probabilistic stress life (P–S–N) curves, and the statistical analysis was investigated by using the Weibull distribution.

Shape and dimensions of test specimens (unit: mm). (a) Tensile test specimen. (b) Fatigue test specimen.
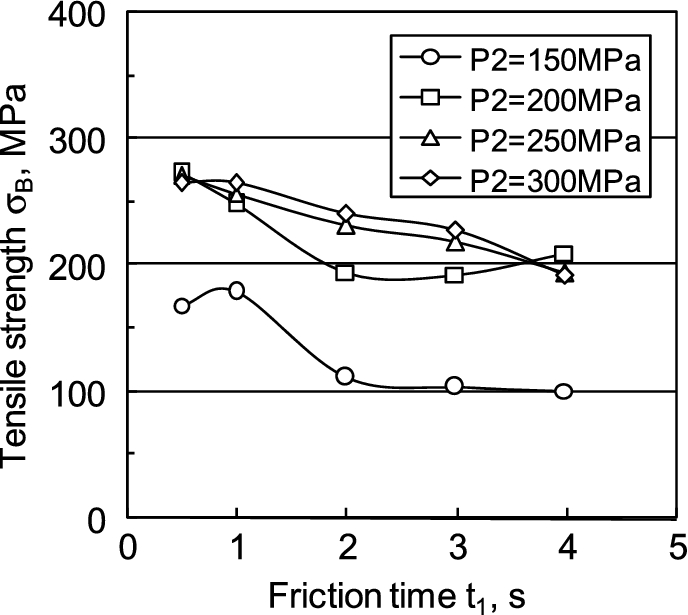
Relationship between tensile strength and friction time.
Tensile test
Typical friction welding conditions
The relationship between tensile strength and friction time for upset pressures
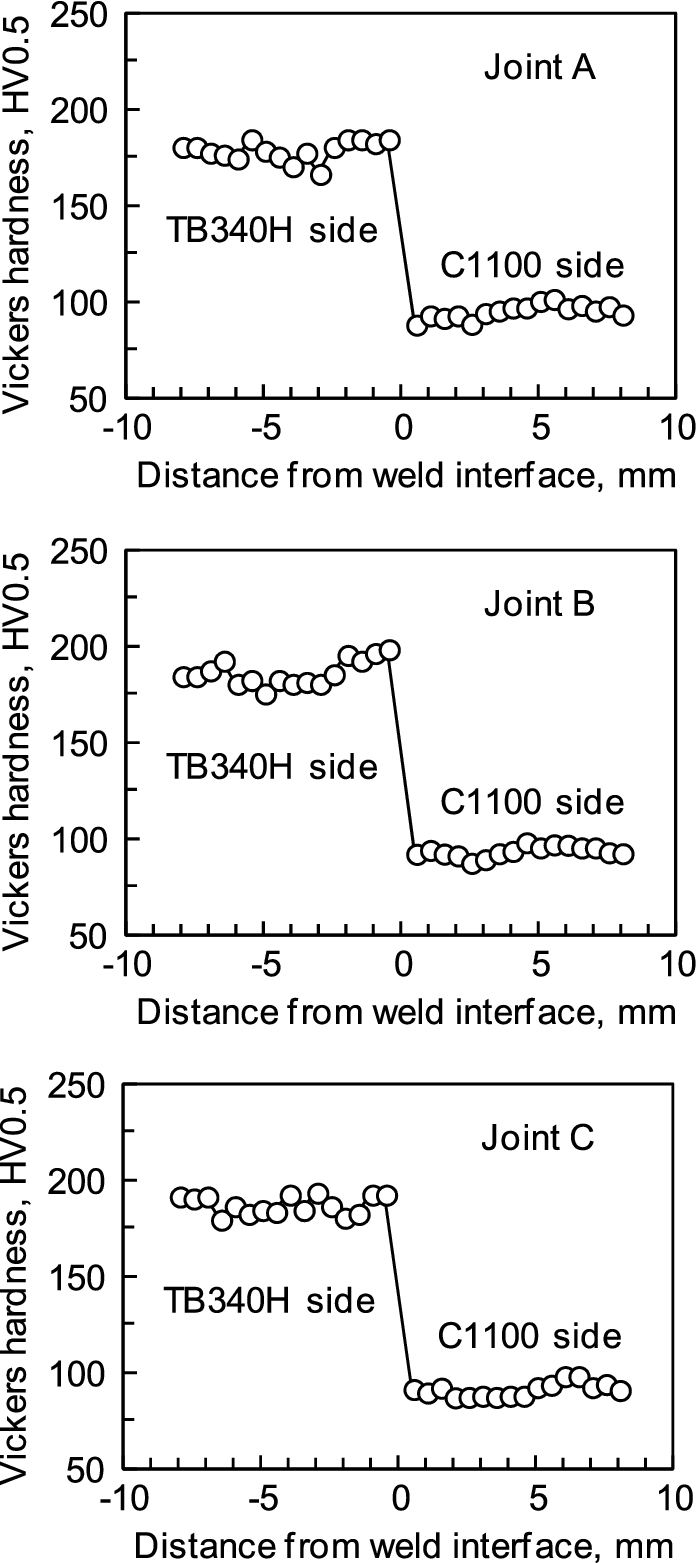
Hardness distribution of joints A–C.
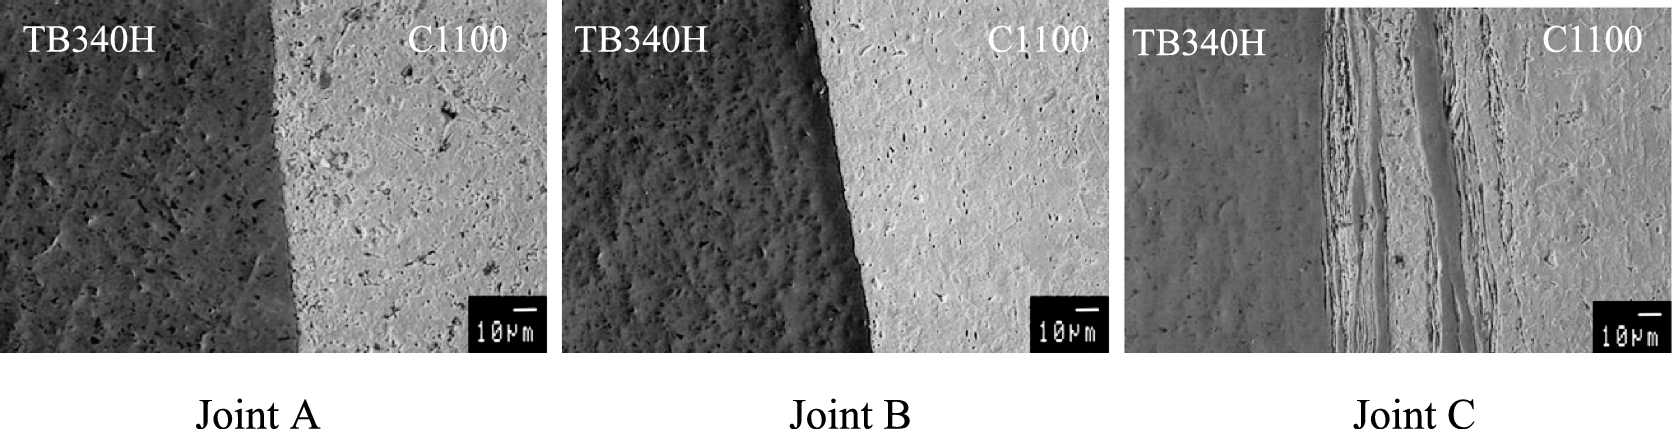
SEM images of joints A–C.
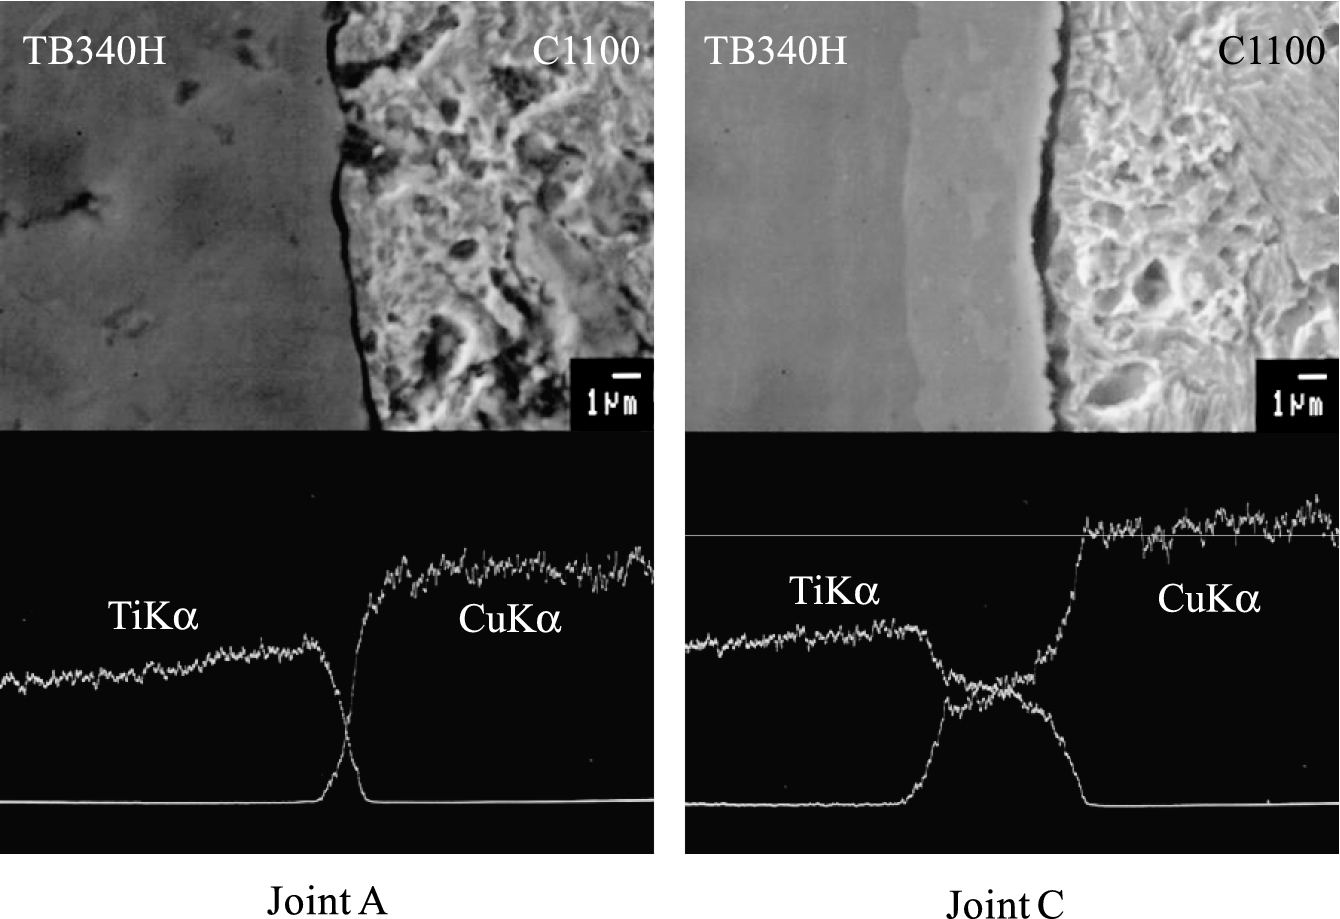
SEM images and EPMA line scanning profiles of joints A and C.
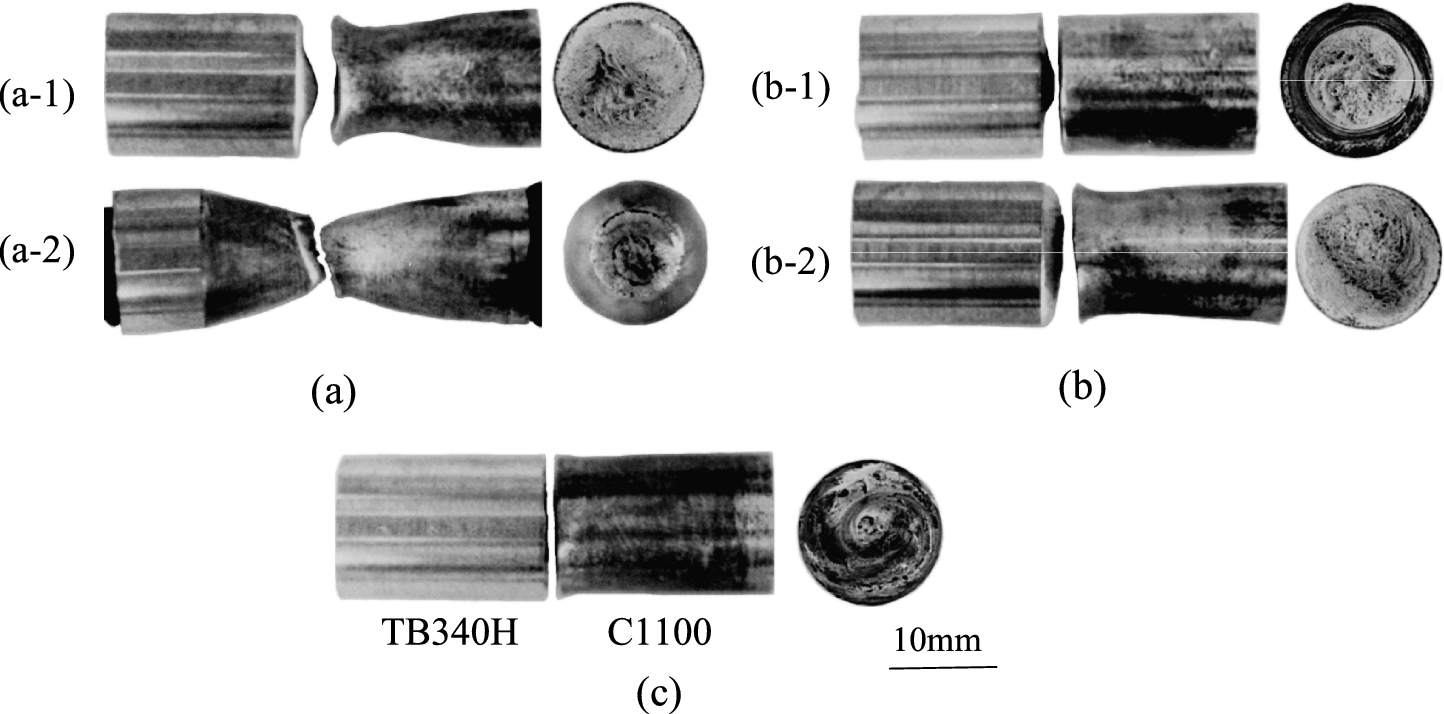
Appearances of tensile-tested specimens and tensile-fracture surfaces in the TB340H side. (a) Joint A. (b) Joint B. (c) Joint C.
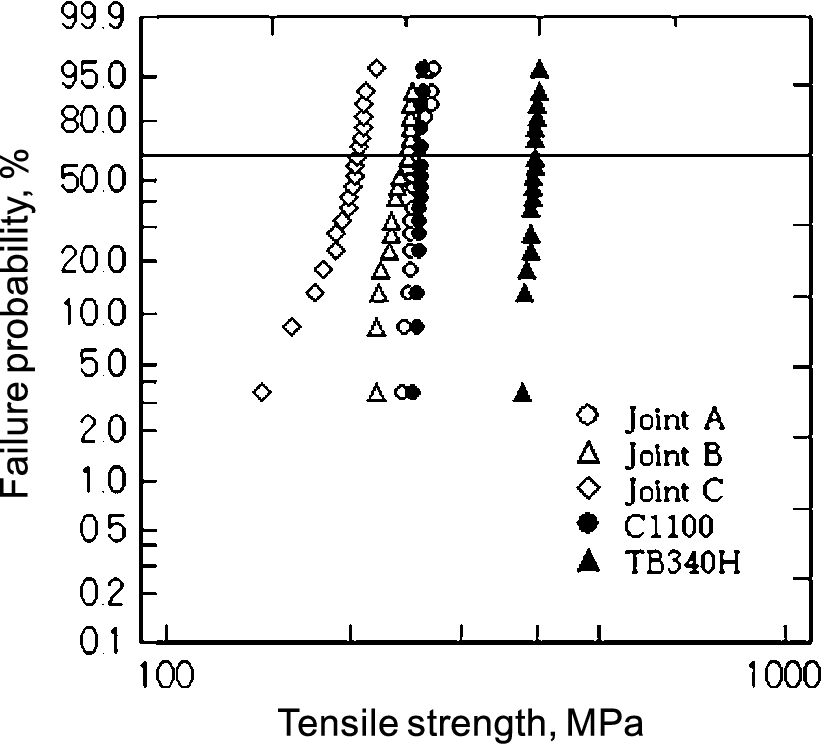
Tensile strength distributions of joints and base metals plotted on Weibull probability paper.
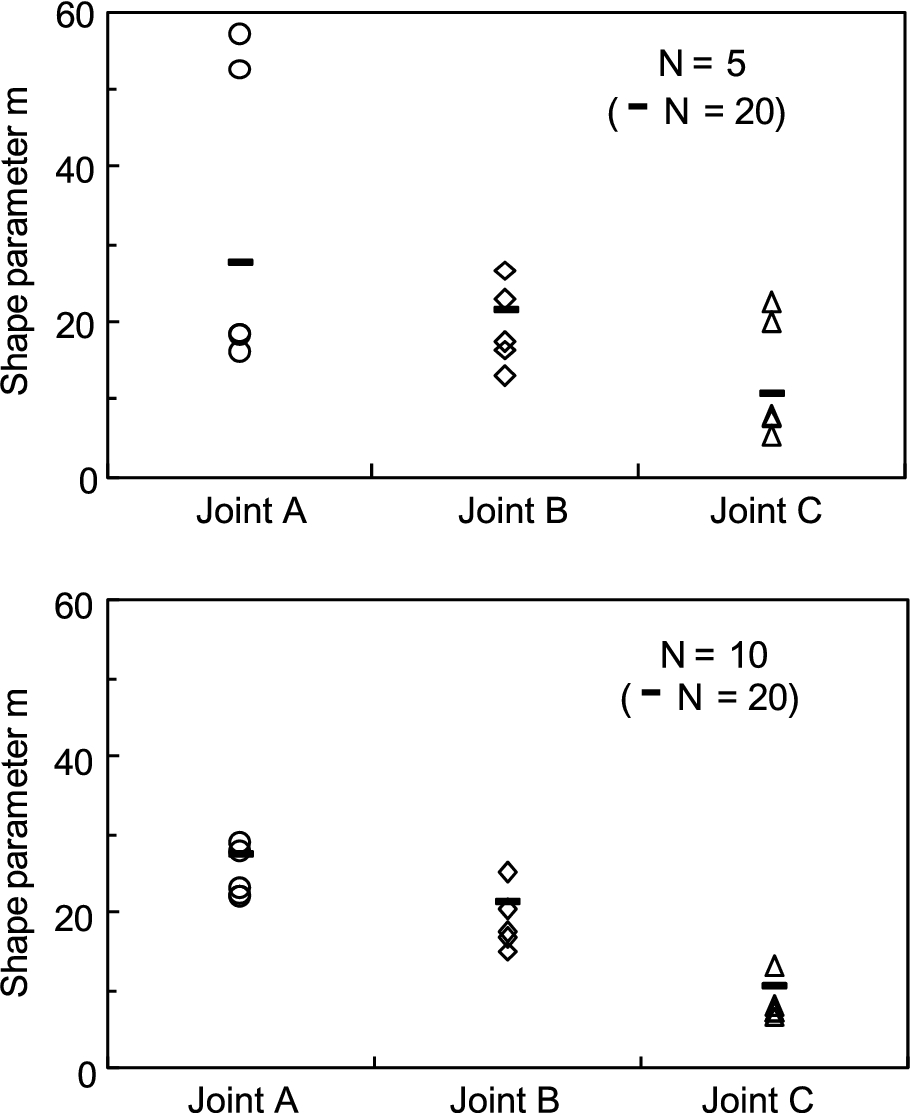
Comparison of shape parameters calculated from 20, 10 and 5 specimen pieces of data.
The hardness distribution of the joints was measured along a line 3.5 mm from the axial center by using a Vickers hardness tester. The hardness distributions of joints A–C are shown in Fig. 3. The copper near the weld interface of the joints softened; the softened area of joints A and B, welded under short friction time, was 4 mm, and that of joint C, welded under long friction time, was 6 mm. SEM images at the weld interface of the joints are shown in Fig. 4. Although the mixing layer of C1100 into TB340H is observed in joint C, no mixing layers are observed in joints A and B. The EPMA line scanning profiles at the weld interface of joints A and C are shown in Fig. 5. Although an intermetallic layer consisting of titanium and copper is observed in joint C, no intermetallic and diffusion layers are seen in joint A. This is probably because the intense plastic deformation by applying high pressure, and the welding under a long friction time resulted in the mixing of TB340H and C1100 in joint C. In the friction welding of dissimilar metals, the thick intermetallic layers and mixing layers formed at the weld interface are accompanied by a loss in strength [5,6]. This is the reason that the tensile strength of joint C is low.
Tensile tests were conducted on 20 pieces of test specimens of joints A–C and the C1100 and TB340H base metals. The mean values of the tensile strength of joints A–C were 253 MPa, 239 MPa and 195 MPa (98%, 93% and 76% joint efficiency for the C1100 base metal), respectively. The appearances of the tensile-tested specimens and the tensile-fracture surfaces in the TB340H side of the typical tensile-fracture patterns are shown in Fig. 6. In joint A, 14 test specimens fractured in the C1100 side near the weld interface (Fig. 6(a-1)) and 6 test specimens fractured in the C1100 side apart from the weld interface (Fig. 6(a-2)). In joint B, 6 test specimens fractured in the C1100 side near the weld interface (Fig. 6(b-1)) and 14 test specimens fractured at the weld interface in the peripheral region and in the C1100 side near the weld interface at the axial center (Fig. 6(b-2)). It is clear that the weld of joint A is more sound than that of joint B. In contrast, all of joint C fractured at the weld interface, and the welding surface is observed on the fracture surface. It is clear that the weld of joint C is poor.
The tensile strengths of the joints and the base metals were plotted on Weibull probability paper, as seen in Fig. 7. The tensile strength of joints decreased and the dispersion in the data increased in the order A, B and C. Although the tensile strengths of the base metals are high and the dispersion in the data of the base metals is small compared with that of the joints, little difference is seen in the data between joint A and the C1100 base metal. The shape parameter m of the Weibull distribution shows the gradient, that is, the dispersion in the data. The shape parameters of joints A–C and the C1100 and TB340H base metals are 27.8, 20.3, 10.0, 57.0 and 125.6, respectively. These results are the same as those in our previous study [1–3], in which the shape parameter increased with an increase in mean value of the tensile strength and with a decrease in dispersion of the tensile strength.
Evaluation with less than 20 pieces of test specimens
From the viewpoint of the reduction of data, 5 and 10 pieces of test specimens were randomly extracted from the 20 pieces for 5 times each. The extracted data were evaluated by the Weibull distribution, and the shape parameters obtained were compared with those of the 20 pieces. The shape parameters obtained from the Weibull analysis of 5 data values and 10 data values are shown in Fig. 8; the dash (“-”) in this figure is the shape parameter calculated from 20 data values. The mean values of the shape parameter (the standard deviations) of joints A–C calculated from 5 data values are 32.5 (20.4), 19.2 (5.46) and 12.6 (7.94) respectively, and those from 10 data values are 25.0 (3.33), 19.1 (3.94) and 8.6 (2.55), respectively. The dispersions of the shape parameter calculated from 5 data values are larger than those from 10 data values. Especially, the shape parameter of joint A, which was welded under appropriate conditions, considerably dispersed in 5 data values. This is probably because of the lack of data. In contrast, the dispersion of the shape parameter calculated from 10 data values of all joints was small. It appears that it is necessary to estimate 10 data values for judging the suitability of friction welding conditions under the friction welding conditions in the present study.
Fatigue test
S–N curves and P–S–N curves
S–N curves of joints A–C and the C1100 base metal are shown in Fig. 9. The fatigue strength of joint A is higher than those of joints B and C, and little difference is seen in the fatigue strength between joints B and C. Although the fatigue strengths of the joints are lower than that of the C1100 base metal, the difference in fatigue strength decreases with a reduction in repeated stress. The fatigue limits of joints A–C were 102 MPa, 97 MPa and 97 MPa (97%, 92% and 92% joint efficiency for 105 MPa, the fatigue limit of the C1100 base metal).
Next, the fatigue tests of 10 pieces of joints A–C were conducted at stress levels that were 1.1-fold and 1.3-fold the fatigue limit. P–S–N curves of the joints are shown in Fig. 10. The failure probability curves of joints B and C spread as the stress level decreases; that is, the fatigue life distribution of these joints disperses at a low stress level. In contrast, the failure probability curves of joint A are almost parallel. This shows that the fatigue life distribution of joint A was stabilized regardless of stress level. Typical sections of fractured paths after fatigue testing are shown in Fig. 11. A crack grew from the upper part to the lower in Fig. 11. All of joint A fractured in the C1100 side near the weld interface. This shows that the weld of joint A was good. In joint B, as found in joint A, 18 test specimens fractured in the C1100 side near the weld interface, 1 test specimen of the high stress level fractured at the weld interface and in the C1100 side near the weld interface (Fig. 11(b-1)), and 1 test specimen of the low stress level fractured in the C1100 side apart from the weld interface (Fig. 11(b-2)). In joint C, each 5 test specimens of both the high and low stress levels fractured at the weld interface (Fig. 11(c-1)), and the remaining 5 test specimens fractured in the C1100 side apart from the weld interface (Fig. 11(c-2)). This is because the weld of joint C was poor and the softened area was wide.
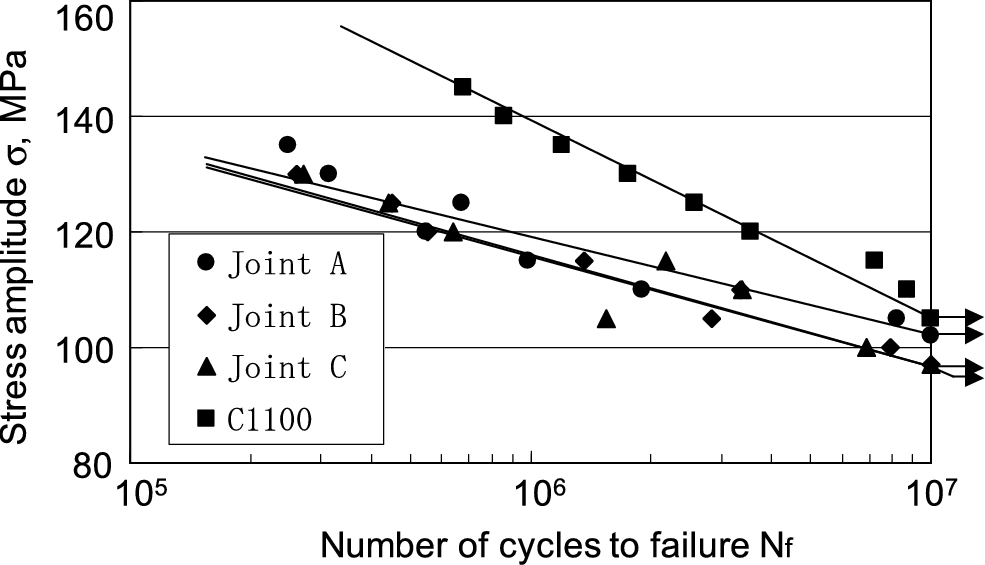
S–N curves of joints A–C and C1100 base metal.

P–S–N curves of joints A–C.
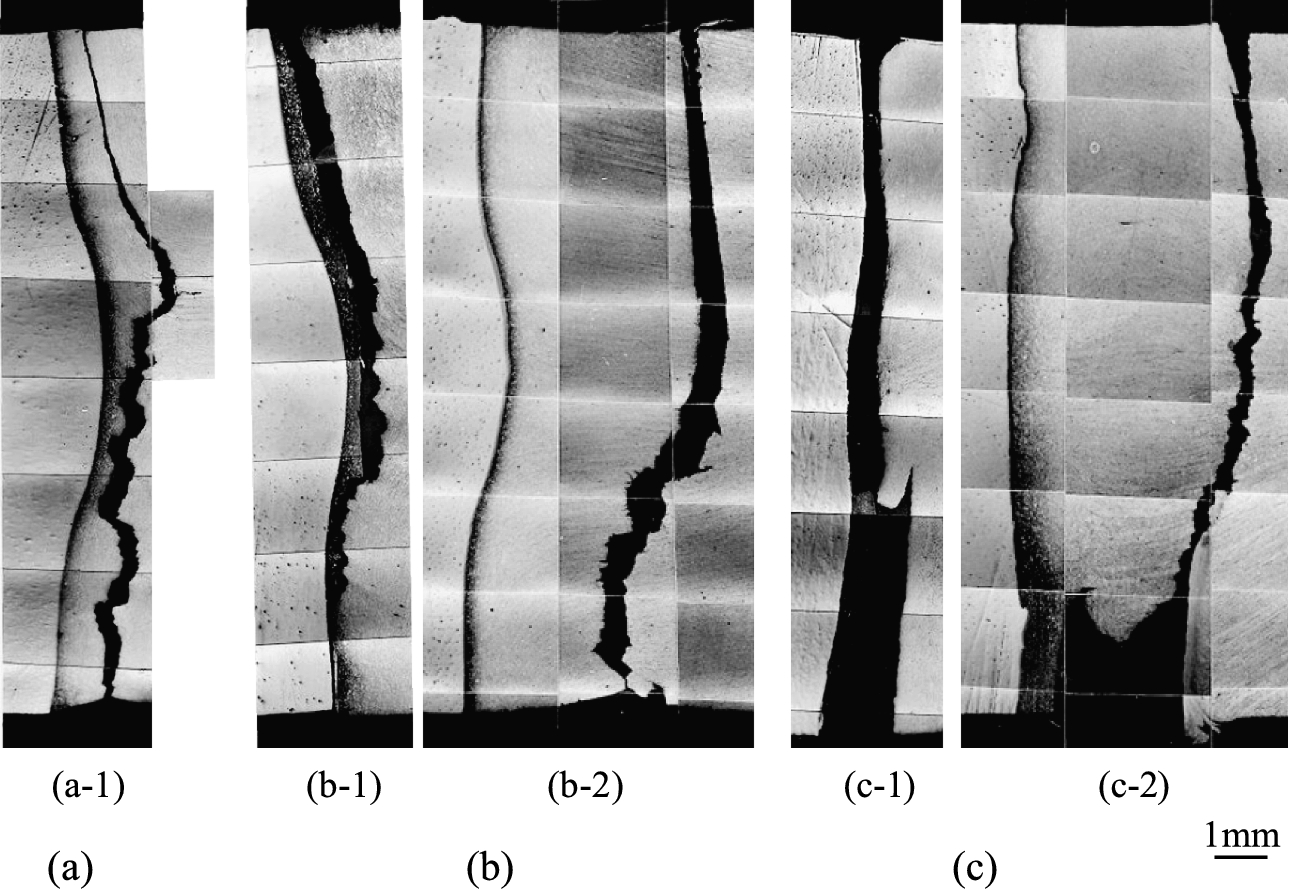
Sections of fractured paths after fatigue testing (left side: TB340H, right side: C1100). (a) Joint A. (b) Joint B. (c) Joint C.
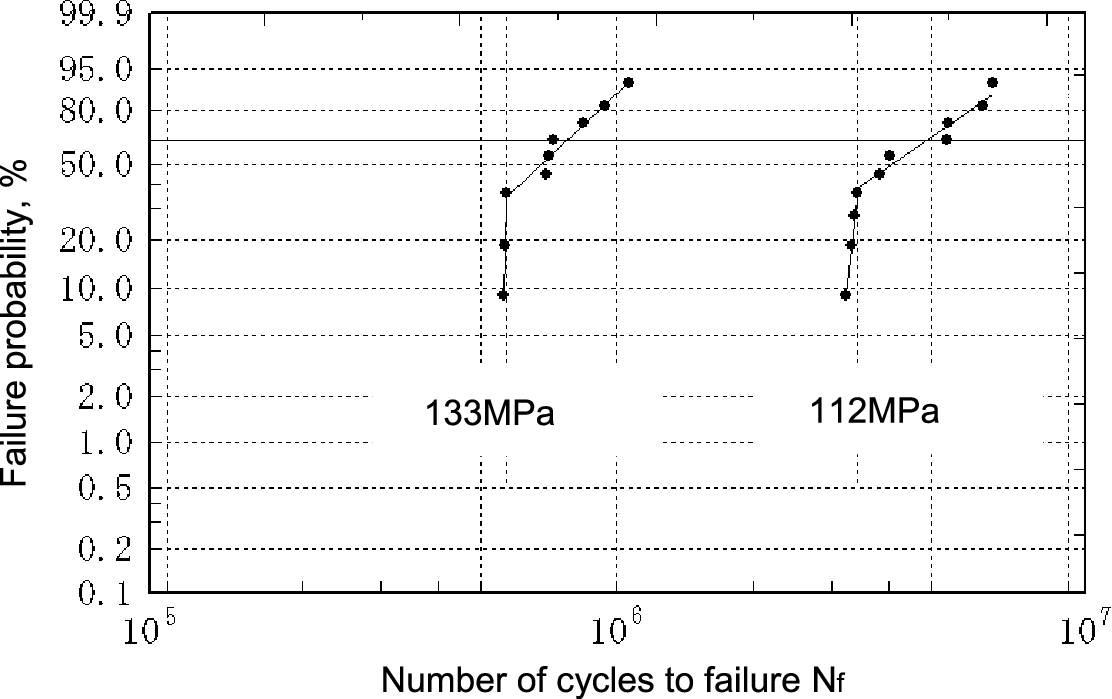
Fatigue life distributions of joint A plotted on Weibull probability paper.
The fatigue strengths of joints A–C were plotted on Weibull probability paper, as seen in Figs 12–14. The failure probability curves consist of two regression lines: the low cycle side and the high cycle side at both the high and low stress levels in all joints. The shape parameters of the Weibull distribution, that is, the gradient of the regression lines, are listed in Table 4. In joint A, the gradient of the regression lines of the low cycle side at both the high and low stress levels was considerably large and almost parallel with the Y axis. This shows that joint A was hard to fracture at less than these low cycles, that is, the threshold cycle [7,8]. The shape parameters of the low cycle side of joint A were considerably large compared with those of the high cycle side of joint A or those of joints B and C, as seen in Table 4. It appears that joint A is suitable for practical use because the guaranteed fatigue life is clear. In joint B, the failure probabilities of the high cycle side at both the high and low stress levels were larger than those of the low cycle side; that is, the shape parameters of the high cycle side were large compared with those of the low cycle side. Although it is possible to expect the cycle in which the failure increases (boundary between the low cycle side and the high cycle side), the guaranteed fatigue life could not be clearly estimated. In joint C, differences between the failure probabilities of the low cycle side and those of the high cycle side at both the high and low stress levels were small, and the shape parameters were small. In general, the fracture at the low cycle is caused by the initial failure (the weld defect) [9]. It appears that joints B and C are not suitable for practical use. These results demonstrate that it is possible to estimate the guarantee fatigue life of a sound joint by the Weibull distribution, and the shape parameter is useful for judging the suitability of friction welding conditions in the fatigue tests as well as in the tensile tests.
The joint performance of joint A was suitable in both the tensile test and the fatigue test. Its tensile strength and its fatigue limit were almost the same as those of the C1100 base metal. The joint performance of joint C was poor in both the tensile test and the fatigue test. Although the tensile strength of joint B was somewhat poor compared with joint A, the fatigue strength of joint B was almost the same as that of joint C.
Conclusion
TB340H commercial pure titanium was friction-welded to C1100 tough pitch copper, and the tensile strength and the fatigue strength of the joints were statistically investigated. The results are as follows.
(1) Although the intermetallic layer and the mixing layer consisted of titanium and copper formed at the weld interface in the poor joint, no layers formed in the sound joint.
Shape parameters of the joints
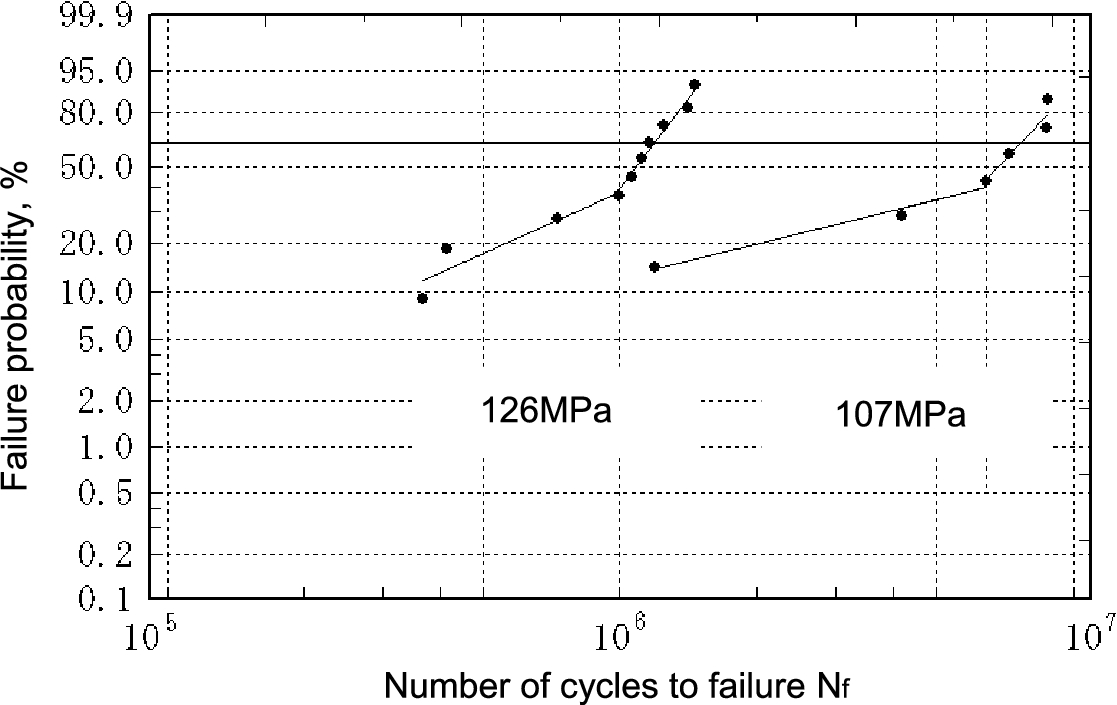
Fatigue life distributions of joint B plotted on Weibull probability paper.
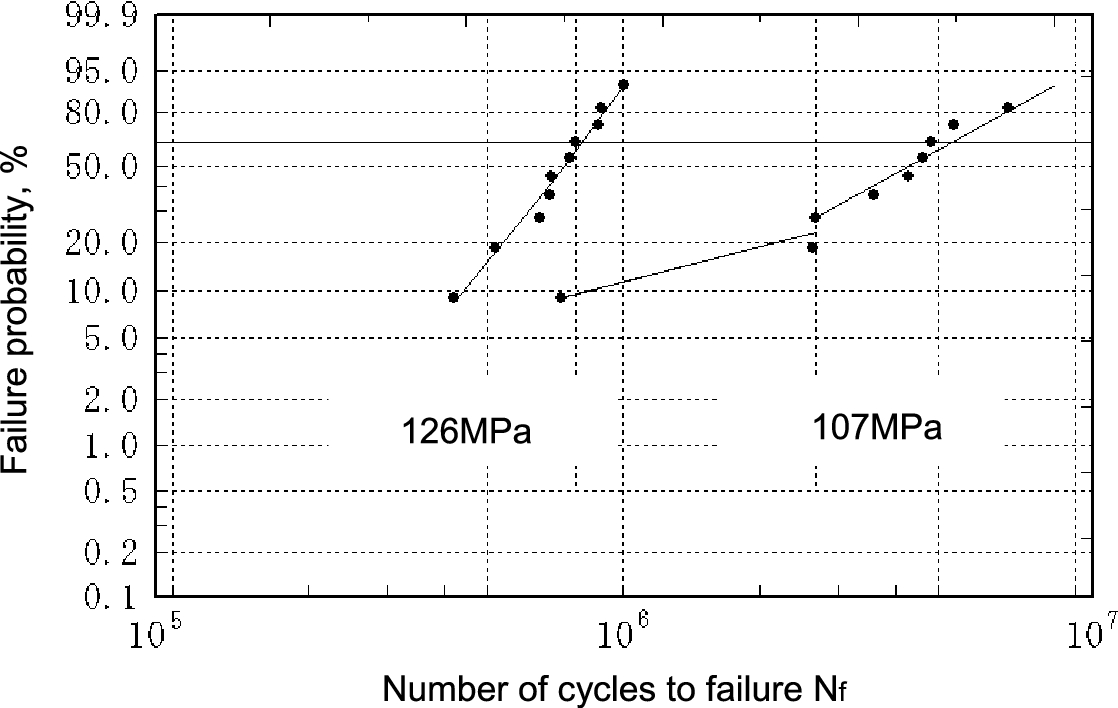
Fatigue life distributions of joint C plotted on Weibull probability paper.
(3) The fatigue life distribution of the joints could be estimated from statistical investigation of the fatigue strength data. In the poor joint, the failure probability curves spread as the stress level decreased; that is, the fatigue life distribution dispersed at the low stress level. In contrast, the failure probability curves of the sound joint were almost parallel, and the fatigue life distribution was stabilized regardless of stress level. It is possible to estimate the guarantee fatigue life of the sound joint by the Weibull distribution.