
Abstract
Background:
Fatigue strength is an important parameter of evaluating the material fatigue property. There are many prediction models for fatigue strength in the VHCF regime. Murakami’s model is extensively applied in numerous prediction models. The initiation mode of VHCF cracks in high strength steel is very different from the assumption in Murakami’s model that the internal inclusion is considered as a disc crack.
Objective:
We tried to analyze the effect of inclusion shape on the prediction by Murakami’s model and further examined the prediction effects of several generalized models.
Methods:
We reviewed the prediction models for fatigue strength in the VHCF regime. On the assumption that the fatigue crack which initiated from the internal inclusion is a circumferential crack around a spherical cavity and crack propagation is the critical condition, we modified Murakami’s model. The predicted values of Murakami’s model, the modified model and Liu’s model were compared with the test results of 28 groups of high strength steel in the literature.
Results:
The deviations between predictions by several generalized models and test results are mostly within 20%. The predicted values of four groups of high strength steel by the modified and Murakami’s models and six groups of high strength steel by Liu’s model have large deviations from the test results. The predicted fatigue strength values of Liu’s model are higher than that of the modified model, and the predicted values of the modified model are slightly higher than that of Murakami’s model. The mean value of fitting coefficient C of all types of high strength steel is closer to the coefficient of the modified model, and the sums of squares of coefficient deviations of the modified model is smaller than that of Murakami’s model.
Conclusions:
The effects of inclusion shape on the prediction of fatigue strength in the VHCF regime seem small. Murakami’s model, the modified model and Liu’s model coincide well with the test results in the literature. The prediction effect of the modified model is higher than that of Murakami’s model, and the prediction effect of Murakami’s model is higher than that of Liu’s model.
Introduction
According to the category of fatigue cycles, there are three types of fatigue: low, high, and very high cycle. Cracks usually initiate from the surface in low and high cycle fatigue regimes, and from the internal inclusion in very high cycle fatigue (VHCF) regime [1–6]. Fatigue strength is an important parameter of evaluating the material fatigue property, and it plays a significant role in the study of the fatigue mechanism and design of long fatigue life. The fatigue strength can be obtained from fatigue tests or predicted by relevant theories and models. However, fatigue testing usually consumes considerable manpower, materials, and financial resources, so it is necessary to search for relevant prediction models for fatigue strength in the VHCF regime. Many studies have been done in this area and some valuable prediction models that predict very high cycle fatigue strength through the inclusion size have been proposed [7–11]. Murakami et al. [12–14] combined the parameters of fatigue strength, Vickers hardness and the square root of inclusion or defect projection area to give an equation for predicting the fatigue strength. Wang et al. [8] incorporated the fatigue life into Murakami’s model. Liu [9] proposed an expression to predict the fatigue strength of high strength steel in the VHCF regime according to the effect of hydrogen during forming a highlight area around the inclusion. Chapetti [10] proposed a simple model to estimate the fatigue strength in the VHCF regime, and the fatigue strength is obtained from the threshold for pure fatigue crack propagation and the inclusion size where the crack initiation takes place. Sun [11] proposed a model for predicting the fatigue strength of high strength steel with fish-eye mode failure based on the test results for the effect of inclusion size and stress ratio. To some extent, these empirical models reflect the fatigue mechanism in the VHCF regime. Murakami’s model is extensively applied in numerous prediction models for fatigue strength in the VHCF regime because there are few physical parameters and they are easily measured [12–14].
VHCF cracks in high strength steel usually initiate from the interface of matrix-inclusion due to debonding, and the inclusion shows no cracking [15]. This initiation mode is very different from the assumption in Murakami’s model that the internal inclusion is considered as a disc crack. In fact, Murakami conducted relevant tests and explained the equivalence of defect and crack with an identical projected area for the prediction of fatigue strength [16]. In this paper, we tried to analyze the effect of inclusion shape on the prediction by Murakami’s model and further examined the prediction effects of several generalized models. We took account of the effect of inclusion shape and modified Murakami’s model, and the predicted values of several generalized models were compared with the test results in the literature.
The review of prediction models for fatigue strength in VHCF regime
Many studies have been done in the prediction models for fatigue strength in VHCF regime and some valuable prediction models have been proposed [7–11].
Murakami et al. [12–14] proposed a model to predict the fatigue strength by linear elastic fracture mechanics. This model involved hardness, inclusion size, and fatigue strength. In Murakami’s model, a small flaw or inclusion is assumed as a disc crack in the infinite volume, and the crack propagation on the inclusion boundary as the critical condition. The fatigue strength of high strength steel with nonmetallic inclusions can be expressed as:
In the situation of a crack initiating from an internal inclusion, Eq. (1) can be written as:
Murakami’s model involving the stress ratio R can be written as:
Wang et al. [8] incorporated the number of cycles to failure into Murakami’s model and proposed:
Liu [9] proposed a model to predict the fatigue strength of high strength steel in VHCF regime based on the effect of hydrogen during formation of granular bright facet (GBF):
Akiniwa et al. [17] assumed that Paris relations was still valid for the fatigue crack propagation in fine granular area (FGA), and derived an approximate relation for the fatigue strength and the number of cycles to failure:
The parameters
Chapetti et al. [10] showed a relation between FGA size, inclusion size and the number of cycles to failure in the form of
Mayer et al. [18] pointed out that a relationship between the stress amplitude, the fatigue life and the inclusion size:
Sun [11] proposed a model for predicting the fatigue strength of high strength steel with fish-eye mode failure based on the test results for the effect of inclusion size and stress ratio. In the model, the effect of inclusion size and stress ratio on fatigue strength is expressed as:
It is seen that, for several models (Eqs (1), (4), (5) and (7)) mentioned above, the parameters in models are determined, while for the other models (Eqs (6), (8) and (9)), several parameters in models are changing with types of materials. Although the parameters in Eqs (4) and (7) are determined, and relevant parameters are determined by fitting the fatigue data of specific materials. In a word, only Murakami’s model and Liu’s model are more generalized and can directly predict the fatigue strengths of different types of high strength steel. The prediction effects of Murakami’s model and Liu’s model are examined in the following part.
The modified model involving effects of inclusion shape
The phenomenon of VHCF cracks in high strength steel that initiate from the interface of matrix-inclusion due to the debonding and inclusion without cracking is in accordance with the usual initiation mode of internal cracks in high strength steel, which was mentioned by Tanaka et al. [15,19]. For example, the VHCF studies of high strength steel such as TT150, TT180 by Hong et al. [20], and FV520B-I by Zhang et al. [21] show the initiation character of internal cracks. The crack origins are shown in Figs 1 and 2. In Hong’s and Zhang’s studies, TT150 and FV520B-I were tested by the ultrasonic fatigue test method with a symmetrical tension–compression load, and TT180 was tested by the rotary bending fatigue test method.

VHCF crack origins of TT150 and TT180. (a) TT150 (
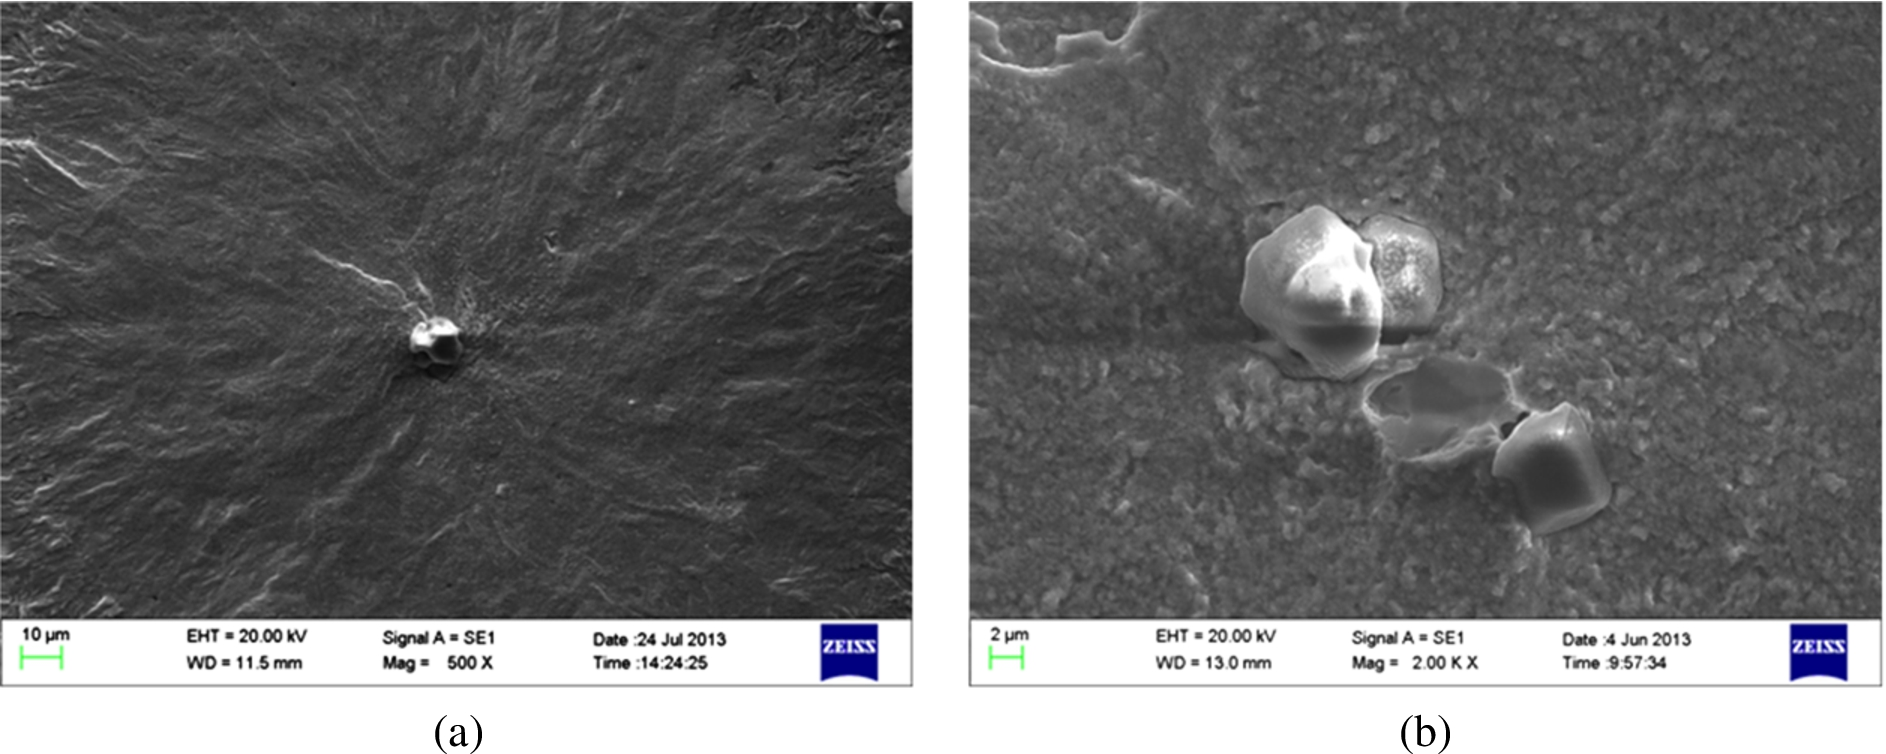
VHCF crack origins of FV520B-I. (a) Initiation from single inclusion (
The above initiation mode is very different from the assumption in Murakami’s model that assumes an internal inclusion as a disc crack. Therefore, Murakami’s model was modified based on the assumption that a VHCF crack initiates from the internal inclusion is a circumferential crack around the spherical cavity and the propagation of the crack is the critical condition.
Assume the inclusion after debonding as a spherical cavity in infinite volume, and the radius of a spherical cavity is a. There is a circumferential crack around the spherical cavity and the circumferential crack length is
According to the test results, the threshold of stress intensity factor range
Assume that the stress intensity factor range
Then the stress amplitude which the specimen suffered is equal to the fatigue strength, and the fatigue strength is determined by Eqs (10)–(13):
FV520B-I fatigue strength estimations with different values of λ
The fatigue strength greatly varies with different values of λ in Table 1, so the determination of λ is important to estimate the fatigue strength.
When the size of the spherical cavity is constant, the value of λ depends on the length of the circumferential crack around the spherical cavity. It is assumed that λ is determined by the fatigue crack initiation size and the crack size in the initiation process does not reach the threshold size of crack propagation. Then the crack in the initiation process is not propagated. So through estimating the initiation size of a fatigue crack, the characteristic parameter λ can be determined and the modified model is obtained. For the initiation mechanism of fatigue crack, Dowling [23] assumed that a fatigue crack initiating from the notch root is under the control of the local stress strain field at the beginning stage, and it changes to be under the control of the nominal stress strain field as the crack propagates to a characteristic length, and that the fatigue crack initiation size is defined as the size when the crack is at the transition demarcation point. On the premise of the definition of fatigue crack initiation by Dowling, we analyzed the situation of a circumferential crack around a spherical cavity. When the circumferential crack is short, the crack is under the control of the local stress strain field caused by the spherical cavity, and
The crack initiation size is determined by the intersection of Eqs (10) and (15) [23], and then we can determine the characteristic parameter
The characteristic parameter λ is determined by the inclusion shape and λ equals 0.164 for the spherical inclusion.
Then Eq. (14) can be simplified as:
The expression of the modified model is similar to Murakami’s model, and the coefficient of the modified model is slightly higher than that of Murakami’s model.
VHCF test results of relevant high strength steel
The results of VHCF tests and other relevant tests of 28 groups of high strength steel were found in the literature [8,19,21,25–30], as shown in Table 2.
The test results of 28 groups of high strength steel
The test results of 28 groups of high strength steel
Note: The inclusion diameters of the 1st–17th and the 25th group specimens are the average size measured by the metallurgical method. The inclusion diameters of the 18th–24th and the 26th–28th group specimens are the maximum size on fatigue fractures.
Figure 3 shows the relationship between tensile strength
Generally, the axial fatigue limit of smooth specimens (
Figure 4 shows the relationships between fatigue strength
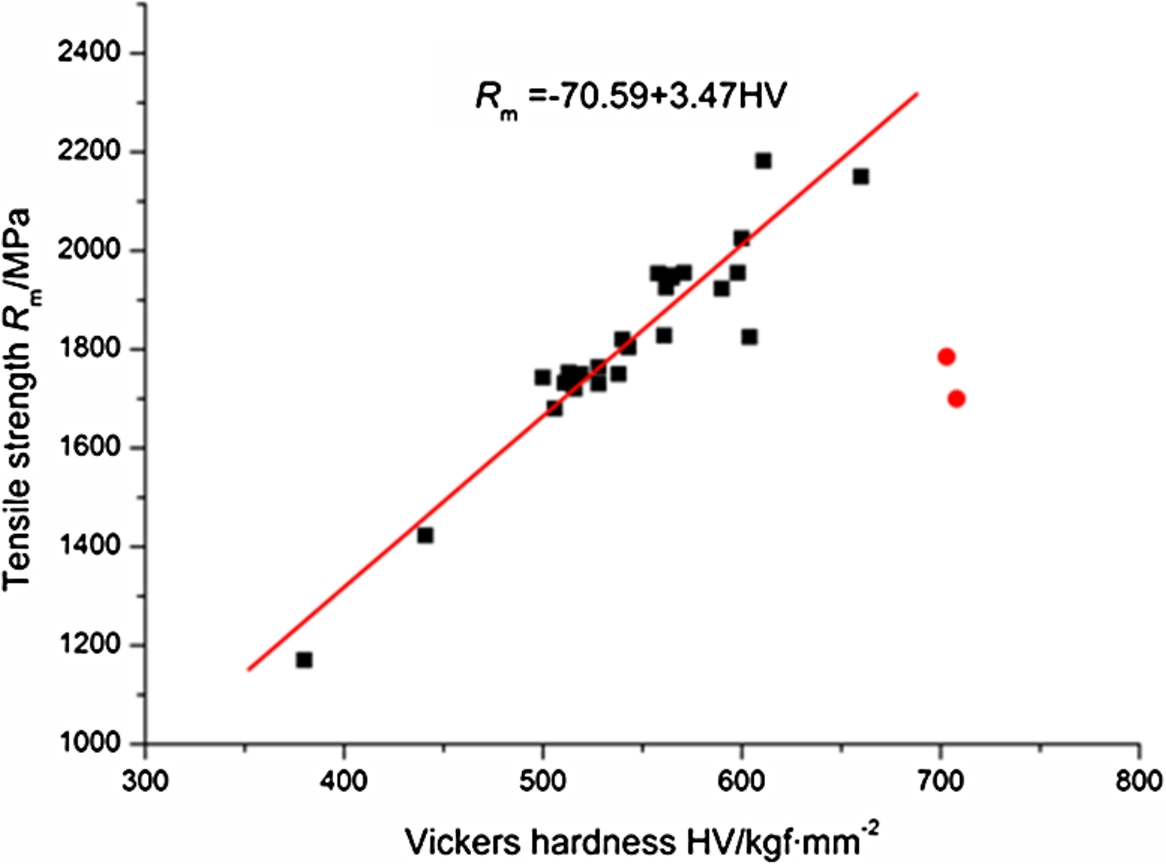
The relationship between tensile strength and Vickers hardness.
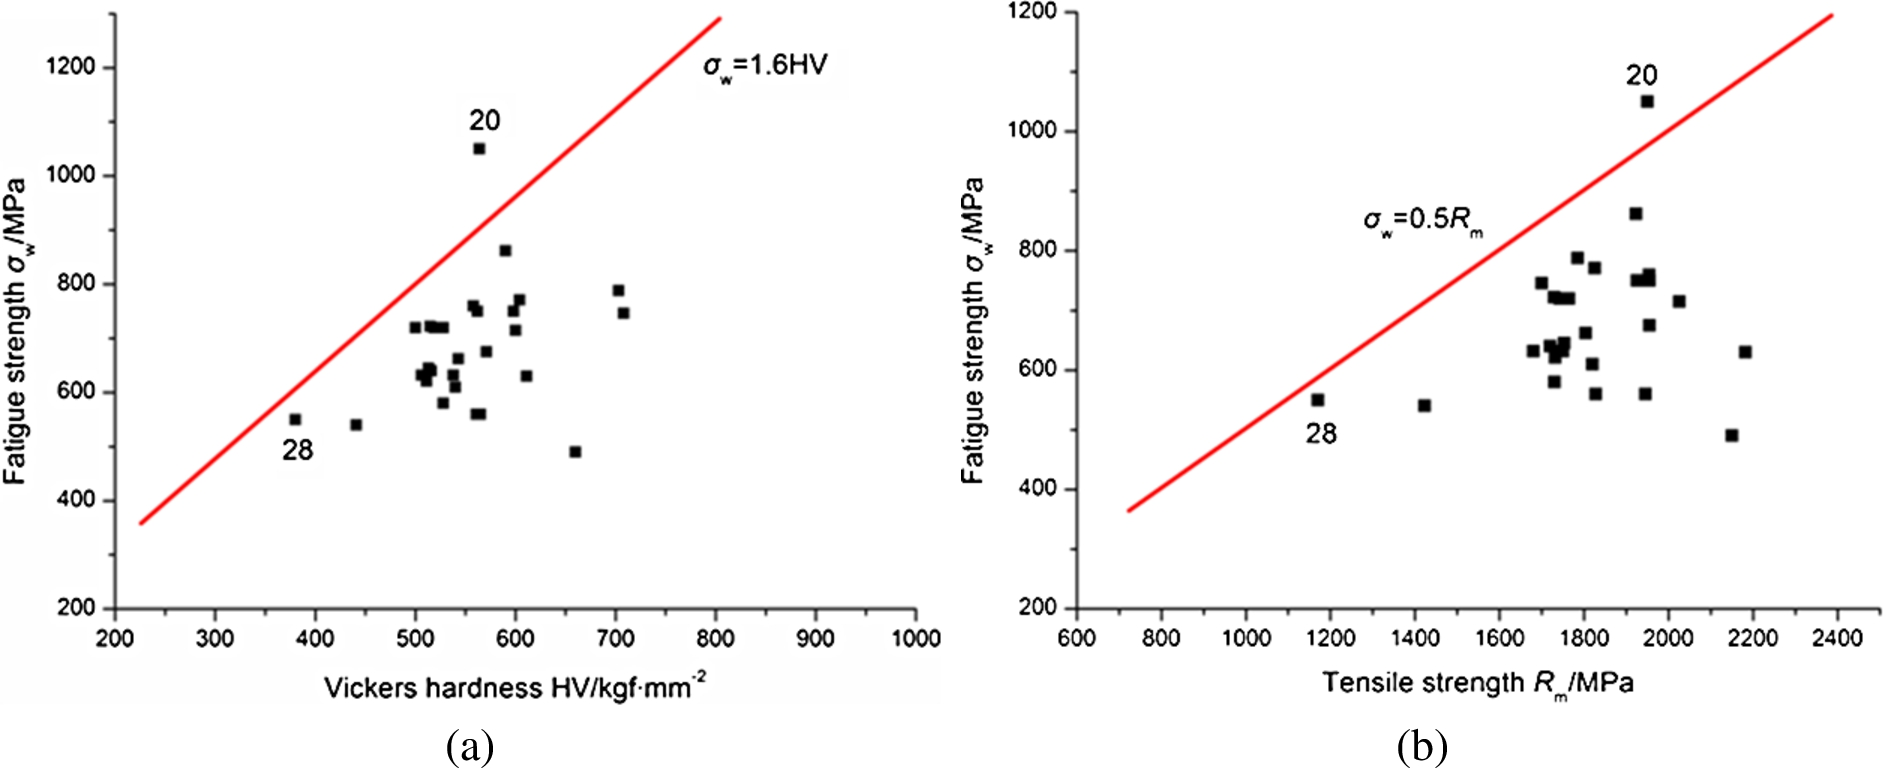
The relationships between fatigue strength and Vickers hardness and Tensile strength (the numbers of test points in the figure are the serial numbers in Table 2). (a) The relationship with Vickers hardness. (b) The relationship with Tensile strength.
We predicted the fatigue strength values in the VHCF regime of 28 groups of high strength steel by Murakami’s model, the modified model and Liu’s model. The predicted values are compared with the test results as shown in Figs 5 and 6, respectively.
Though there are some differences in chemical composition, mechanical properties, cycles, specimen diameter, inclusion detection method, and inclusion size among above 28 groups of high strength steel. Figure 5 shows that both of the modified model and Murakami’s model adequately predict the fatigue strength values in the VHCF regime of high strength steel and the deviations between predictions and test results are mostly within 20%. The predicted values of the 17th group, 54SiCr6, the 20th group, SCM435H, the 21th group, SNCM439, and the 24th group, SUP10M, by the modified and Murakami’s models have large deviations from the test results. For the 54SiCr6 specimen, its inclusion diameter is less than 1 µm, which belongs to ultraclean steel, and its fatigue cracks mostly initiate from the surface in the VHCF regime, so there are some big deviations between the predicted values of the modified or Murakami’s model based on cracks initiating from internal inclusion and the test results. For SCM435H, Fig. 4(b) shows that the fatigue strength is 1050 MPa which is more than
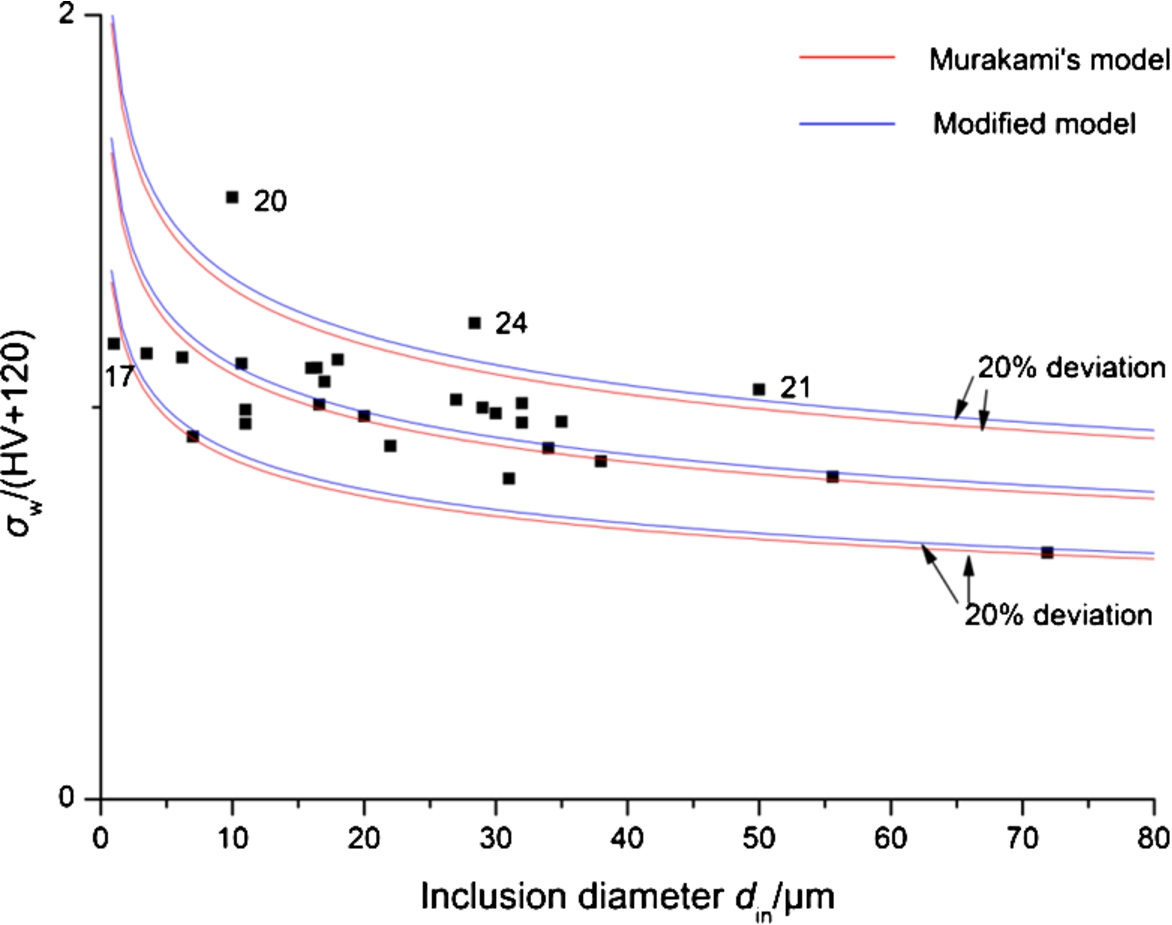
Comparison of Murakami’s model and the modified model predictions and test results (the numbers of test points in the figure are the serial numbers in Table 2).
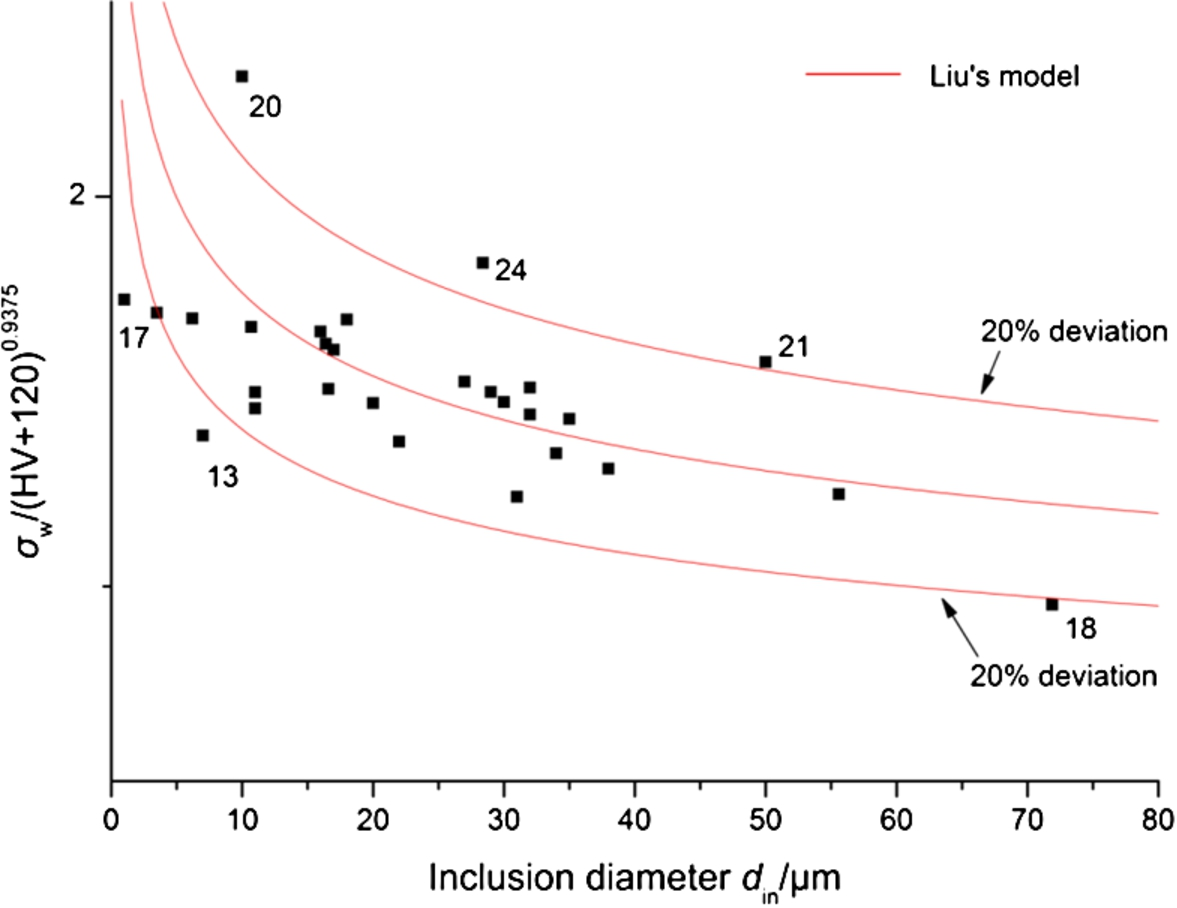
Comparison of Liu’s model predictions and test results (the numbers of test points in the figure are the serial numbers in Table 2).
In above 28 groups of high strength steel, there are 10 groups test results of high strength steel that are lower than the values predicted by Murakami’s model, and 18 groups are higher than the values predicted by Murakami’s model. In general, there is a tendency that the predictions of Murakami’s model are lower than the test result. The expression of the modified model is similar to the expression of Murakami’s model, and the coefficient of the modified model is slightly higher than that of Murakami’s model. So the predicted value of the modified model is slightly higher than that of Murakami’s model. In order to more effectively compare model predictions with test results, the test results of relevant high strength steel were fitted according to the expression
From Table 3, it can be seen that the mean value of fitting coefficients is 1.47 which is closer to the coefficient of modified model 1.45. We further computed the sums of squares of deviations between fitting coefficients and both model coefficients, and the sums of squares of deviations are 1.25 and 1.30 for the modified model and Murakami’s model respectively. The prediction values of the modified model seem closer to the test results of relevant high strength steel.
Figure 6 shows that Liu’s model adequately predict the fatigue strength values in the VHCF regime of high strength steel and the deviations between predictions and test results are mostly within 20% too. The more predicted values of the 13th group, 40CrNiMo, the 17th group, 54SiCr6, the 18th group, 0.46Carbon, the 20th group, SCM435H, the 21th group, SNCM439, and the 24th group, SUP10M, by Liu’s model have large deviations from the test results. The prediction effect of Liu’s model is lower than that of Murakami’s model and the modified model. And the relationships of predicted values by three generalized models and test results are shown in Fig. 7. The variation trends of predicted values by three models are similar to that of test results. The predicted values of Liu’s model are higher than that of the modified model, and the predicted values of the modified model are higher than that of Murakami’s model.
Fitting coefficient C of relevant high strength steel test results
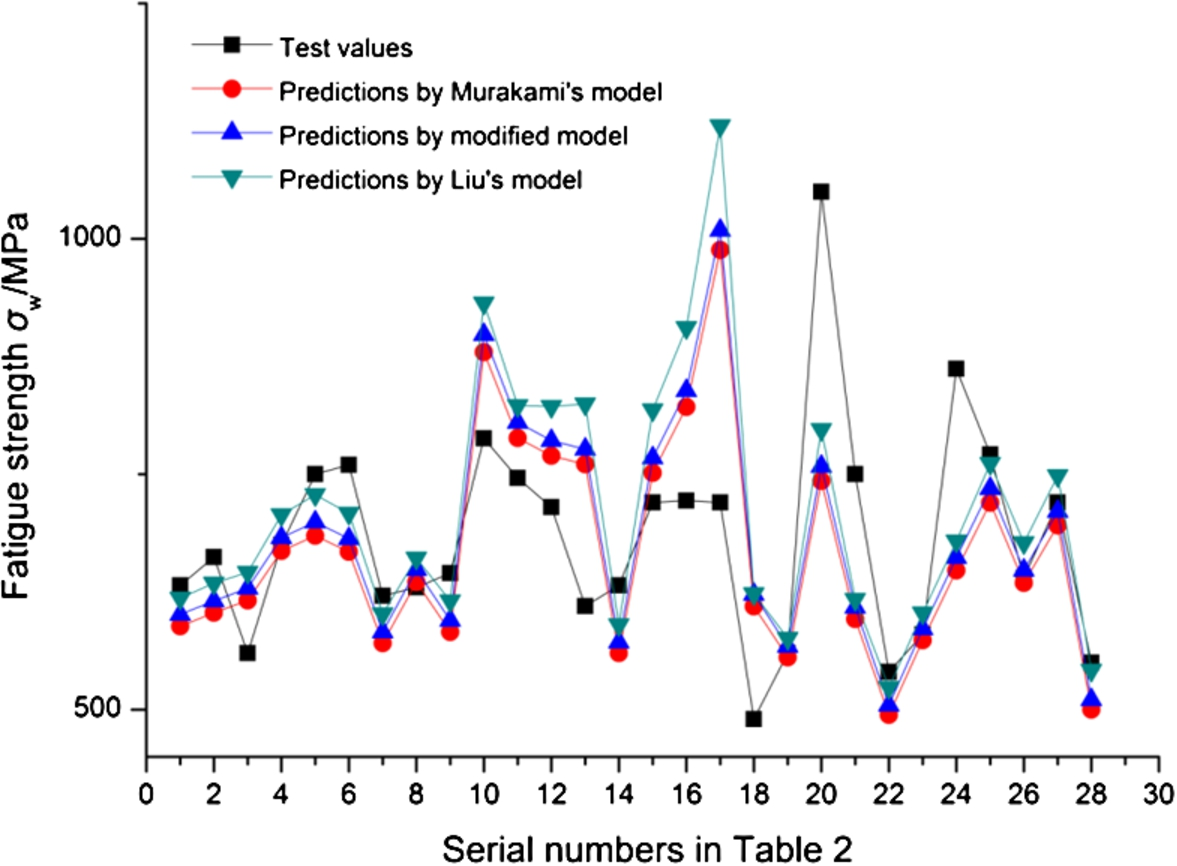
Comparison of model predictions and test results.
Murakami’s model and Liu’s model are more generalized and can directly predict the fatigue strengths in VHCF regime of different types of high strength steel. The effects of inclusion shape on the prediction of fatigue strength in the VHCF regime seem small. Murakami’s model, the modified model and Liu’s model coincide well with the test results in the literature. The prediction effect of Liu’s model is lower than that of Murakami’s model and the modified model. The predicted values of Liu’s model are higher than that of the modified model, and the predicted values of the modified model are higher than that of Murakami’s model. The predicted values of the modified model seem closer to the test results.
Footnotes
Acknowledgements
The authors gratefully acknowledge the financial support provided by the National Key Basic Research and Development Program (973 Program 2011CB013401). Thanks to Dr. Edward C. Mignot, Shandong University, for linguistic advice.
Conflict of interest
The authors have no conflict of interest to report.