



Abstract
A 3D finite element model, based on the combination of a creep model and a ductility exhaustion approach, is presented and validated on the basis of creep crack growth tests. The proposed model is used to characterize creep crack growth in a pressurized cylinder with an axial crack on the inside surface. A canoe shaped distribution of stress triaxiality, that directly affects the creep damage, is found and investigated. The damage evolution is observed at different crack tip locations, showing a dependence on the crack geometry and loading conditions.
Introduction
In power plant pipes, a surface crack may exist in the form of a maximum size postulated defect, according to the non-destructive method applied for components qualification, or can develop in pres- ence of stress and/or temperature gradients due to creep damage accumulation. In recent years it is well known that, an excessive conservatism of the assessment codes produced a very few failures in parent materials. However, power generation industry demands for more accurate service life prediction of pipes under creep conditions also in presence of defects. The continuous improvement of power plant performances such as operating at higher temperatures in order to increase the efficiency of energy conversion, strongly calls for more safety requirements of materials and structures. On the same point of view, extending the residual life of plants requires reliable criteria to manage the replacement of high temperature and pressure piping in order to avoid the risk of premature or catastrophic failures.
The engineering use of the fracture mechanics parameters for structural assessment needs proper analyses to account for the change of the creep crack tip constraint, that significantly affects the material toughness, in the presence of a crack front [1]. The use of state-of-the-art numerical models to analyze creep accumulation and crack growth in different standard geometries of laboratory specimens [2,3] can provide a fundamental framework to improve accuracy in life prediction of high temperature components and to guarantee a safe design.
Detailed finite element analysis of a cracked body allows to generalize the problem of an accurate estimation of a high temperature fracture mechanics parameter such as C(t) and of creep damage accumulation, along the crack front of a surface crack of finite size, under non-steady state creep conditions [4,5].
In the context of creep crack growth, three important simplifying assumptions imposed by the finite element numerical approach must be noted:
The creep constitutive law that is well known to be history dependent, but it is commonly assumed load history independent. Among the time dependent models, the one by Kachanov [6] uses a continuum damage mechanics approach to predict creep strain in both uniaxial and multiaxial conditions. Much later, Liu and Murakami [7], introduced a new approach based on micromechanics which also can be expressed in a multiaxial form. Both of them can be directly used to predict creep crack growth in cracked components. Among the strain dependent models, Graham and Walles [8] proposed an alternative approach based on the summation of three power laws to describe primary secondary and tertiary uniaxial creep behavior. Its non-explicit time-dependence through creep strain results in less time integration numerical issues during finite element simulations. Strain dependent models usually do not consider a damage variable in the creep strain rate definition. Constitutive and damage evolution laws are assumed to be uncoupled then the calculation of creep damage accumulation is treated separately from the finite element analysis. The damage parameters approach unity, when the local accumulated creep strain reaches a critical creep ductility value that accounts for the multiaxial stress state. This method, that involves the accumulation of the creep damage in the creep process zone ahead the crack tip, is better known as the ductility exhaustion approach, and was proposed by Cocks and Ashby [9] to predict rupture under creep crack growth conditions and later modified by Wen and Tu [10], in order to better estimate the cavity growth rates and improve the multiaxial creep ductility dependence on stress triaxiality. Finite element simulations of creep crack growth are based on a local approach: the damage, trespassing of a given threshold at a selected point located at the crack tip, governs crack propagation. Different techniques to represent crack propagation in a finite element framework involve algorithms to set the stiffness of the element at the crack tip close to zero, or to release displacement continuity constraints on nodes. In both cases the mesh refinement near the crack tip must be accurately studied to eliminate mesh dependence in the predicted stress field.
In this paper a numerical model set-up to describe the creep behavior of C(T) specimens [11] is extended to pressurized cylinders with a pre-existent defect operating at high temperature [12] made of P91 steel. The combination of the Graham–Walles model to represent the creep behavior and the Wen and Tu model to characterize the damage included in the finite element method allowed the estimation of the stress triaxiality distribution along the crack front, that is later studied as a function of the crack morphology, pressure conditions and a numerical estimation of the crack tip C(t) integral.
Theoretical background: C(t) integral
The theory behind the correlation of high temperature crack growth data is strictly related to one of elastic-plastic fracture mechanics. The crack tip stress and strain fields of ductile materials at high temperature can be related to the C(t) integral calculated at a contour line 𝛤 close to the crack tip [13]:
The relationship between the C(t) integral and the HRR stress fields found by Bassani and McClintock in their work is:
In Eq. (8) 𝛤 is an arbitrary line contour around the crack tip taken counter-clockwise from the crack lower surface to higher surface.
Describing creep crack growth by means of the C∗ integral under the hypothesis of EC conditions may be justified by the fact that at high temperature, the longest period of time is spent in steady-state creep.
However, a residual life estimation of a component, performed by just considering EC conditions, might be non-conservative because of a lower stress at the crack tip given by the stress relaxation that happens during SSC/TC conditions. The C(t) integral instead, is valid for the entire range of creep deformation covering SSC, TC, and EC, representing an attractive parameter to correlate creep crack growth rates. Anyway, its definition as a contour integral at a contour line 𝛤 → 0 (Eq. 1) represents a limitation with respect to its experimental determination on the basis of the load-line displacement under SSC and TC.
In this context, simulations may provide a numerical estimation of the C(t) integral for stationary cracks, but it might be worth considering that its estimation is very sensitive to the creep constants A and n and the instantaneous state of stress at the crack tip.
The power plant component under investigation is a steam pipe with a semi-elliptical internal surface crack longitudinally oriented (Fig. 1). The semiaxis (a and b) of the two examined elliptical cracks, Type 1 and Type 2, and the loading conditions are reported in Table 1. Two values of internal pressure Pi are considered, 25 and 35 MPa, and effects given by the presence or not of the axial stress 𝜎ax are investigated. The service temperature of the pipe is equal to 600 °C.
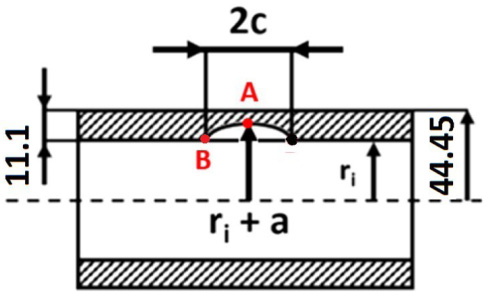
Geometry of the pressurized pipe proposed as a case study.
Original crack size and loading conditions of the pressurized pipe
The distribution of the normalized stress intensity factor along the crack front of both crack types is reported in Fig. 2 versus the normalized angular coordinate 𝜃, as calculated by FE linear elastic analysis.
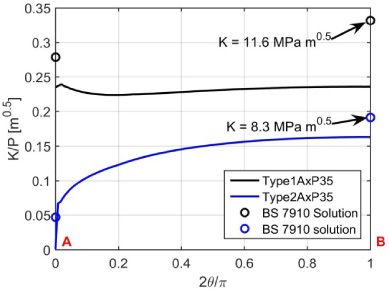
Normalized stress intensity factor distribution along the crack front, derived from numerical simulations and the BS7910 solutions.
At the deepest point along the crack front PointA and at the point on the surface PointB, the stress intensity factor calculated by the BS7910 solution [14] are reported for comparison and, as shown, significantly overestimate the numerical distribution. If the value calculate by the BS7910 at PointB of crack Type 1, at the pressure of 35 MPa, is expressed in absolute terms, a stress intensity factor 11.6 MPa m0.5 is found, while a value of 8.3 MPa m0.5 is calculated numerically. Therefore, it is worth noting that the range of the initial stress intensity factor assumed for laboratory creep crack growth tests,
The material analyzed in this study is a modified grade 91 steel that is designed to operate at 600 °C. All the experimental tests contained in this section have been performed on specimens extracted from the same pipe section. The elastic properties reported in Fig. 3 have been extracted from stress-strain records of a high temperature tensile test performed on cylindrical specimens.

Uniaxial stress-strain data of P91 at 600 °C.

Norton law fit of the steady state creep strain rate as a function of applied stress.
Uniaxial creep tests were performed at 600 °C at different stress levels ranging between 90 MPa and 160 MPa on round section specimens according to the ASTM E139-11 standard [15] with a diameter of 10 mm and a gage length of 50 mm. The steady-state creep strain rates
Creep crack growth tests were performed at 600 °C on 1/2 inch C(T) specimen according to ASTM E1457-15 standard [17] with an initial stress intensity factor ranging between 15.0 and 28.0 MPa m0.5. The specimen has been fatigue pre-cracked at room temperature, so that the initial crack length
The results expressed in terms of crack propagation as a function of time are shown in Fig. 5. As expected, tests performed at lower initial stress intensity factor last longer and the crack growth rate decreases with the initial stress intensity factor value.

Creep crack growth in P91 C(T) specimens tested at 600 °C.
The C∗ parameter was calculated by analyzing the experimental load-line displacement rate
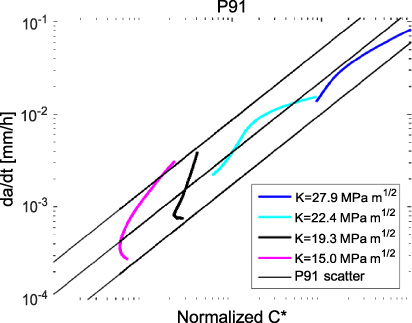
Creep crack growth rates correlation with the crack tip parameter C∗ in C(T) specimens of P91 at 600 °C.
The typical morphology of the creep crack growth for the material under investigation is shown in Fig. 7. Figure 7(a) shows the initial formation of voids that nucleate at grain boundaries and, usually, with a perpendicular orientation with respect to the orientation of the tensile stress. Figure 7(b) illustrates the voids coalescence that originates a grain-sized crack. After long exposure at high temperature, these micro-cracks link to each other causing the creep crack propagation shown in Fig. 7(c).

Creep crack growth morphology of P91 tested at 600 °C. Crack tip of the specimen tested at 22.4 MPa m0.5.
A good estimation of the HT resistance for a material represents a strong starting point for the residual life assessment of cracked components. The proposed numerical model is based on FE analyses per- formed with Abaqus 6.14. Dedicated user-defined Fortran subroutines have been developed to represent the creep behavior of the material, the creep damage, and the crack propagation.
Graham and Walles creep constitutive law
The simplified Graham–Walles creep model (Eq. 10), consists in the superposition of three power-laws to determine creep strain rate
The original model contains also a temperature dependency that, for the purpose of this work, was neglected because a reference temperature of 600 °C is considered. The Graham–Walles creep model was fitted to uniaxial creep data in order to determine the 9 material constants
Graham–Walles model material constants for P91 at 600 °C
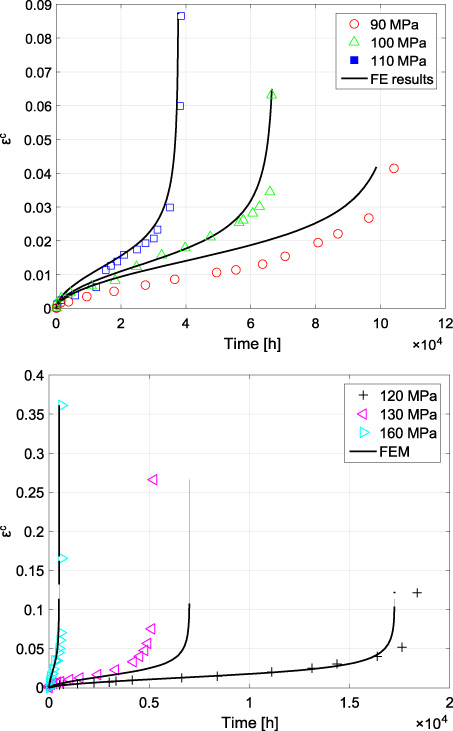
Graham–Walles FE model creep curves: comparison with experimental tests.
Once the creep behavior of the material is correctly described, CCG simulations requires an extension from uniaxial to multiaxial state conditions, and a formulation for the creep damage calculation. A ductility exhaustion approach was applied in order to be able to represent the creep damage even in cracked components that are affected by a multiaxial stress state close to the crack tip.
The ductility exhaustion approach considers the ligament ahead of the crack tip as a combination of multiple creep cylindrical specimens. As soon as one of these specimens reaches its creep ductility, it is no longer able to support stresses and therefore causes the crack to propagate. The Cocks and Ashby model [9] for intergranular fracture during power-law creep under multiaxial stresses calculates the ratio between multiaxial
Wen and Tu [19] proposed a modification of the Cocks and Ashby cavity growth model introducing a more accurate function to describe the theoretical void growth rate even at low levels of stress triaxiality. Following this approach, the creep ductility ratio of Eq. (12) becomes:
This formulation of damage is included in the user-defined subroutine USDFLD.for.
To model creep crack propagation, the increment of the current creep local damage (Eq. 15) is calculated at the crack tip at each time step of the FE analysis. The elastic modulus E is defined as a function of the user-defined field variable, i.e. the damage 𝜔. Thus, as soon as the damage 𝜔 at the integration points of the element at the crack tip reaches 0.99, the elastic modulus of the element is slowly reduced to a unitary value. With a unit value of elastic modulus, the element is no longer able to support any stress causing a crack propagation of the same size of the element size.
This algorithmic scheme was implemented in the same USDFLD.for user subroutine used for the creep damage calculation.
Calculation procedure
The FE analysis of the creep crack growth assumes the elastic-plastic properties of the Material at 600 °C (Fig. 3) and consists in two different time steps. The first is a static elastic-plastic step where the boundary conditions are applied and the initial stress intensity factor along the crack front is calculated. The second step is a visco-elastic-plastic step the user-defined subroutine CREEP.for is used to model the creep behaviour and the user-defined subroutine USDFLD.for is used to model the local damage accumulation at the crack tip and the crack propagation. In the second step there is a first stationary stage, before the starting of the crack propagation on the first element at the initial crack tip, and a second stage with propagating crack.
C(T) specimens data for FE simulations
C(T) specimens data for FE simulations
With the final aim to simulate creep crack growth of the axial cracks located on the inside surface of the steam pipe, the proposed creep crack growth model was validated by numerical simulations of the experimental creep crack growth tests on C(T) specimens.
Three initial stress intensity factor conditions were studied. The data for FE simulations are reported in Table 3. W, B, and B
n
are the dimension of the specimen, a0 is the initial crack size, K0 is the initial stress intensity factor, P is the applied load, and 𝛥
In order to fully replicate the laboratory tests a curvilinear crack front was designed in each model according to the experimental fatigue pre-crack size.
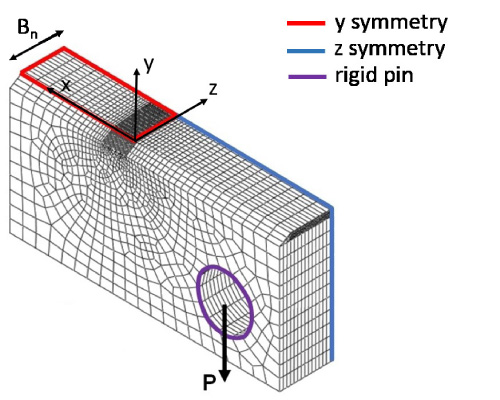
FE mesh and boundary conditions.

Mesh refinement along the curvilinear crack front.
A solid FE model was used to represent the correct constraint condition of the C(T) specimen used in the experimental tests. With this model, besides representing the correct conditions of plane strain and plane stress along the crack front, it is also possible to study the effects given by the presence of side grooves.
A fourth of the C(T) specimen was modeled using 3D hexahedral 8 nodes elements (Fig. 9). Symmetry boundary conditions were applied to the ligament and the midline sections. Hence the load P was applied to a reference point RF that was coupled to a rigid body coincident with the pin hole. Only vertical displacements on the load-line were allowed. The refined mesh, applied to a region with a length equal to 𝛥a c , is illustrated in Fig. 10. An element size of 100 μm was chosen because it is of the same order of magnitude of the average P91 grain size.
Creep crack growth model results on C(T) specimens
Several experimental and theoretical studies have shown that different geometries and loading configurations result in a different crack tip constraint distribution that governs creep crack initiation and propagation. The constraint effect is known to be related to the multiaxial state of stress around the creep crack-tip and can be described by a stress triaxiality factor (𝜎 h ∕𝜎 eq ) that can be calculated by FE analysis.
The effects of the initial stress intensity factor on the stress triaxiality have been studied along the crack front and on the uncracked ligament. Figure 11 shows the stress triaxiality, and the equivalent von Mises stress, along the crack front, at time t = 0 and at initiation time. At the beginning of the simulation the stress triaxiality in proximity of the side grooves exhibits a similar value for all the investigated stress intensity factors, and gradually increases while moving through the crack front. As expected, it reaches a maximum value on the plane strain section that is higher at higher initial stress intensity factor. At the initiation time the same stress triaxiality distribution is observed for K = 19 and 22 MPa m0.5 while slightly different for
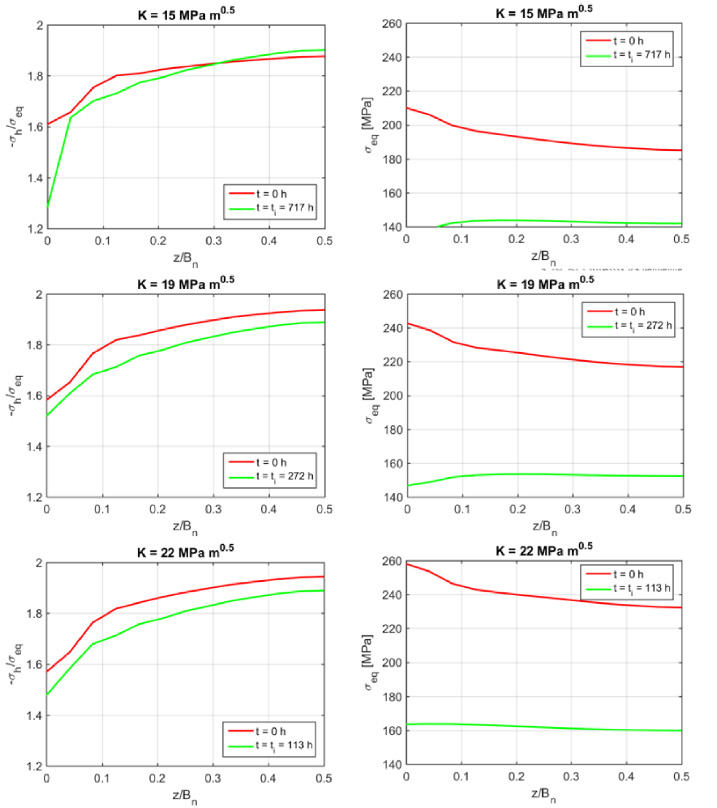
Stress triaxiality
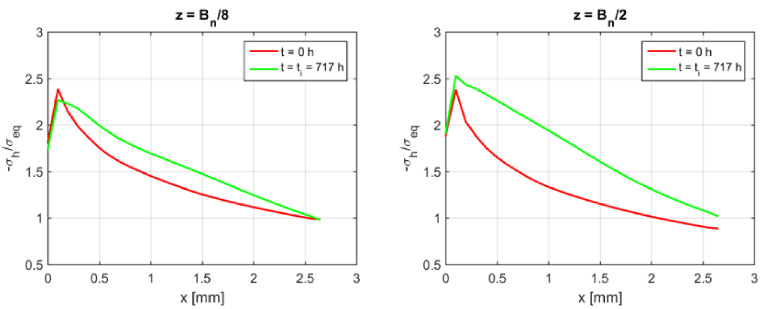
Stress triaxiality (𝜎 h ∕𝜎 eq ) along the uncracked ligament for initial stress intensity factor equal to 15 MPa m0.5, at the z = B n /8 cross section and at the midplane.

Fracture surface at the end of CCG test performed at K0 =15 MPa m0.5.

FE results in terms of crack propagation as a function of time at different stress levels and comparison with experimental results.
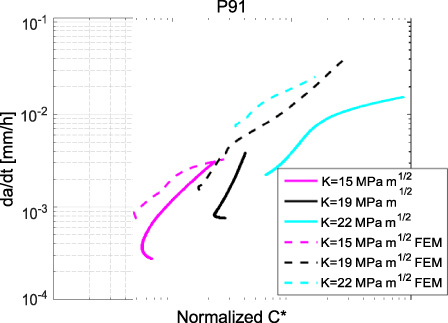
Comparison between the C∗, obtained by numerical simulation of the load-line displacement and of the creep crack growth rate, and obtained experimentally from creep crack growth tests.
If the stress triaxiality is evaluated along the uncracked ligament at a time t = 0 and at the initiation time, a similar trend is calculated for all the different initial stress intensity factors. If we consider the simulation at
The comparison between the experimental C∗ and the one calculated by numerical load-line displacement and crack propagation records is proposed in Fig. 15. All the data prior to the transition time were excluded. The FE model exhibits a similar behavior to the experimental data at K0 = 15 MPa m0.5 while a difference in the calculated crack growth rate at 19 and 22 MPa m0.5 can be observed. However, it is interesting to notice how the power-law relationship of Fig. 6 is lost at low crack propagation rates, i.e. at the beginning of the tests. This indicates that the initiation time, i.e. the starting limit for steady-state CCG, might be too short to guarantee extensive creep conditions. In this case the creep zone is not large enough with respect to the elastic and plastic zones making the relationship between da∕dt – C∗ no longer valid.
In numerical simulations, the definition of a crack tip, allows the estimation of the C(t) integral that is able to describe the crack growth under different creep conditions. In small-scale creep regime C(t) is path dependent and thus needs to be calculated through a limited contour in proximity of the crack tip where the stress-strain fields are purely dominated by the creep strain rather than elasticity. In steady-state creep conditions, after the transition time, the C(t) integral becomes path independent trending to the same value of C∗. Figure 16 reports the Abaqus estimation of the C(t) integral along the uncracked ligament for different initial stress intensity factors. The C(t) integral is generally higher in the plane strain section with the exception of the side grooves section (Z = 0). This results is in agreement with the profile of the crack propagation experimentally observed and numerically predicted.
FE model
In order to perform finite element simulations of pressurized pipes in presence of semi-elliptical cracks, the shell to solid coupling technique has been adopted to reduce the high computational times typical of complex geometries (Fig. 1). Due to axial symmetry, only 1/8 of the pipe was considered. The pipe geometry consists of two different parts that were modeled according to two different element types: 2D 8-node doubly curved thick shell elements with reduced integration for the further region from the crack tip, and 3D 8-node linear brick elements with reduced integration for the region in proximity of the crack tip. The shell to solid coupling constraint was properly applied to transfer stresses between both regions. The mesh size close to the crack tip was designed to guarantee an average element size L el =100 μm comparable to the one used in C(T) specimen simulations. The detail of the mesh is shown in Fig. 18. The boundary conditions are represented in Fig. 1 and consist in the circumferential symmetry on the pipe thickness and the axial symmetry. An internal pressure load of 25 or 35 MPa has been applied to the model, with or without the application of the axial stress 𝜎 ax that was calculated from the thick walled pipes formulations of Lame, according to the loading conditions of Table 1. All the case studies were simulated in order to have evidence of the creep damage localization and crack propagation along the crack front.

Abaqus calculation of the C(t) integral along the uncracked ligament, using crack tip contours, for different initial stress intensity factors.

Schematic draw of the pressurized pipe used in the shell to solid coupling based FE model with boundary conditions.

Coordinate system and finite element mesh of the longitudinal crack on the inside surface of the pressurized pipe.
The stress triaxiality factor

Stress triaxiality (𝜎 h ∕𝜎 eq ) and equivalent von Mises stress (𝜎 eq ) along the crack front at different time.
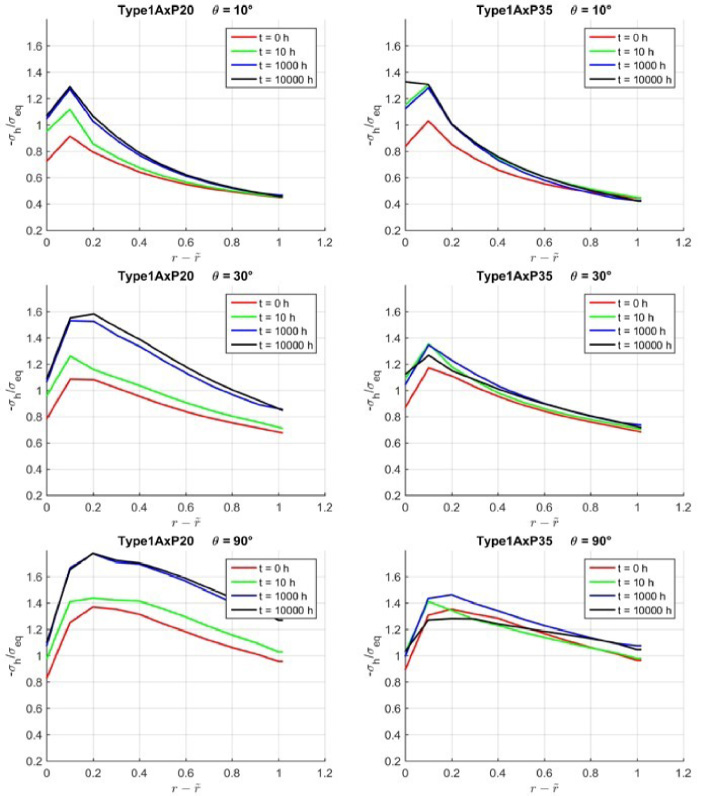
Stress triaxiality (𝜎 h ∕𝜎 eq ) and equivalent von Mises stress (𝜎 eq ) for Type1AxP20 and Type1AxP35 cracks, along the uncracked ligament at different time.

Stress triaxiality (𝜎 h ∕𝜎 eq ) and equivalent von Mises stress (𝜎 eq ) for Type1P25and Type2AxP35 cracks, along the uncracked ligament at different time.

Crack propagation on the pressurized pipe for different crack configurations.

Abaqus calculation of the C(t) integral along the uncracked ligament at 10°.
Despite the limited number of case studies, the numerical results allow us to point out as the interaction between pressure load level and actual crack geometry demands for a more detailed approach to high temperature residual life prediction rather than a classical approach exclusively based on the crack propagation estimation at the Points A and B of Fig. 1.
The stress triaxiality distribution along the ligament is reported, for three different values of 𝜃, in Figs 20 and 21 at different times. At time t = 0 h its distribution is characterized, for all the different levels of pressure and crack configurations, by a peak value behind the crack tip that increases with the angle 𝜃, while the gradient along the ligament decreases. The stress relaxation of Type1AxP20 crack causes a significant increment of triaxiality along the entire ligament. For Type1AxP35 crack, where stress triaxiality after 10000 h reaches its maximum at 𝜃 =10°, stress triaxility along the ligament first increases with time and then, after more than 1000 h, starts to decrease.
Stress triaxiality along the ligament is also strongly affected by the interaction effects between pressure load and tridimensional stress state. In fact, if we consider Type1P35 crack, it is evident that the absence of the axial stress, with respect to Type1AxP35 simulation, reduces the triaxility level, increasing the gradient along the ligament and confirming the effect of the pressure level i.e. that at 35 MPa there is an initial stress relaxation with a general increase in stress triaxility, followed by a triaxiality reduction. In the case of Type2AxP35, as the position at 0° is not interested by significant stress distribution, the results are independent on the position along the crack front. Due to the low level of constraint combined with the low level of von Mises equivalent stress, the reduction in stress triaxiality along the ligament is still observed, while the maximum triaxiality remains behind the crack tip. A comparison of the results for the four examined case studies suggests that the presence of a triaxiality peak at the crack tip shall be attributed to a combined effect between the crack geometry and the load conditions, while the stress triaxiality reduction with time along the ligament, can be attributed to the pressure level.
Lastly, it has been investigated how the complex stress state at the crack tip and beyond, affects the creep damage accumulation in terms of crack initiation and propagation. The crack propagation at the end of each simulation, is compared in Fig. 22 for the four analyzed crack configurations. The time at which the simulations have been stopped corresponds to the beginning of tertiary creep crack growth stage interested by large strains that require shorter time increments. It might be worth noting that the damage localization at 𝜃 =10°, predicted by the stress triaxiality analysis is confirmed. For Type1AxP35 case, the propagation starts at 𝜃 about 10° with an initiation time of 20000 h corresponding to a crack propagation of 0.2 mm, and gradually propagates towards point A in plane strain conditions, with a significantly higher initiation time of 360000 h. This damage localization results in a canoe-shaped crack.
Also Type1P35 crack initiates at 𝜃 =10°, after 19 000 h, but suddenly extends to crack front until the plane strain section. As a consequence, a more uniform and faster crack with a less marked canoe shape occurs. For type1AxP20 crack the initial damage location is on the plane strain section, with an initiation time of 84000 h. Crack propagation evolves through the plane stress section without exhibiting a canoe shape. The simulation was stopped after 200000 h with a crack propagation in the plain strain section of 0.4 mm. A similar behavior was also found for Type2AxP35 crack that ran until 75000 h.
The FE model was also used to perform a numerical evaluation of the C(t) integral distribution along the crack front for all the examined crack configurations. Figure 23 reports the calculated C(t) integral versus time, at 𝜃 =10° along the crack front, where a localized increase in the stress triaxiality has been found. The results show a higher C(t) value estimation for the two case studies interested by the canoe shaped crack confirming the creep damage localization that has been previously discussed.
Once again, from the crack tip parameter analysis it is possible to observe that, for specific combinations of geometry and load, the stress triaxiality exhibits a different trend along the crack front, that can reasonably affect the creep crack growth at the crack tip.
The use of fracture mechanics parameters in structural assessment of power plant components strongly depends on the crack tip constraint existing on the crack front of a service generated defect. In this work, the use of state-of-the-art numerical models to describe the creep behavior of C(T) specimens has been extended to investigate pressurized cylinders with a pre-existent defect made of Grade 91 steel. The combination of the Graham–Walles model to represent the creep behavior, and a modified void growth theory by Cocks and Ashby to characterize the creep damage, included in a finite element framework allowed the estimation of the stress triaxiality distribution along the crack front that, in this paper, is studied as a function of the crack morphology and pressure conditions. The creep crack propagation is then simulated by the introduction of a user defined field variable that reduces the elastic modulus
This model has been successfully validated by comparing the numerical crack propagation rate and crack tip C* parameter with the experimental ones obtained from CCG tests on C(T) specimens.
A shell to solid numerical model, created with the FE software Abaqus, has been studied to assess the creep damage and propagation of a longitudinal semi-elliptical defect present on the inside surface of a pressurized cylinder. Four crack configurations have been analyzed for the purpose. The numerical simulations of CCG exhibited a canoe-shaped distribution of stress triaxiality along the crack front that directly affected the creep damage and crack growth on the analyzed pipe. This singular creep damage distribution turned out to be dependent not only on the internal pressure but also on the initial crack morphology.