
Abstract
The combined theoretical-experimental technique to estimate high-tempered 65Γ steel resistance to rolling contact fatigue cracking is used. As a result of complex studies, the fatigue life data of high-tempered 65Γ steel is obtained. The dimensions of spall formed by pitting mechanism for deferent contact pressure values is determined. It is shown that the significant role in rolling contact fatigue estimation of similar steels has an initiation shear crack length. The influence of tempering temperature after quenching on rolling contact fatigue resistance of 65Γ steel is evaluated.
Keywords
Introduction
Fatigue of materials remains the main reason of machines and structures failure at all stages of technology development. This led to great interest of scientists and engineers to this problem and spawned extensive scientific research [5,7,12,16,17,22,23]. Fatigue itself is a phenomenon of complex physical nature, governed by many factors, such as materials resistance to fracture, shape and size of parts and structures, stress ratio and frequency, load cycle shape, type of loading, operational environments and other parameters that determine the bearing capacity and durability of machines and structures at cyclic loading.
Rolling contact fatigue (RCF) possesses a special place among different kinds of fatigue [7,17]. RCF resistance is an important characteristic of a huge variety of machine parts such as railroad wheels and rails, rolls of rolling mills, gears, ball or roller bearings, etc. Ensuring long-term operation of these machine parts is an important scientific and engineering challenge. It is known that fatigue cracks propagation is one of the most common mechanism of damage to the working surface of these parts at RCF. Cracks propagation in near-surface layers of material can cause such contact-fatigue defects as pits, spalls, shells, cavities and squats [20]. As a result of accumulation of a critical amount of such defects (Fig. 1), the machine part needs to be repaired or completely replaced.

Spalls on the rail head (a) and bearing roller (b) surface caused by RCF.
There is no doubt that the main reason of fatigue cracks initiation and spreading is the alternating pressure on the rolling surfaces. The friction forces on the contact surfaces greatly increase the magnitude of tangential stresses that are the main driving force of fatigue cracks. Further development and trajectory of fatigue crack depend on the direction and ratio of tangential and normal stresses. The origins of the initial fatigue microcracks are usually non-metallic inclusions or other microstructure voids, activated by the action of contact stresses. Also, cracks can initiate in defect-free zones, or in individual submicro volumes due to gradual weakening of irregularly oriented grains leading to formation of free surfaces between them. The subsequent transformation of microcracks into macrocracks occurs in the same way as regular fatigue crack development.
The most common form of defects forming at RCF are spalls [2,8,15,19]. It is believed that spalls are forming as a result of cracks propagation from the surface to the depth of material and back that leads to separation of pieces of material. Spalling can be divided into initial and progressive. In contrast to the progressive spalling, which does not stop since its initiation, the initial spalling is observed only at the first stage of the part service, and the microspalls formed on this stage are subsequently filled with metal. This self-healing process is caused by an increase of fatigue spalling resistance of material due to cold-hardening, as well as by a decrease of contact pressure due to contact area enlargement.
For studying the contact fatigue phenomenon and fatigue spalling resistance of steels evaluation, the test methods [4,6,10,11,13,14,18,21,25] for disk samples of diameter from 40 mm and thickness from 10 mm made of the same or different materials were developed. The test consists in contact rolling of discs at dry friction conditions or in a liquid at different contact loads using two-disc or tri-disc test machines. The objects of research are processes of the cracks initiation and growth in the near-surface layer of disks, as well as the durability of steels, in other words, the number of rolling cycles to spall formation. On the base of these results the dependences of contact pressure on the number of rolling cycles to spall formation are build. These dependences are used for contact fatigue resistance of steels evaluation. However, the large scattering of experimental data in such studies often leads to ambiguous results [1,4]. Therefore, it is necessary to carry out an additional experiment and more detailed analysis of rolling surface voids. This requires the development of new alternative theoretical and experimental approaches, allowing to avoid complex and costly testing of disk samples. Based on the literature data analysis [20], the main stages of further research are represented in the 6-step algorithm (Fig. 2).
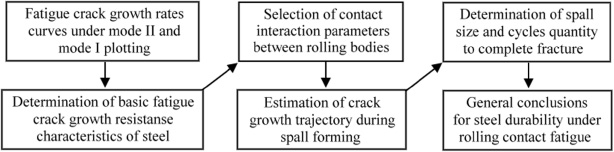
Scheme of RCF resistance estimation of steel.
Experimental studies
The research material was 65Γ steel with chemical composition 0.62 … 0.70% C, 0.90 … 1.20% Mn, 0.17 … 0.37% Si, ≤ 0.035% S, ≤ 0.035% P, ≤ 0.25% Cr, ≤ 0.25% Ni, ≤ 0.20% Cu. Specimens for testing under cyclic loading were heat treated by quenching from 820 °C in oil and tempering at 650 °C in first case and at 600 °C in second case for 1 hour.
For measurement of fatigue crack growth (FCG) rates under mode II shear I-beam specimens (Fig. 3) were tested using an testing setup YBB-500. The stress ratio was R = −1 and frequency was 12 Hz according to guidelines [9]. The FCG rate was calculated as v = 𝛥l∕𝛥N, where 𝛥l is a crack length increment after 𝛥N loading cycles. The stress intensity factor (SIF) range 𝛥K was determined by dependence 𝛥K = (1 − R)K max. So, respectively, 𝛥K II = 2K II max. The crack face friction (CFF) factor f c is needed for correct 𝛥K calculation in I-beam specimens. To measure CFF factor f c the fragments including both crack faces were cut out from the fractured I-beam specimens and tested according to Coulomb-Amonton’s law as a friction pair. An original device (Fig. 4) was used. One fragment of the specimen was fixed by gripers to the supporting plate, and the other with a drilled hole in the wall was placed on the first one. The full contact along fractured surfaces was ensured. Then, the upper fragment was loaded with various weights and shifted by force F, applied to the hole. From the obtained dependences “time – force” the critical shift force F at which the upper fragment starts moving on the lower one, was found. Using the pressure force P N value and shear force F value the CFF factor f c was calculated by formula: f c = F∕P N . For each pressure force P N the value of f c was calculated by the results of three tests.
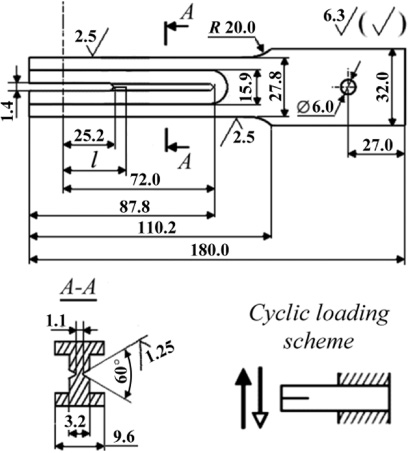
I-beam specimen for testing under cyclic mode II shear.

Device scheme for measuring the CFF factor in I-beam specimen.
Fatigue testing under mode I tension a well known standard compact specimens (width W = 45.0 mm; thickness T = 10.0 mm) were tested using a hydraulic testing machine Heckert EUS-20 at stress ratio R = 0.1 and frequency 15 Hz according to standard [3].
On the base of test results the FCG rate curves as a relations v (𝛥K) were built with. These graphical S-lines obtained by approximation of experimental data points for mode II shear and mode I tension were used for determination of FCG resistance characteristics. The threshold SIF range 𝛥K th and critical SIF range 𝛥K fc , was determined as the values of 𝛥K for FCG rate v = 10−10 and 10−4 m/cycle, respectively.
FCG resistance characteristics according to fracture mechanics approach are determinant characteristics of material. Lead for this conception, for an analytical description of FCG rates, it is necessary to use an equation which presents the threshold region, middle section and high-amplitude region of FCG curves. Based on this consideration, the Yarema-Mikitishin equation [24] was used:
Traditionally, in fatigue fracture mechanics the endurance limit N of a solid (the number of loading cycles until fracture) is considered to consist of two stages: N i – macrocrack nucleation stage and N g – stage of macrocrack growth until critical length. The N g stage is called residual endurance. Within this work only this period was considered. In accordance with the two-stage model [20], the damaged body was modeled by an elastic half-plane with a crack, and the action of counterbody was modeled by distributed normal p (x, 𝜆) and tangent q (x, f, 𝜆) forces, applied to the edge of the halfplane (Fig. 1). For the model load p (x) the elliptical (Hertzian) force distribution, usual for the case of RCF was chosen: p (x) = p 0(1 −𝜆2)0.5, where p 0 – maximal contact pressure, 𝜆 = x 0∕a - parameter determining the contact load location relative to the crack. The action of slipping friction forces was substituted by tangential forces q (x, f, 𝜆). The distribution of tangential forces was set through their relation with the normal forces according to Coulomb–Amonton’s law q (x) = fp (x), where f is the friction factor between rolling bodies.
On the base of the research results [20], it was assumed that due to cyclic action of the contact load, the macrocrack originally develops rectilinearly by mode II shear mechanism, and later curvilinearly by normal mode I tension mechanism (mixed mode I + II with dominant mode I tension). Therefore, N
g
was determined by the following equations:
At the stage of macrocrack development, the maximum shear stresses were considered to be decisive for fracture. For the conditions of complex stress-strain state, the criterion of a generalized transverse shear (𝜏𝜃 - criterion) was used.
At the second stage of macrocrack growth at mode I tension mechanism, the decisive are normal tension circular stresses. For their description, the criterion of generalized normal stress (𝜎𝜃 - criterion) was used.
Transition conditions (5), (7) and (8) for which the crack lengths
The macrocrack trajectory was built in a stepwise way by a well-known algorithm [20]. Two types of steps were considered for this purpose: the main, associated with the crack growth, and the auxiliary, associated with the change of load in contact cycle. The crack increment h at each stage of trajectory construction was laid from the crack tip in the direction determined by angle 𝜃∗± (Fig. 5). The auxiliary step 𝜆 was used to find the extremums and the magnitude of K m𝜃 within the contact loop.

Scheme of two stage calculation model of FCG during spalling.
The residual endurance was determined from the relations (3) by the generalized formula:
The following parameters characterizing the wheel-rail interaction were set in calculations (Fig. 5): contact pressure p 0 = 1400…2000 MPa, half-width of the contact spot a = 7 mm; friction factor between bodies f = 0.1; angle of inclination of the initial shear crack 𝛽 = 5𝜋∕6; greased CFF factor f c = 0.15 and f c = 0.17 for steel tampered at temperature t 𝛼 = 650 °C and t 𝛼 = 600 °C accordingly; mode I crack faces pressure ratio r = 0.1. To automate mathematical calculations and increase their ergonomics, an original software for mathematical transformations was created (Fig. 6). The software was developed in Delphi environment and intended for use on Microsoft Windows OS.

Data input (a) and output (b) window of calculation software.
As can be seen from the tests results (Fig. 7), FCG rate curves of 65Γ steel show the rate changes at low- (𝛥K
I
< 15 MPa
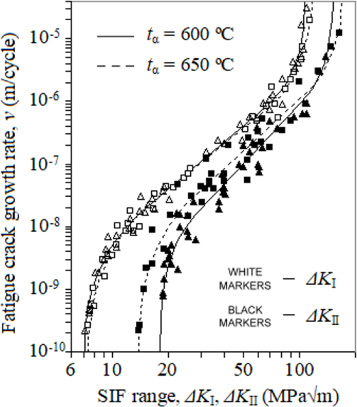
FCG rate curves of high-tempered 65Γ steel.
For mode II shear we can see the greater scatter of points on this region of curve. In contrast, the mode II tension experimental points have much less scatter. This proofs that FCG at mode II shear has intermittent nature that makes the process of approximation of experimental points more complicated. The FCG resistance characteristics obtained from FCG rate curves (Table 1) represent FCG behavior in a range that covers up to 6 orders.
FCG resistance characteristics of high-tempered 65Γ steel
It is important to indicate that the 65Γ steel after both tempering temperatures t 𝛼 has almost the same FCG resistance under mode I tension. Experimental points are located almost the same S-like curve. In case of fracture under mode II shear another tendency exists. In this case, steel structure after tempering at 600 °C has considerably the highest fracture resistance in near-threshold and middle section of FCG curve, and in high-amplitude section the inversion occurs. The highest fracture resistance for FCG rates values v > 2 ⋅10−6 m/cycle has a structure tempered at 650 °C, and structure tempered at 600 °C has a lower fatigue fracture resistance.
As a result of the calculations, it was found that the fatigue life data N g describing workability of high-tempered 65Γ steel at RCF conditions as a relationship between contact pressure p 0 in range 1400… 1800 MPa has an inverse appearance (Table 2), qualitatively similar to the model low-tempered steel 75XΓCT [20]. Both of initial lengths of the mode II shear and mode I cracks decrease with increasing contact pressure too. The same tendencies are observed for the spall size. This leads to a decrease in loading cycles number at each stage of FCG. It should be noted that width of spall is ∼3 times larger than spall depth. The estimation of b c ∕a c ratio shows that values correlate with experimental study [21] (Fig. 8) of 30CrMoV9 steel on RCF well and exists in range 0.34 … 0.37.
The influence of contact pressure on the spall shape (see Fig. 8)

Spall formation on 30CrMoV9 steel surface after RCF test.
Special attention was given to initial crack length
However, the fracture of 65Γ steel tempered at 650 °C in most cases requires little more loading cycles, which indicates its lower crack growth resistance at contact fatigue in comparison to 65Γ steel tempered at 600 °C. In order to carry out quantitative analysis, the parameter of relative fatigue life 𝛺 was introduced, representing the ratio
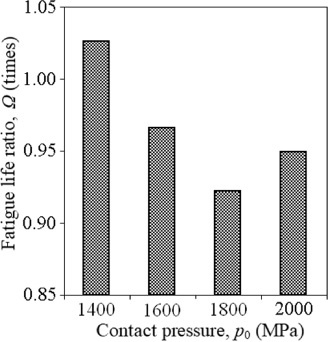
Fatigue life ratios
According to the main stages of original technique the experimental study of FCG rates of high-tempered 65Γ steel is completed and basic characteristics of FCG resistance for mode II shear and mode I tension fracture conditions are obtained. These characteristics define the RCF crack growth behavior, which has a strong impact on shape and size of spall. It is determined that the strongest influence on kinetic of spall formation process has a FCG resistance under low- and middle amplitude loadings. It is defined that 65Γ steel after quenching and tempering at 600 °C has a higher fatigue life in contrast to 65Γ steel after quenching and tempering at 650 °C according to the spall creation criterion by surface crack growing mechanism. The lengths of initial cracks, characterized by an initiation of fatigue fracture, are significantly higher for tempered structure at 600 °C, which indicates a higher durability at RCF conditions. In summary, an increase in tempering temperature from 600 °C to 650 °C has a negative impact on the durability of 65Γ steel under RCF conditions.
Footnotes
Acknowledgements
This work was supported by the National Academy of Sciences of Ukraine's target complex program “Problems of lifetime and exploitation safety of structures, constructions and machines”. The authors wrote this article in great appreciation of doctor Oleksandra Datsyshyn for her strong support to the “Resource” program and cooperation in rolling contact fatigue research topic.