
Abstract
Road freight touches all facets of the Australian economy and maintaining efficiency of this industry is vital for a growing Australia. Road freight companies produce telematics data to track vehicle movements for vehicle safety and efficiency, and these data provide valuable information which can be used to inform government policy on infrastructure planning and investment. Users of telematics data face many kinds of big data issues faced by users of non-traditional data sources. Statistics surrounding freight congestion can be created from telematics data, which has previously not been possible using traditional freight data. In this paper we investigate how to turn telematics data into official statistics.
Introduction to official freight statistics
Road freight in australia
The efficiency of the Australian freight industry is vital to the nation’s productivity and wellbeing [1]. Every industry in Australia depends on transport and logistics to some extent. Low cost transport and logistics enables Australian exporters to profitably reach key markets, help Australian manufacturers keep costs competitive in the face of cheap imports, and allows firms within Australia to compete over larger areas, bringing lower prices and greater choice to consumers. Providing these services is hindered by congestion and freight-impeding infrastructure, and being able to identify these locations could help enhance productivity in the private sector by assisting infrastructure planning and investment decisions [2]. There are only a relatively limited number of businesses who operate in movement for rail, sea and air freight which makes statistical collection of these businesses easier [3]. However, the road freight industry has approximately 40,468 businesses [4] with the vast majority running a single truck. There are also a number of large providers who run hundreds of trucks, with the largest road freight operator having a 9.6% share of total market value [4]. The Freight Performance Measurement Project (FPMP) [2] used industry relationships to arrange provision of telematics data to the Australian Bureau of Statistics (ABS) and the Bureau of Infrastructure, Transport and Regional Economics. The data provided by road freight companies contained approximately 1,000 trucks for the month of May 2016 which was used to create the statistics within this paper, though additional data was received outside of this time period. This paper is targeted towards National Statistics Organisations (NSOs), but this paper is applicable to any organisation interested in telematics data.
Telematics data
Telematics devices record time, vehicle location (latitude and longitude) and speed, but can also contain additional information such as engine management information or altitude. This data is produced autonomously with manual intervention only required for data extraction. Many large freight companies use or outsource telematics devices for vehicle financing, vehicle maintenance, tracking and diagnostics, and dynamic vehicle scheduling [5]. Using telematics devices has the benefit of improving fleet efficiency, productivity and reducing overall transportation costs, which helps to minimise business risk for freight companies.
Benefits of telematics data for official statistics
NSOs are interested in understanding how to use emerging data sources to produce robust statistical information. This project provided the ABS an opportunity to assess the feasibility of this type of data source to produce official statistics and better understand the limitations of this data. Freight companies have an incentive to provide data as it can produce valuable industry benchmark information, enabling businesses to compare their performance against average industry practice, potentially fostering improvements in practices and average performance across the industry.
Using telematics data as a primary source of data for official statistics has many benefits over running a survey. At the ABS, road freight data has been collected as origin-destination statistics with distance travelled, vehicle type, commodity type and weight collected [6, 7]. Telematics data records origin-destination and distance travelled statistics, but typically does not record commodity information or information about vehicle type and weight. Collecting survey data requires truck drivers to record this information manually and it is difficult to produce statistics quickly as data is received slower. Acquiring more data increases the respondent burden on truck drivers. Telematics data is collected faster and is less of a burden on truck drivers (though data does needs to be extracted and provided by freight companies) which, on an ongoing basis, is more efficient and scalable than traditional collection methods. As telematics data has finer temporal and spatial granularity (approximately minute by minute locations, rather than start and end locations with trip distance for survey data), more information is available for analysis such as which routes freight vehicles use and where congestion occurs. Telematics data can use time, dates and locations to link to other data sources such as weather information, traffic accident locations, truck stops and petrol stations. Linking these data sources together creates a richer analytical environment [8], which can be used to gain more value and insight on freight data, and help better inform infrastructure investment decisions.
Experiences with telematics data
Introduction to big data issues
Telematics data has emerged as a source of big data as it has volume, variety, velocity and veracity [9]. Most NSOs have big data projects either for research and production [10, 11, 12], but telematics data has not been utilised for official statistics, though use within the freight industry has been investigated [13]. Telematics devices produce new information every few minutes and for a large fleet of vehicles, this means that large volumes of data are produced frequently. Combining different sources of telematics data with different metadata and data quality issues is also typical of big data. UNECE [12] has listed as legislation, confidentiality, finances, management, technology and methodology as the main difficulties of big data. Other problems exist for big data specifically including sampling error, sampling selection bias, measurement error, multiple comparisons errors, aggregation error, and errors associated with the systematic exclusion of information [14]. The broad statistical issues for telematics data are data quality and sampling which we will discuss here.
Data quality
Data quality is a significant issue for NSOs as receiving unstructured data means that significant validation is necessary before creating high quality official statistics. The telematics data received for the FPMP faced common issues such as duplicate records, missing data and formatting issues which could all be dealt with using standard statistical methods [15]. There was data provided within the data sample where trucks did not move and this was assumed to be inclusive of the freight population [6]. Telematics data had issues concerning coordinates being outside of Australia, not matching road data (because of outdated road data or GPS errors), coordinates jumping to far away locations then returning to the previous location, GPS units freezing due to infrastructure (tunnels or other GPS impeding structures) or other device errors. Removing these errors from the data was important as the statistical outputs could lead to misleading analysis.
Volume and variety
Receiving a large quantity of data from multiple sources meant that code for cleaning and validation needed to be scalable so the data could be handled quickly without significant clerical intervention. Variable names were standardised to an alias which meant that inconsistent metadata was standardised and only needed to be changed once within the data cleaning process. Providers were de-identified and confidential data items were removed or replaced with non-confidential values. Coordinates were matched to truck stop data, road data [16] and geographical information [17] so truck stops, congestion [18], trips and origin-destination statistics could be produced.
Creating trip statistics
For the Freight Movement Survey 2013–14 [6], a trip was defined as a journey made by a vehicle from one location to another where the load carried or vehicle configuration changes. As consignment and load information was unavailable on the provided telematics data, this meant that an alternative trip definition had to be adopted. If a vehicle was stationary (speed of zero) for over 5 minutes, a stop event was created, otherwise a vehicle was part of a move event. Vehicle journeys were separated into stop and move events, and if a stop was close enough to a depot (a file of public depots of major freight companies was created) then this signalled the end of a journey and a trip, otherwise a stop event signalled the end of a trip only. Journeys track a vehicle from departing a depot until it returns to a depot, under the assumption that vehicles would return to the company depot at the conclusion of a trip. Stops between these events would suggest that these trips would have either configuration changes or stops for other reasons. Upon analysis, some examples of events that signalled the end of a trip were stopping at a rest stop, stopping at a petrol station, load changes or configuration changes. These stops were classified manually by confronting with location data. Additionally, geography-based journeys (creating a new journey when stopped in a different statistical area), and time-based journeys (creating a new journey when a vehicle was stopped over a certain threshold) were created. Creating these different outputs enabled more customised analyses to be conducted.
Sample representation and bias
Once telematics data has been established as unbiased (of selection bias), the statistics created from this data will be representative of the population of interest. One significant issue with using telematics data is that the collected sample is a convenience sample [19], which means that data is not necessarily representative of the freight vehicle population in Australia. The Freight Movement Survey [6] used state of registration, vehicle type, region, age of vehicle and vehicle size to stratify for survey selection. Telematics data can classify points to identify state and region, but other stratification variables were unavailable. This meant that bias from vehicle age, size and type could not be accounted for. A telematics data sample can be biased geographically by not having a similar breakdown of vehicles to the Motor Vehicle Census [20] for state of registration.
Percentage breakdown of truck registrations by state. Note that no data from Tasmania was received for the FPMP.
Figure 1 demonstrates that the data received was biased towards Victoria, and biased against every other state, most significantly Queensland, excluding Tasmania where no data was received. Though this confrontation can estimate the geographic representativeness of a data sample, it does not account for sample selection bias. If this was the case, then trucks from certain states could be deselected to create an unbiased sample by state. However, this does not account for sample selection bias occurring from only large companies providing data.
Sample selection bias occurs as larger freight companies are more likely to have telematics devices than smaller companies. Small freight companies tend to specialise geographically [4] and are less likely to be involved in long distance freight movements to the same extent as larger companies. To account for this bias we create a model using auxiliary information known about the Australian freight industry. From the Motor Vehicle Census, we are aware of how many freight vehicles there are within each state, but are unaware of the behaviour of the vehicles in each state. We are aware that there are approximately 40,468 freight businesses, 70% of which have a single vehicle. Assuming that freight businesses are proportional to the number of vehicles in each state, then we know the breakdown of freight businesses in each state as well as total vehicles. Then assuming that small (single truck) and large (more than one truck) freight businesses within the same state exhibit similar behaviour, we can use this model to create less biased freight statistics.
As an example, let us consider the total kilometres travelled by all freight vehicles in Australia in 2016. Consider all vehicles from the data sample which has been assigned a state (state of most frequent occupancy) and a trip size (large if one or more intercity trips, small otherwise) which has an average kilometres travelled per day given by
Where
Now if we consider the total number of vehicles in reference to the state and size we have:
And Total Vehicles given by the Motor Vehicle Census for each state
Then it follows assuming 70% of businesses have a single vehicle and there are 40,468 freight businesses operating in Australia [4]
Now by combining the total number of trucks by state and size by the average kilometres travelled each day for all trucks is given by
And extrapolating on this for each for 2016, the total kilometres travelled annually by freight vehicles is
This model assumes that May is a representative month, and does not consider weekend and weekday effects. It is possible to model this behaviour but this could risk over-fitting the model. Using this approach, we can compare this to kilometres travelled in each state from the Freight Movement Survey 2013–14 (after adjusting for an increase in freight vehicles from the 2016 Motor Vehicle Census).
Comparison of the Freight Movement survey and FPMP May 2016 data sample total kilometres travelled by State. Tasmania was excluded for the Freight Movement Survey statistics to make it comparable to the FPMP data. With a larger data sample, it is likely to have vehicles registered in Tasmania.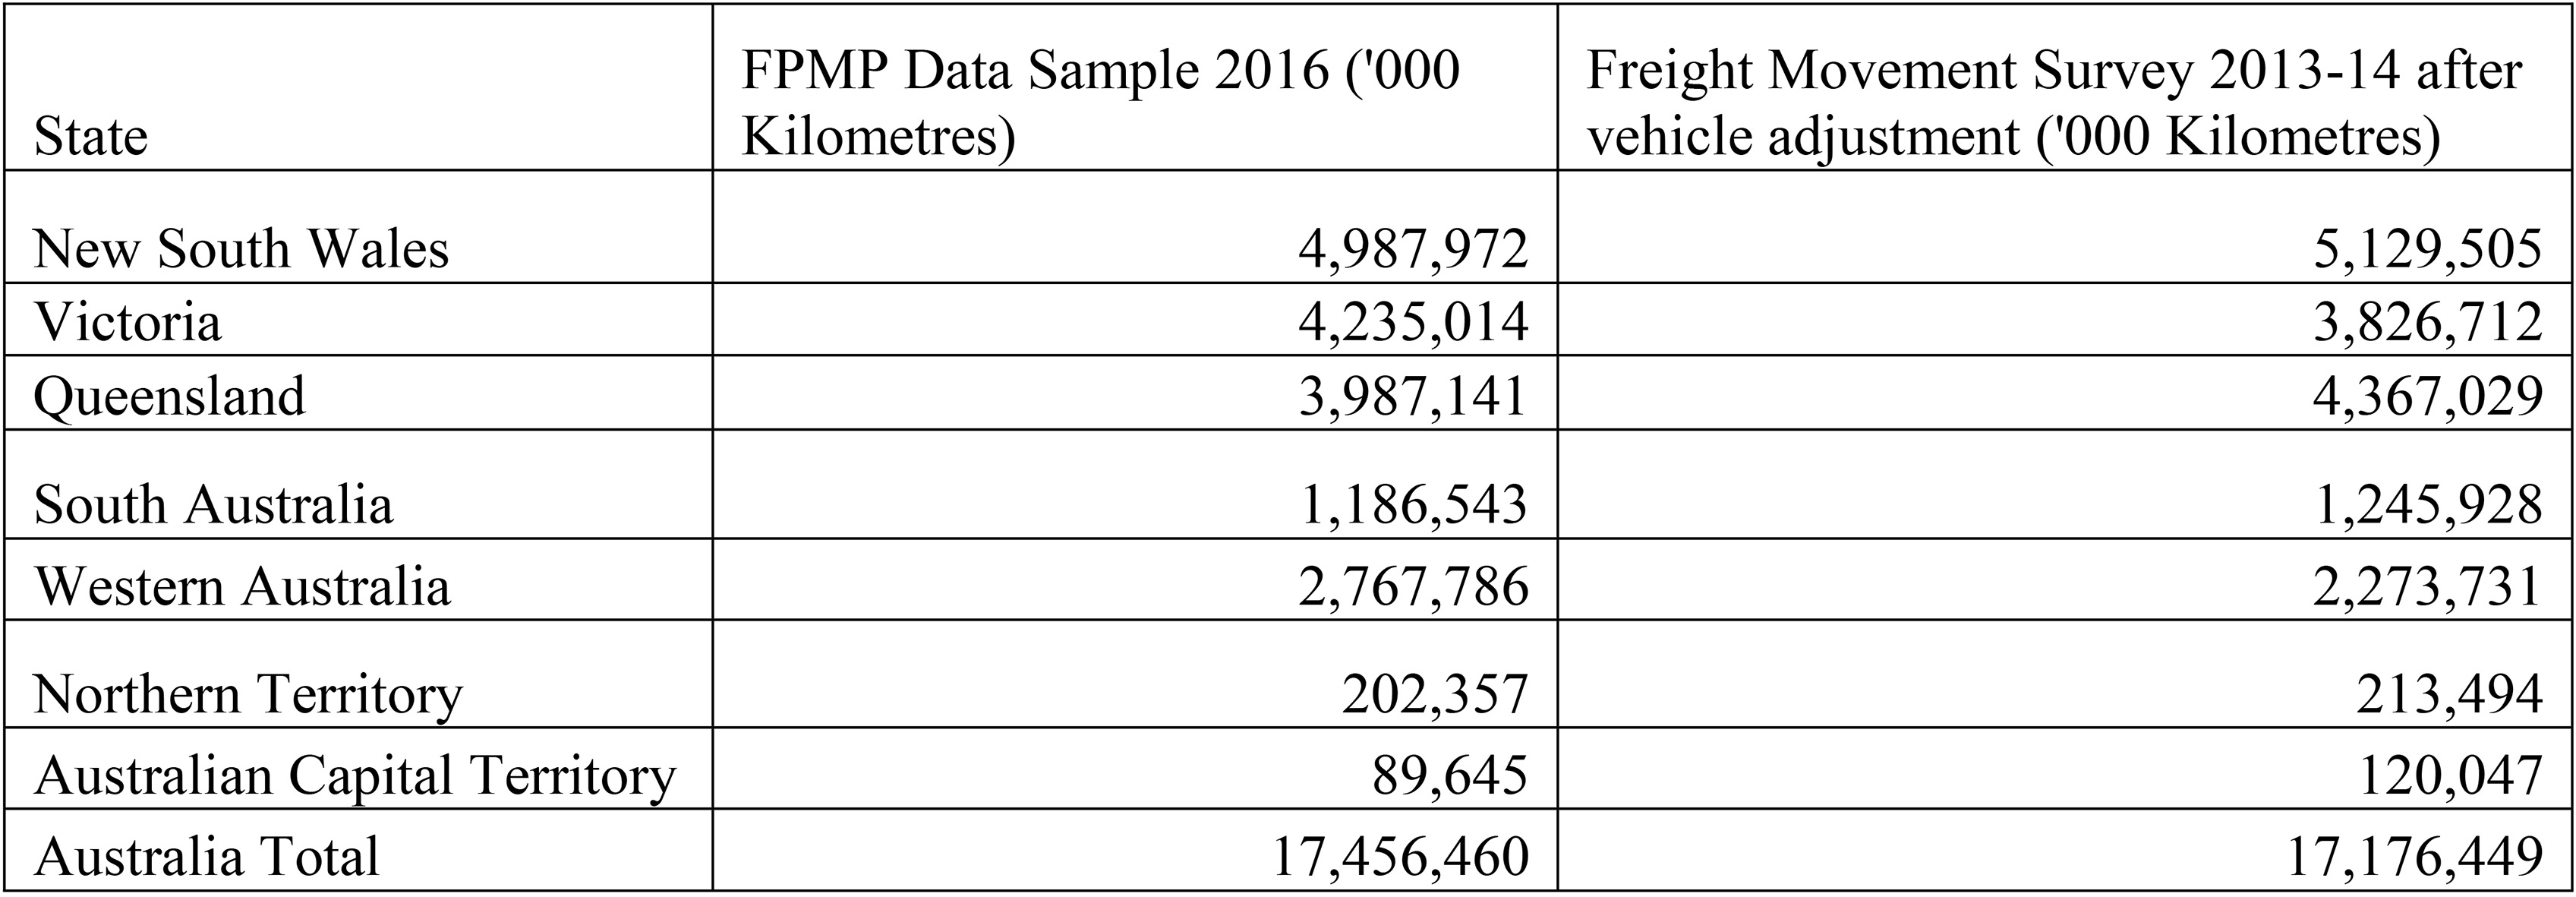
Figure 2 gives an approximation of distance travelled in each state annually. Though there are some differences at the state level, these figures model the expected behaviour of freight. Without these adjustments, the total distance travelled was being significantly over-estimated. Using this model, sample bias is lessened and the creation of other freight statistics (such as origin-destination statistics) can be created using this method where industry information is combined with telematics data to create statistics, without needing to run a survey. If there is adequate information about the population of interest, then this information can be used in combination with data to correct for bias.
Telematics data can be matched to road segments which can then compare speeds on road segments or from collected data to create congestion measures. As mentioned previously, telematics data is biased towards larger companies. However, as congestion statistics are relative (rather than absolute), this is unlikely to affect decisions made regarding the most significant points of congestion. Most freight businesses are aware of where congestion occurs [21], and the value that these statistics add is in quantifying this congestion and identifying when it occurs. Telematics data can be used identify when and where the largest volume of freight traffic occurs, which could assist government planning infrastructure to avoid congestion, and maintain roads with the highest freight volume.
Conclusion
Telematics data is an exciting prospect for creating official freight statistics as data collection is easier and faster and enables production of new statistics on congestion and road usage. The data does have data quality and sampling issues, but these errors can be removed, corrected or supplemented by using additional sources of data. Model-based techniques can be employed to utilise telematics data to create official statistics to help inform government infrastructure decisions and understand road freight in Australia.
Footnotes
Acknowledgments
I would like to acknowledge and thank Siu-Ming Tam for his interest and support in preparing this paper, as well as Amanda Clark , Jon Williams, Ric Clarke, and Jenny Myers for helpful comments on the draft. I would also like to thank the Bureau of Infrastructure, Transport and Regional Economics for supporting and providing assistance for the Freight Performance Measurement Project. I would like to thank the International Association of Official Statisticians for coordinating the Young Statistician Prize (2017) that this paper was originally entered into, and their support and encouragement in submitting this paper for publication.