
Abstract
Since 2009 Statistics Netherlands (SN) has been exploring the use of Big Data (BD) in official statistics. This research resulted in new or improved official statistical products such as the Consumer Price Index based on web scraped prices, and the traffic intensity indicator using traffic loop data. With the aim to make use of new BD sources, SN established the Center for Big Data Statistics (CBDS). The CBDS builds upon acquired data science expertise in an ecosystem of academic and private partners in order to make official statistics using survey, administrative and BD sources and methods. This multisource approach provides better insights into complex policy questions. One of these complex questions for policy makers is the energy transition and how to move away from carbon based to renewable energy sources. More detailed data is necessary in order to get a better insight into locally produced renewable energy and to allow policy makers to design policies that allow matching offer and demand. We use multiple data sources in a combined fashion to provide insight into solar energy provision. We conclude by giving general guidelines for the process to embed the experimental statistic in the official statistical process.
Introduction
The amount of data is doubling approximately every two years [1]. Most of these data are “in the wild” (images, words, videos) and often unstructured, therefore not adhering to the requirements of a traditional database regarding size and structure. The science of management and analysis of this less structured type of data is developing rapidly. Several disciplines have successfully used Big Data (BD) – a term invented by computer scientists – in applications such as astronomy (wide survey telescope images, see [2]), retail industry (Walmart’s transaction data), predicting presidential elections [3] and search engines (Google flu trends) [4]. This evolution is often referred to as the datafication of society [5].
Since 2009 Statistics Netherlands (SN) has been exploring the use of BD sources for official statistics. This research resulted in new official statistical products paving the way for a formal embedding of BD research within the organisation. In September 2016, SN established the Center for Big Data Statistics (CBDS). This center brings data and data science expertise together to allow analysis of combined data sources and better insights into complex policy questions. Hence the CBDS is championing a new role for National Statistical Institutes (NSIs) to provide information as a service allowing timely policies.
One of the major societal challenges governments, provinces and cities are facing is the energy transition. There are many scenarios, constant technical innovations, significant local differences in renewable energy potential and high investment needs related to making buildings and the economy more sustainable, while overall costs due to these investments are expected to be lower. National and local governments wonder what the best next steps should be to move from using fossil fuels towards an energy system where renewable energy plays a dominant role and as such reach their targets for energy use and emissions in accordance to the EU vision of a roadmap towards a climate neutral economy as outlined in the COM (2018) 773 [6]. With fossil fuel extraction becoming more difficult/more expensive and the need to reduce CO
The switch to renewable energy sources poses a challenge to the electricity grid, because wind and solar power are weather dependent and thus fluctuate considerably with high frequency. To ensure stability of the network, net operators have the challenging task to constantly keep supply and demand in balance. This is further complicated by the fact that energy is increasingly being produced by numerous households and companies (also known as prosumers) instead of a small number of large power plants. Currently, the net operators don’t have full insight into all produced electricity. High frequency smart meter data could provide this information, but a smart meter hasn’t been installed in all households and in many cases net operators don’t have access to the measurements because of lack of consent. So there is a lack of detailed data on local energy production. In the remainder of the paper we refer to this as ‘unmetered electricity’.
Solar energy is just one piece in the energy transition puzzle. Due to its volatility in time and limited availability during nights and winter periods, it has to be combined with other renewable energy sources like wind and biomass as well as demand side options, like demand response to effectuate the energy transition. The energy transition as a whole is a complex societal phenomenon with many parties involved and scattered information. Therefore there’s a great need for timely, accurate and comparable information about current energy consumption at low regional level. The Renewable Energy Directive adopted by the European Commission establishes an overall policy for the production and promotion of energy from renewable sources in the EU. The Directive specifies national renewable targets for each country. EU countries set out how they plan to meet these targets and the general course of their renewable energy policy in national renewable energy action plans. In the Netherlands the task of organising the energy transition has been appointed to local government (municipalities, net operators and provinces) whereas the national government has a supervising and supporting role. Hence there’s a growing need for faster information on a more detailed regional level, which has to be provided by SN.
The energy transition is presented in this paper as an example of a complex policy question that requires a multi-source approach in which BD sources and new analytical methods allow for new insights based on new statistical products. These products can be in the form of an analytical report, a tool such as a dashboard or a portal where information is visualised and provided to policy makers and other interested parties. In Section 2 we explain the CBDS and some examples of beta products. In Section 3 we elaborate on the case of solar energy statistics in relation to experimental statistic. In Section 4 we present the results.
The Center for Big Data Statistics at Statistics Netherlands
The datafication of society creates opportunities to unravel some of the societal problems but it also presents governments, companies and citizens with the challenge of getting relevant information out of the huge amount of data that are being generated. CBDS is part of the SN innovation strategy and develops innovative ways to address societal challenges through a network of national and international partners. BD offers a wealth of opportunities, in particular due to the rate at which the data are being generated and the detail they can provide. The data are often obtained via direct measurement and can be modelled and clustered using advanced processing techniques and methods. The large amounts of data can reveal new patterns which are sometimes not visible with a small sample. Relevant, accurate and timely data enable smarter decision making and answering more complex policy questions. As a National Statistical Institute (NSI), SN strives to become ever more relevant to the users of our data in society – being governments, companies and citizens – and BD can help us to achieve this goal.
CBDS’ goals are three-fold: Firstly, SN uses BD to make existing official statistics more timely or even real-time, to provide more detailed statistics (e.g. on a lower geographical level) and to produce new statistical output. Secondly, CBDS aims to set in place the mechanisms to make the production of official statistics more efficient and to reduce response burden among households and companies whilst retaining or improving accuracy. Finally, CBDS has the longer term goal of developing BD methodologies that can be incorporated into the regular production process of the future.
Defining beta products
Producing statistical products in a faster way can come at the expense of the delivered quality. Here so-called “Beta products” come into play. These experimental statistical outputs are being produced as soon as the data become available and, if possible, are later benchmarked against validated statistical output that becomes available at a later point in time. Data scientists at SN approach a new BD source from two perspectives: 1) what can we get out of the data using a hypothesis-free (data driven) perspective and 2) which burning social questions can be answered with them (phenomenon oriented). This focussed way of working results in SN being able to produce timely, more detailed or better statistics.
There are good examples where this work improves existing statistics such as the Consumer Price Index using scanner and web data and consumer confidence using social media (sentiment) data. In addition CBDS develops Beta products based on in-house data. For example this can be administrative or survey data that were not linked before or applying methods used in Data Science such as Machine Learning on large administrative sources. In addition, data from external partners can be included, new insights can be achieved and the development of Beta or experimental statistics is stimulated.
A useful definition and guideline for experimental statistics can be found on the Office for National Statistics (ONS) website (www.ons.gov.uk): Experimental statistics are statistics in the experimental testing phase that are not yet fully developed. Users should be aware of the status and cautions of these series, which will vary for each statistic. Defining what is experimental and non-experimental is largely a matter of statistical judgement, but typically experimental series are created when the complete statistical process from input to output does not meet the agreed quality standards of National Statistics yet or the quality standards haven’t been validated. This can be the case for instance part way through a well-defined development programme, whether these statistics are new or changed versions of existing statistics. On the input side there could still be reliability issues collecting the data or only partial coverage of the target population (for example, of roads in sensor data). Also new methods could be used which are being tested and still subject to modification. On the output side the measured quantity could be a proxy of the intended phenomena to study like with the ‘Google flu’ study. It has to be determined how good the correlation is and how stable it is over time. In general the volatility of the output has to be analysed and the ability to meet customer needs. There might be potential modifications following user feedback about their usefulness and credibility compared with other available statistical sources. Despite the beta status of the experimental statistics a rich variety of new measures could be available from a new set of statistics, with components that have considerable immediate value to users; these users are aware of the statistics’ theoretical quality and can use them before we have completed all operational testing.
SN has built up BD expertise by searching for and investigating available BD sources (e.g. road sensor data, mobile phone data, scanner data, internet as a data source) in order to make statistical products, produce indicators (social media sentiment and social tension) and use these indicators as predictors of other phenomena such as Gross Domestic Product [8, 9, 10]. Methodologists within SN have shown the possibilities of using BD not only as a single source of information but also as an additional source, brought into a model, to estimate variables either more accurately at a low geographical (small area) level and/or more timely [11].
From beta to official statistic
The experimental statistics have led to official statistics in at least two cases: the Consumer Price Index based on web data [12] and the traffic intensity statistic based on road sensor data [10]. The former is an example of new data sources being used to improve or enrich an existing statistical product. In contrast, the latter shows a completely new source (road sensor data) being used to develop a new statistical output, traffic intensity.
Consumer price index
For the consumer price index (CPI) internet robots are used to scrape prices of products from web pages in order to identify fluctuations in prices of standard products. Moreover, online consumer expenditure has grown considerably in recent years and online products and prices may differ from traditional sales channels. Two main types of scraping were distinguished: automated bulk-scraping of a huge number of product prices from web shops and computer-assisted data collection of well-chosen representative products. From a BD perspective, the first approach is a more direct way to get all available data first and then merge it into an already existing statistical process. The second approach is a more statistical way to work on a BD source: leave the data where they are and intelligently pick the desired or most useful information for the statistical goal in question [13]. A few years after this research we can now conclude that indeed both ways of working were further developed to such a degree of matureness that they are both being used in the production of official statistics.
Both automated (bulk) data collection as well as robot-assisted data collection took multiple years to go from beta to official production. This is partly because it is necessary from a quality perspective to compare the results of experimental statistics with traditional figures for a longer period, in this particular case at least two years. Also, new tools, methodologies and processes have to be integrated into the organisation, which takes time. An important aspect for the acceptance of the new way of working was the fact that the research was executed in close cooperation with the experts from the production department themselves. In the case of computer-assisted data collection a productivity improvement of 80% was reported and there was a reduced chance of making errors. Looking back we conclude that in these two cases it was an advantage that both methods saved resources one or the other way and were executed in a statistical department where the management is keen on innovation.
Traffic intensity statistics
Many challenges had to be overcome for the traffic intensity statistics. During the research phase, SN was confronted with an overwhelming amount of low quality data, which made the data exploration a challenge. Consequently, the data were too large to clean manually. Hence, an automatic cleaning process had to be developed to make statistics based on these data. In case of the traffic loop data, the stochastic properties of vehicles arriving at traffic loops were used to clean the data.
Whereas the data generating process is clear or even straightforward in cases of the more traditional statistics, this is not always the case for BD based statistics. Underlying processes are often unknown and thus interpretation of the data is not unequivocal. It is therefore not surprising that most time in (big) data science projects is used for examining the data sources. Investigation of the data generating process is thus an inevitable step [10]. Therefore, quality frameworks as, for instance, described by [12, 13] are not usable when assessing the quality of BD sources.
When bringing the traffic intensity statistics into production, decisions had to be made concerning the size of the data. The decisions concerned the transport, storage and processing of the data. Algorithm optimization, measuring the quality of the data and the (cleaning) process were important in the development of the methodology. Within (statistical) methodology, the field of algorithmics is gaining in importance. Finally, due to limitations in data transfer and storage, we had to decide to outsource processing steps to the data owner to reduce bandwidth and storage space of the data. These are problems, statisticians have not dealt with when making statistics in a more traditional way. The final process cannot be compared to traditional statistical processes. One has to think much more in terms of process chains, where the different processing steps are done at different locations, methods used in the process are new, and even the quality frameworks, used within official statistics, are not usable for BD. As a result, some hurdles had to be taken before the process could be implemented and put into production.
In the following sections we will illustrate how current solar energy statistics are innovated using new data sources and methods and how these could proceed to official statistical products.
Current and new data sources and methods to estimate solar power
The need for detailed energy statistics
The Paris Agreement was adopted by 196 member states of the UN on 12 December 2015. The Agreement aims to respond to the global climate change threat by keeping a global temperature rise this century well below 2 degrees Celsius above pre-industrial levels and to pursue efforts to limit the temperature increase even further to 1.5 degrees Celsius. Each country that signed the agreement determines, plans and regularly reports on the measures that should be taken in order to mitigate global warming. Greenhouse gases like CO
The Dutch government has set itself the target that by 2050 the country should be energy neutral and reduce CO
SN already publishes several statistics about energy production and consumption of households (e.g. by building type) and businesses (by economic sector) like an annual national estimate of installed solar power capacity and solar power produced in the Netherlands since 2010 (based on the number of installed solar panels and the related capacity [16]). It provides data to the ‘National energy atlas’, an initiative by several ministries, municipalities and other parties to collect data sources related to the energy transition in the Netherlands. Data are also provided by other parties like the Netherlands Enterprise Agency (RVO) and the Netherlands Organisation for applied scientific research (TNO). SN also participates in the yearly publication of the current status of the energy transition in the Netherlands [17] together with its partners ECN, PBL and RVO. However there’s a growing need for faster information on a more detailed regional level, which could be provided by new BD sources.
The current method for making solar power statistics used by SN since 2003 is based on a survey under importing suppliers of solar panels (SN, 2017). These suppliers are asked how many panels (in Mega Watt) they import, purchase from other Dutch companies, deliver to other importing suppliers and deliver to installers and end users. This method provides an estimation of the total number of installed solar panels and their capacity, but it does not provide a breakdown by region or sector. In order to be able to make a such breakdown, SN has derived additional information from the Energy Investment Allowance Scheme (EIA)1 and CertiQ data about solar panels in companies (CertiQ makes a distinction between grey and green electricity by certifying renewable energy; these are the only certificates that are proof of electricity generated by a renewable sources). The number of solar panels, estimated from the survey, which cannot be allocated to a sector, is attributed to residential buildings.
The actual amount of produced solar power over a certain time period is not only determined by a solar panel’s capacity, but also by its tilt, orientation, the amount of solar irradiance caught by the solar panel and its temperature. The annual yield per solar panel is therefore weather dependent. For 2017 the estimated average yield is 0.88 kWh/Wp [18]. The yield also depends on the geographical location ranging from 0.79 kWh/Wp for Drenthe to 0.96 kWh/Wp for Zeeland.
Alternative sources & methods to estimate solar power
To investigate coverage and accuracy of the survey based method and possible extension to more regional detail and higher frequency statistics, alternative data sources and methodologies have been investigated. The approach is to first identify as accurately as possible the exact number of solar panels, their capacity and location. From there we calculate the total amount of solar power produced by solar panels in a certain time period. The relation between these variables is:
which often is simplified to:
since the exact yield of individual solar panels is often unknown.
Ideally one wants to measure directly how much electrical energy is produced by a solar panel. This can be measured by the inverter connected to the solar panels or for households or companies by a smart meter which measures the amount of electricity which is fed back to the power grid. In the latter case it is possible that (part of) the produced energy is already consumed by the household or company or stored in a battery before it reaches the smart meter (sometimes referred to as energy consumed before the meter). Smart meter data are only sparsely available at SN. Therefore we use an indirect method. We identify the number and capacity of installed solar panels multiplied by a constant (0.88 kWh/Wp), as described in the previous section.
Alternative data sources with provider, estimated coverage, frequency of availability
Alternative data sources with provider, estimated coverage, frequency of availability
In this section, three approaches using different data sources are discussed to determine number, location and capacity of the solar panels. As part of this research we also developed two additional methods to estimate the solar power yield: one is to estimate the change in consumption of grid power caused by solar power production (inferring solar power production from causal relations between solar irradiance and consumption of grid power) and the other uses citizens data (estimating solar yield using open citizen science data). In Table 1 an overview is given of the alternative data sources used.
In this approach we combine the incomplete register on solar panels with data from tax refunds to get a more complete picture of the solar panels installed. The register data was created by the Dutch network operators to better monitor the developments in renewable energy and the impact on their network. Dutch citizens are encouraged to register their equipment but doing so is not needed to benefit from the main incentive (via reduction of electricity tax). There is no penalty for not registering the panels. Hence this register is not complete.
Further information on installed solar panels can be gained from the Dutch Tax Authority. Households that install solar panels are considered as enterprises and have to file their taxes accordingly. As such, households can ask for a VAT refund of the cost and installation of their solar panels. As such, there is a considerable additional financial incentive to ‘register’ solar panels with the tax office.
The tax data which have been investigated does not exactly state how many solar panels have been bought. However the total purchase and installation cost of the solar panels can be calculated from the VAT (21%). Using a price per unit power based on the Solar Trend Rapport the installed capacity can be estimated. One issue with this analysis is that a certain percentage of the households filed for the tax refund on paper. This data is not easily available and hence it is not known how many solar panels they installed. It also has to be noted, that the tax refund started mid 2013 so no information from the tax data is available before that year. But from 2013 onwards SN has regular data: households have to claim a tax refund within 3 months of installation of the solar panels and SN receives monthly updates from the tax office.
The usefulness of these new data sources was assessed by checking the national and regional coverage as well as the information over time provided with respect to the generated power of solar panels. From the comparison with the register data it can be concluded that tax data are a viable and timely source to determine the presence of solar panels of households, but the amount of installed solar power cannot be distinguished accurately from this source only. We conclude that these data are useful as supplement to the administrative data of the Dutch network operators.
Electricity and gas supply
Changes in usage patterns of electricity and gas may be an indication that a particular household installed solar panels. For example, a substantial drop in electricity consumption or a discontinuation of a gas contract may indicate the presence of solar panels. For most households the electricity consumption will fluctuate over the years. However, after installing solar panels, the drop in yearly electricity consumption should be larger than these consumption fluctuations unless there is a major change in the household (change in household size or e.g. addition of a device with a large electricity consumption). While this idea is conceptually easy to grasp, devising a method to successfully deliver reliable results is tricky. First of all the comparison has to be done on at least three consecutive years since one has to compare a complete year without solar panels and one with panels. The year solar panels are installed is excluded. This narrows the window of opportunity where such a method can be applied. Secondly there may be many other changes taking place in a household not easily accounted for (children growing up, new family members, people leaving, new equipment) that strongly influence the energy usage patterns. The method was therefore refined to combine the energy usage client data with the Dutch administrative population register thus identifying a subset of households for which the occupancy was stable over the three years in question. This approach was iterated for multiple three year periods from 2009 until 2016. Although this is a very interesting approach, we have concluded for the moment that, based on electricity use only, it is not possible to identify households where solar panels were introduced.
Aerial imagery
In the Netherlands, high resolution aerial imagery on a national scale is collected twice a year and could reveal photovoltaic installations. PV installations may be visible from above while unknown to government administrative agencies. Computer vision techniques can be used to detect solar panels on the images. SN participates in DeepSolaris, a European project bringing together statistical agencies and research academia to apply methods to identify solar panels.
The DeepSolaris project’s aim is twofold: firstly automate the process to extract the location of solar panels from aerial or satellite images, and secondly, produce a map of solar panels along with statistics on the number of solar panels. If this project is successful in the Netherlands, Belgium and Germany, the method will be proposed as a standard to other EU countries. Machine learning techniques are used to identify the solar panels. The first tests focus on aerial images for the province of Limburg (NL), the Flanders region (BE) and the state of North Rhine Westfalia (DE). These aerial images are available at different resolutions: 10
Two machine learning approaches are considered: traditional computer vision techniques in combination with machine learning classifiers and convolutional deep neural networks. In addition, the project uses the two registers mentioned in the previous section. During the project, the register data are used for three purposes. In a first step, the existing register data are used to create training and test sets for the machine learning algorithms. The second step is to evaluate the quality of the trained classifier. The classifier is used on data previously unseen (a validation set) for which the register data are available and which are screened on quality. The results of the classifier are then compared with the data from the register, evaluating the performance of the classifier. Finally, if the classifier has been trained effectively, it can be used to extend to identify new solar panel locations. Only these new locations have to be screened by a human observer on the presence or absence of solar panels.
Indirectly estimating solar power yield
The previous methods are based on microdata. This approach uses the aggregated effect of solar panels on electricity demand on the high power grid. The production of solar power by domestic PV installations results in a reduced consumption of electricity from the high-voltage grid. Therefore the combination of time series of electricity exchange on the high-power grid and series of solar irradiance contain a hidden signal of unmetered solar power produced by domestic PV installations. Statistical time series modelling is used to estimate the solar panel generated electricity at the national level, essentially from the negative correlation between electricity consumption from the grid and solar irradiance. More specifically, through a systematic model selection approach we established an appropriate ARIMA model for grid consumption. Relations with variables such as solar irradiance, solar power, temperature and length of day are included by adding additional covariates terms to the ARIMA model and are known as ARIMAX models. In this method we are not considering PV installations directly but rather inferring solar power production from causal relations between solar irradiance and consumption of grid power.
Data from power exchanges on the electricity grid are available as open data from Tennet, the high voltage grid operator in the Netherlands. From KNMI (the Dutch Meteorological Institute) solar irradiance data are available as measured at some forty stations throughout the country. The series for the station at De Bilt is harmonised and is used in this research. De Bilt is the municipality where KNMI are located, centrally in the country. Therefore this series can serve as a sensible proxy for the country average. The 15-minute grid data and the hourly irradiance data are aggregated to daily data covering a 13 year period from Jan 1st, 2004 through Dec 31st, 2017.
The purpose of the proposed method is twofold. First, it can be used to validate existing estimates based on microdata where such estimates are available. Sec- ond, the method can be used in countries where information at a detailed level is not available or is unreliable. Compared to surveys and administrative sources a modelling approach has several advantages: a low or non-existent survey burden, low cost, ease and speed at which estimates can be obtained, and the potential to validate or improve surveys, or to reduce their frequency. A main disadvantage of modelling is a potential quality issue because the quality of the estimates critically depends on the quality of the model, and the quality of the input data which is needed in any case.
In this method the total amount of produced solar power is estimated directly without knowledge of the location or capacity of solar panels. We assume a linear relation between solar power and solar irradiance, as is ordinarily done in the literature [19]. We make some simplifying assumptions about the solar panels, though. With age the capacity of solar panels decreases. Solar panels can also become dirty, which also leads to reduced solar power yield. On the other hand, through technical innovations for newly installed systems the average capacity per solar panel increases. In addition, the increase of the number of solar panels throughout a year has a considerable effect. These effects influence the regression factor between produced solar power and solar irradiance. In the model we allow the regression coefficient between solar power and solar irradiance to differ between years. In a follow-up study we want to use more sophisticated time series models, like state space models, to estimate time dependent coefficients.
Solar irradiance leads to the production of solar power in the presence of solar panels and thus a reduced electricity demand. However, solar irradiance can also directly lead to a reduced electricity demand: e.g. when the sun shines, less lighting is needed. For convenience and due to a lacking convention we assume linearity. In the Netherlands in the years up to 2010 there was no significant presence of domestic PV installations. PV installations were introduced gradually in 2011 and 2012 and started to become more widespread from 2013 onwards. Therefore up to 2010 solar irradiance only leads to lower energy consumption. Starting 2011 there’s the additional effect of electricity production by solar panels. The data is therefore divided into two parts. Subset A contains the data from the period 2004–2010, and subset B for the period 2013–2017. We do not use data for the years 2011 and 2012 as we found that they rendered our analysis unstable, probably because of the gradual uptake of PV installations at that time. Data set A can faithfully be assumed to be collected in the absence of PV installations while during the collection of data set B PV installations were present. We use data set A to estimate the regression coefficient between the total electricity demand and solar irradiance. The result is then used in a second estimation for data set B. An underlying assumption is that the effect of solar irradiance on total energy demand is time invariant and can be transferred from data set A to B. A gradually increasing use of energy-saving electric appliances and lighting over time does not violate this assumption, because in our model the relationship between electricity consumption and solar irradiance is proportional (Buelens and van den Brakel, in preparation).
Directly estimating solar power yield
The actual solar power generated by a solar panel installation depends on many aspects such as tilt and orientation of the panels, type and brand of equipment, atmospheric conditions (such as irradiation and temperature), and surrounding objects which can create shade. Unfortunately we do not know these characteristics for every solar panel installation in the Netherlands. Therefore solar power production is estimated by scaling all PV system sizes by a representative production constant from literature.
In this approach we use direct solar power production profiles from a citizen science portal – pvoutput – to improve our solar power production estimates on a more detailed regional and temporal level. This site is used by people around the world to upload their solar panel production data. A first data analysis for the installations from the Netherlands showed that in 2016 about 550 installations streamed their production data continuously (i.e. every day) to this site. In addition, these installations were reasonably well distributed across the Netherlands, which makes it a useful data source for further study to regional and temporal variability in solar power production.
These data, covering multiple years, were analysed, allowing us to calculate daily and yearly production profiles per installation. These results are in good agreement with the literature profiles. Some common characteristics, such as reaching maximum inverter capacity or differences in orientation could even be recognised from these profiles, which increased trust in this data source and opened up opportunities for further research to the improvement of statistics on solar using new data sources.
Results
In this chapter we take a look at the preliminary results of the BD approaches to statistics on solar energy explained in the previous chapter that proofed to be useful.
Combining administrative data with data on tax refunds
A comparison between the administrative and tax data was performed to assess what the added value is of the VAT returns. While we know the administrative data to be incomplete, an expert guess puts the coverage at around 90%. Since the administrative data also contain the installation sizes and dates and the VAT data do not (though the information does indirectly point to a size and date as mentioned in the previous section), we assume the administrative data to be the ground truth. For those installations which are present in both VAT and administrative data and for which the tax declaration was done electronically, we find that the power as determined from the tax data is in reasonable agreement with the administrative data. We find that for 2014, 2015 and 2016 the agreement is 68%, 74% and 77% respectively. Unfortunately the paper declarations do not contain the same information as the electronic declarations. We know that at a given address an installation exists, but not how large it is. To estimate these installations sizes, we look at the proportion of the surface area of the roof which is taken up by solar panels at those locations for which electronic declarations were available. Here, a differentiation is made between different types of houses such as terraced, semi-detached and detached houses. Using the median value of these different distributions, the proportion of the surface area occupied by solar panels is determined for the paper VAT declaration locations. This, in turn, is multiplied by a typical solar panel power value.
Combining all of this we find that the number of new locations identified per year, between 2014 and 2016 is of the order of 4 to 5% of the total known installations found by other means such as the administrative data. In terms of the proportion of power these installations produce, the number is somewhat smaller at around 3% annually. We conclude that the VAT data are a useful additional source for the identification of solar panels and that, combined with the administrative data, provide a more complete view on the amount of solar power produced in the Netherlands.
Aerial images
As stated earlier, aerial images in principle can provide a 100% coverage of the available solar panel installations at two points in time each year. To retrieve the location and the size of the solar panel installations a visual inspection of the images has to be done. A manual inspection of the aerial images however takes a lot of time and manpower. Therefore, at SN we are investigating machine learning and computer vision approaches to either assist the human observer (inspect the houses for which the algorithm returns a high uncertainty) or to automate the whole process entirely.
A comparison of VGG16 accuracy, precision, recall and F1-measure on different datasets
A comparison of VGG16 accuracy, precision, recall and F1-measure on different datasets
Time series data for the year 2016 is shown as an example; data for the period 2004–2017 is used in the article. Left: electricity use from the grid (MWh), data provided by the TSO Tennet. Right: total daily solar irradiance in De Bilt (J/cm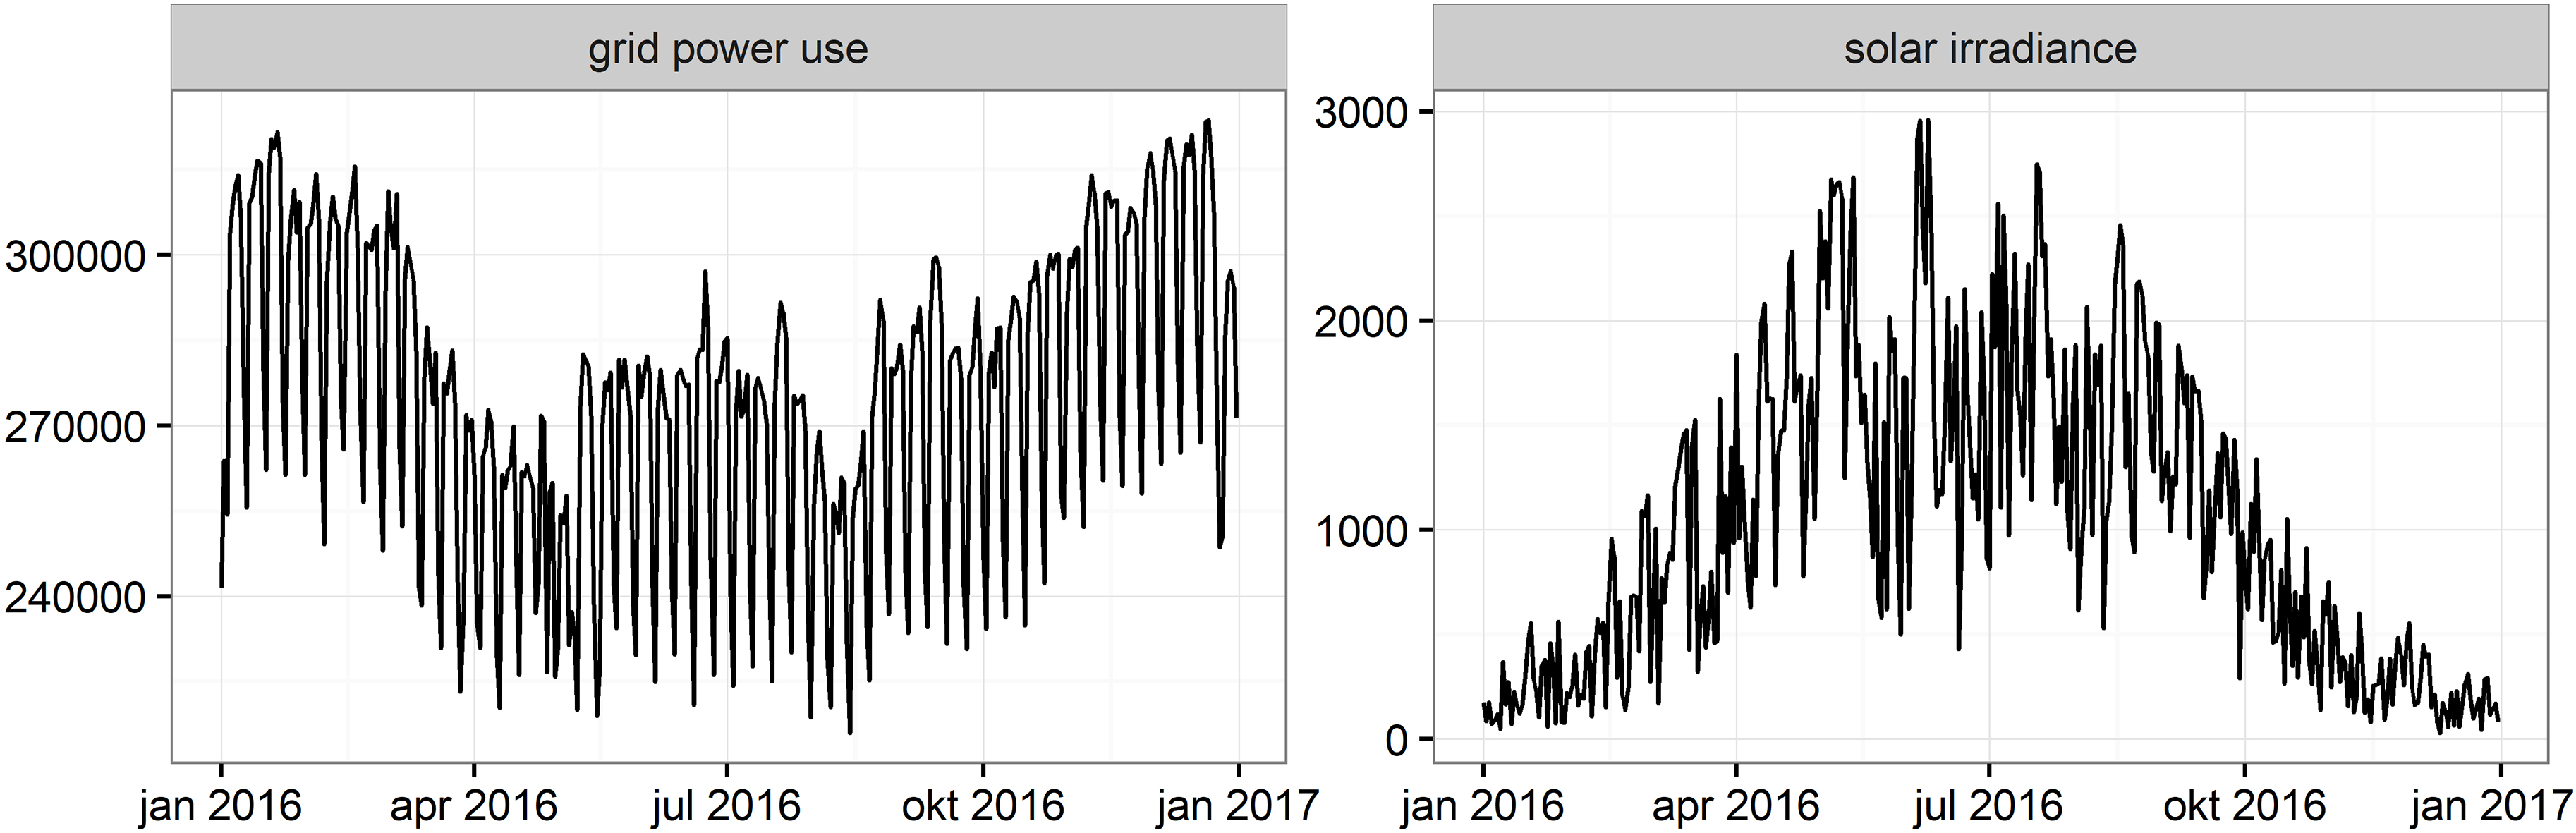
In a first attempt, a well-known convolutional neural network from the literature (VGG16) was taken and trained on a standard dataset [20]. The VGG16 is a convolutional neural network developed for the ImageNet Large Scale Visual Recognition Challenge (ILSVRC) and is a standard architecture available in most deep learning toolkits [21]. The pre-trained version contains the weights that were trained on millions of images of ILSVRC and therefore provides a high performance classifier that performs well on a large range of visual classification tasks. By using the pre-trained weights as a starting point for training on new datasets high levels of accuracy can be achieved with small datasets; a training method called transfer learning. To furthermore adapt VGG16 to the domain of aerial images and solar panel classification the network was trained on a large and annotated dataset with solar panels in California [22]. This network was then evaluated on other datasets: (1) another dataset for California, (2) a dataset for Northrhein Westphalia Germany (NRW), and (3) a dataset for Heerlen, the Netherlands. For all datasets, the accuracy, precision, recall and F1 score were evaluated (see Table 2). To provide a standard for comparison, the performance on the validation set was also included in Table 2. As can be seen in Table 2 the performance for the Fresno California dataset is similar to the performance on validation set, not surprisingly, as both datasets are from the same region. The performance for Northrhein Westphalia is not as good, but still quite high with 82%. For Heerlen preliminary results are shown. The representativity of the training dataset and the transferability of the model trained on other areas are still under investigation. While not accurate enough to perform fully automatic classification of solar panel pictures, a VGG16-based classifier with this performance can serve as a pre-screening stage for a human annotator, checking just those pictures that receive a low confidence of being in either category. In future work, we will investigate ways of improving classifier performance on datasets previously unseen by the model and hence the external validity of the model; in that way improving pre-screener accuracy.
Figure 1 shows the series of grid consumption and solar irradiance for the year 2016 as an example, which are used to model the hidden signal of unmetered solar power produced by domestic PV installations.
Grid power use shows an oscillating pattern on a weekly basis which can be attributed to lower grid consumption in the weekend. Grid power use is also lower in summer than in winter, which as explained before, can be due to domestic solar power production and an intrinsic lower grid demand when the sun shines. The regression coefficient of solar irradiance in data set A is indeed negative which means that the total demand for power decreases when solar irradiance intensifies. In countries with a hotter climate where air-conditioning systems are commonly used, this could well be different. Solar irradiance is higher in summer than winter and has a relatively high variance.
Following the method described in Section 3.2 and through a systematic model selection approach we established an appropriate ARIMA model for grid consumption dominated by autoregressive components (of order 6), and several additional covariates including average daily temperature, the length of the day, and a calendar effect (day of the week). We added solar irradiance to the model as an independent variable, attributing residual variations in grid consumption to variations in solar irradiance to the extent that both series correlate. Assuming there is a stable dependence of energy consumption on solar irradiance, the model provides an estimate of level changes of grid consumption due to unmeasured solar power generation. This is shown in Fig. 2. The increase in solar generated energy over the years 2013–2017 is clearly visible, as is the annual pattern of low solar power generation in winter and high generation in summer. Percentage of solar power increases from 0.14% in 2013 to 1.81% in 2017. In 2017 the total generated solar power is 1.87 million MWh or 1.87 TWh.
Estimated solar power for the years 2013–2017 in MWh.
The total annual power quoted at the end of the previous paragraph would allow for a theoretical calculation of the average output per solar panel. The number of solar panels can be determined by consulting, for example, an administrative source such as the registers and tax refund data. Alternatively, if the number of solar panels is unknown, this can be estimated by considering the output from reference systems such as those in PV Output, for which the number of solar panels is known. In summary, the indirect method can be useful in the following situations:
Determining the total solar energy produced in a region (and not necessarily the number and capacity of the solar panels in that region), because this total quantity is essential for balancing the grid in that region. Quality check for administrative registers if an average output of solar panels in the region is known and one isn’t sure if all the solar panels are registered.
Pvoutput system size versus generated power.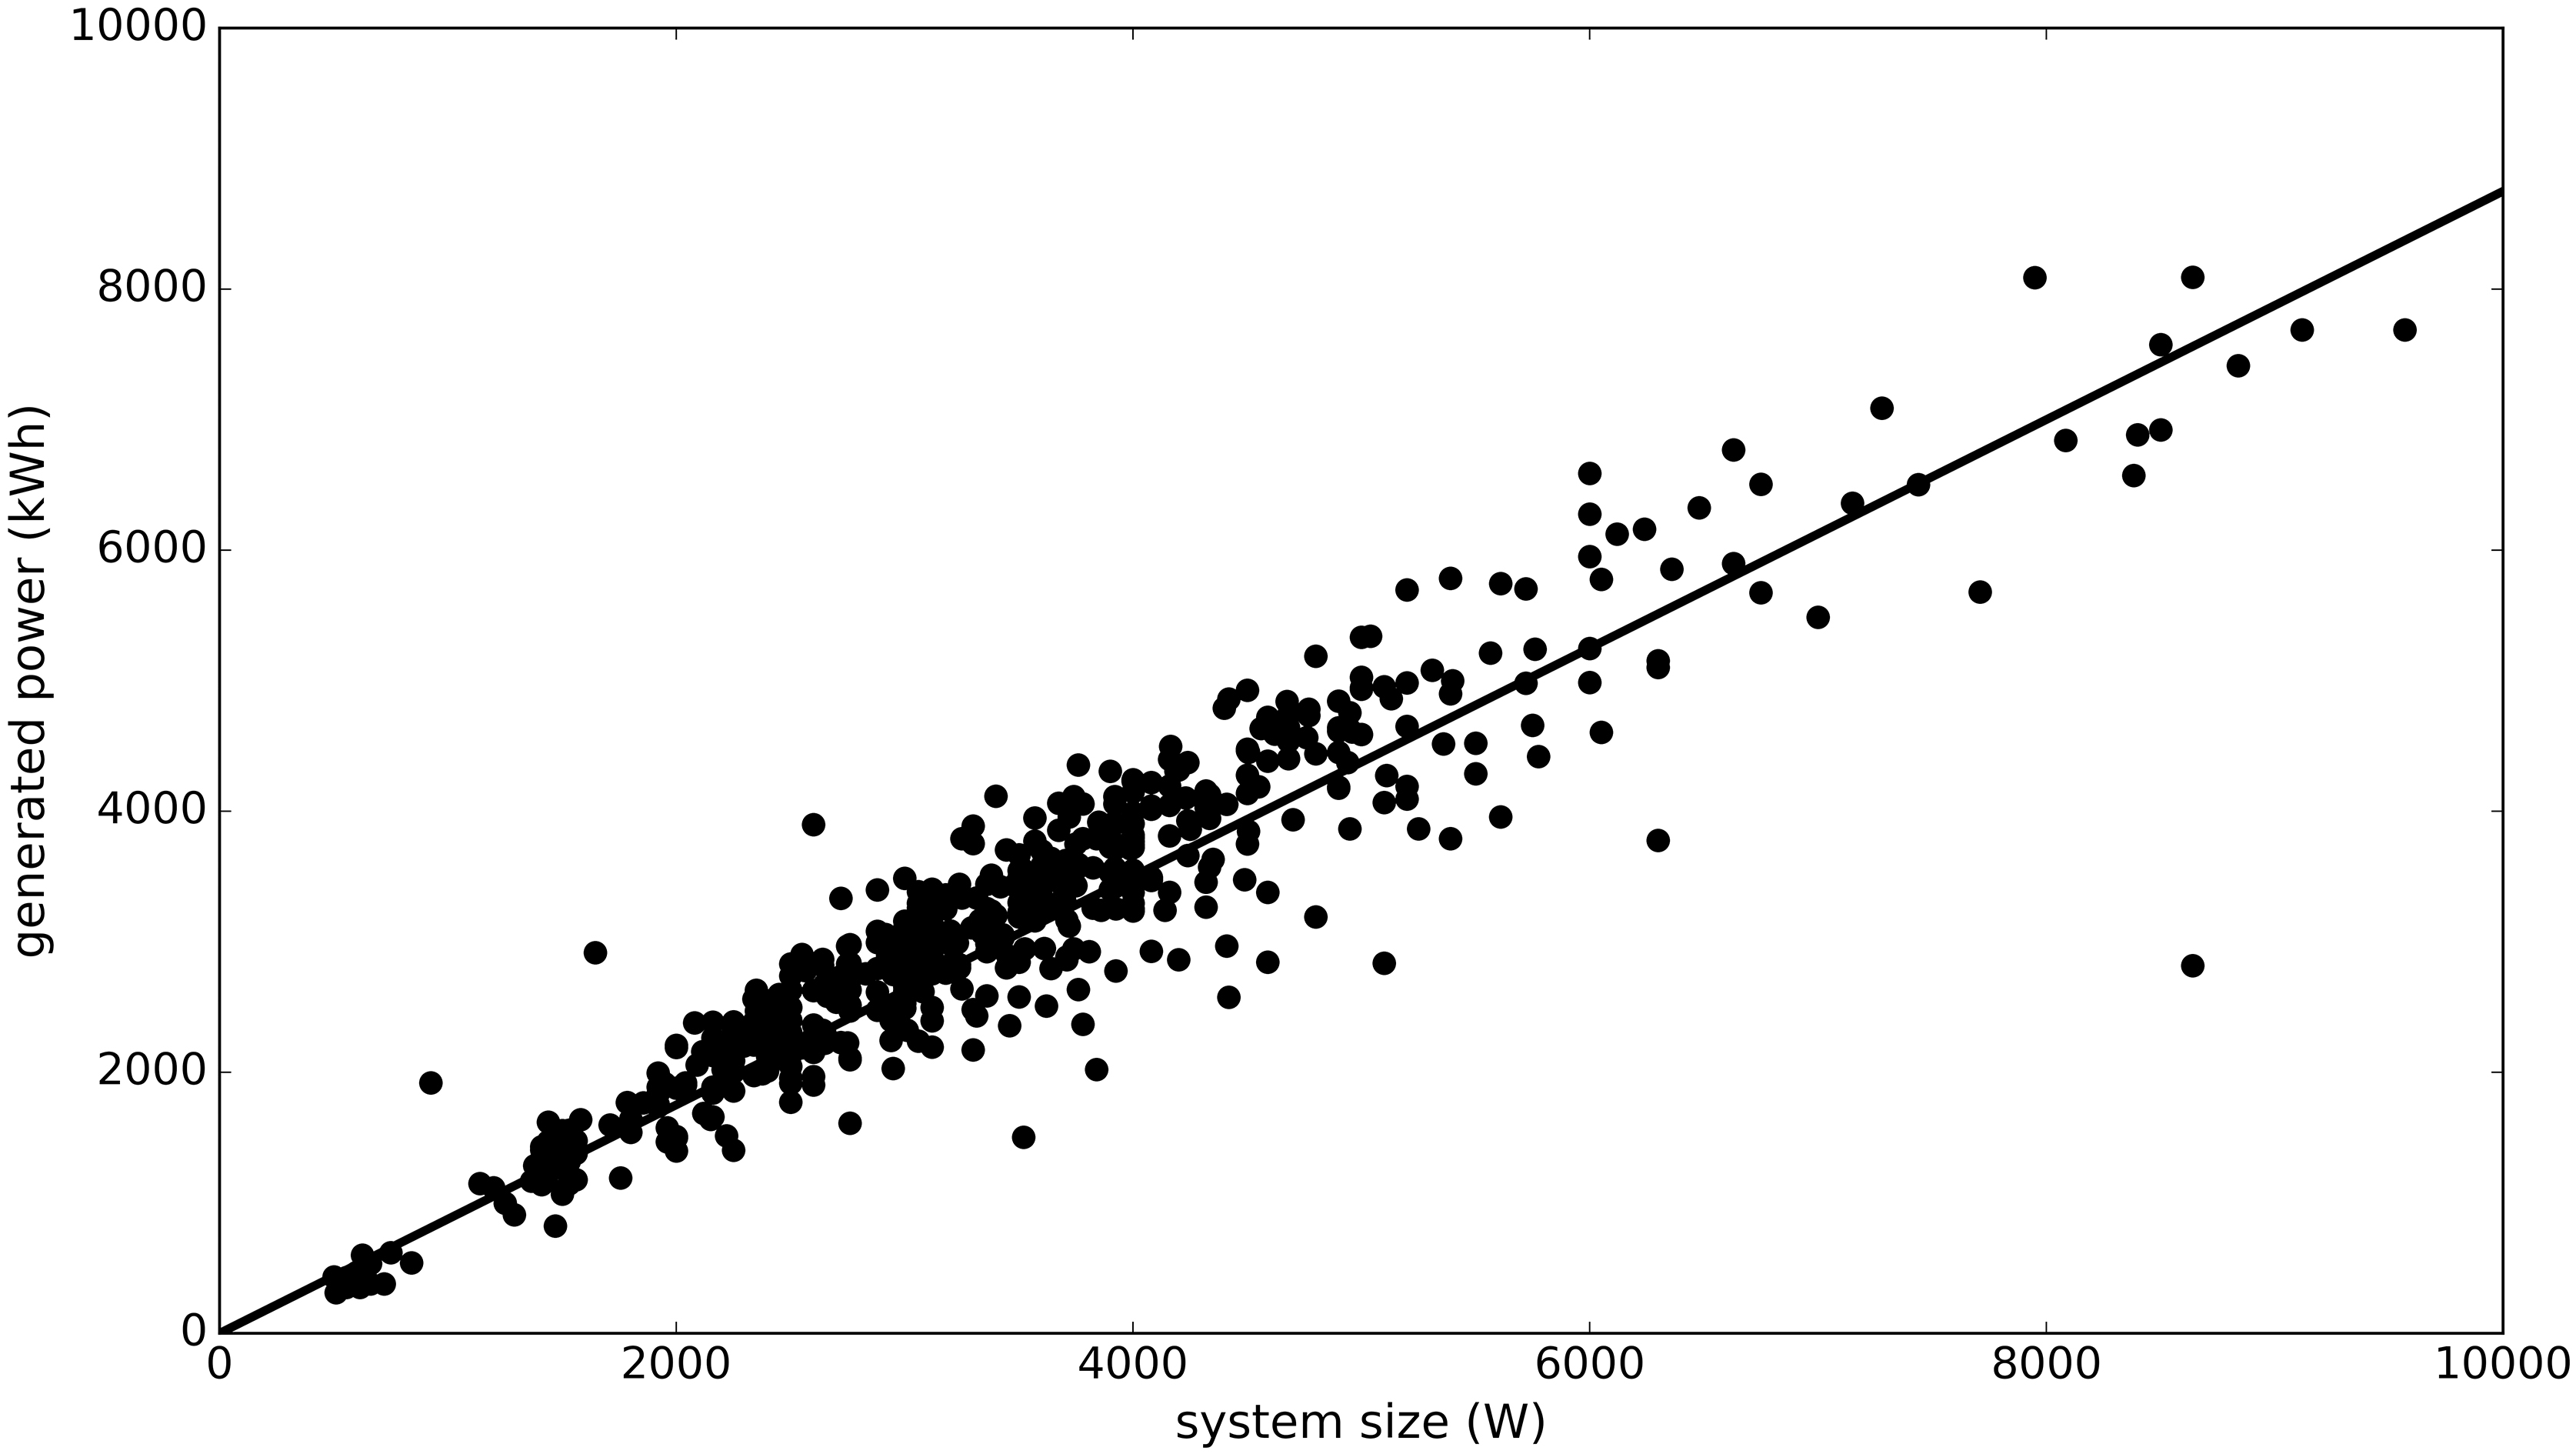
Comparison of our model results (solid line) with official statistics published by CBS on total solar energy consumption (dotted line) and the amount consumed by households (dashed line).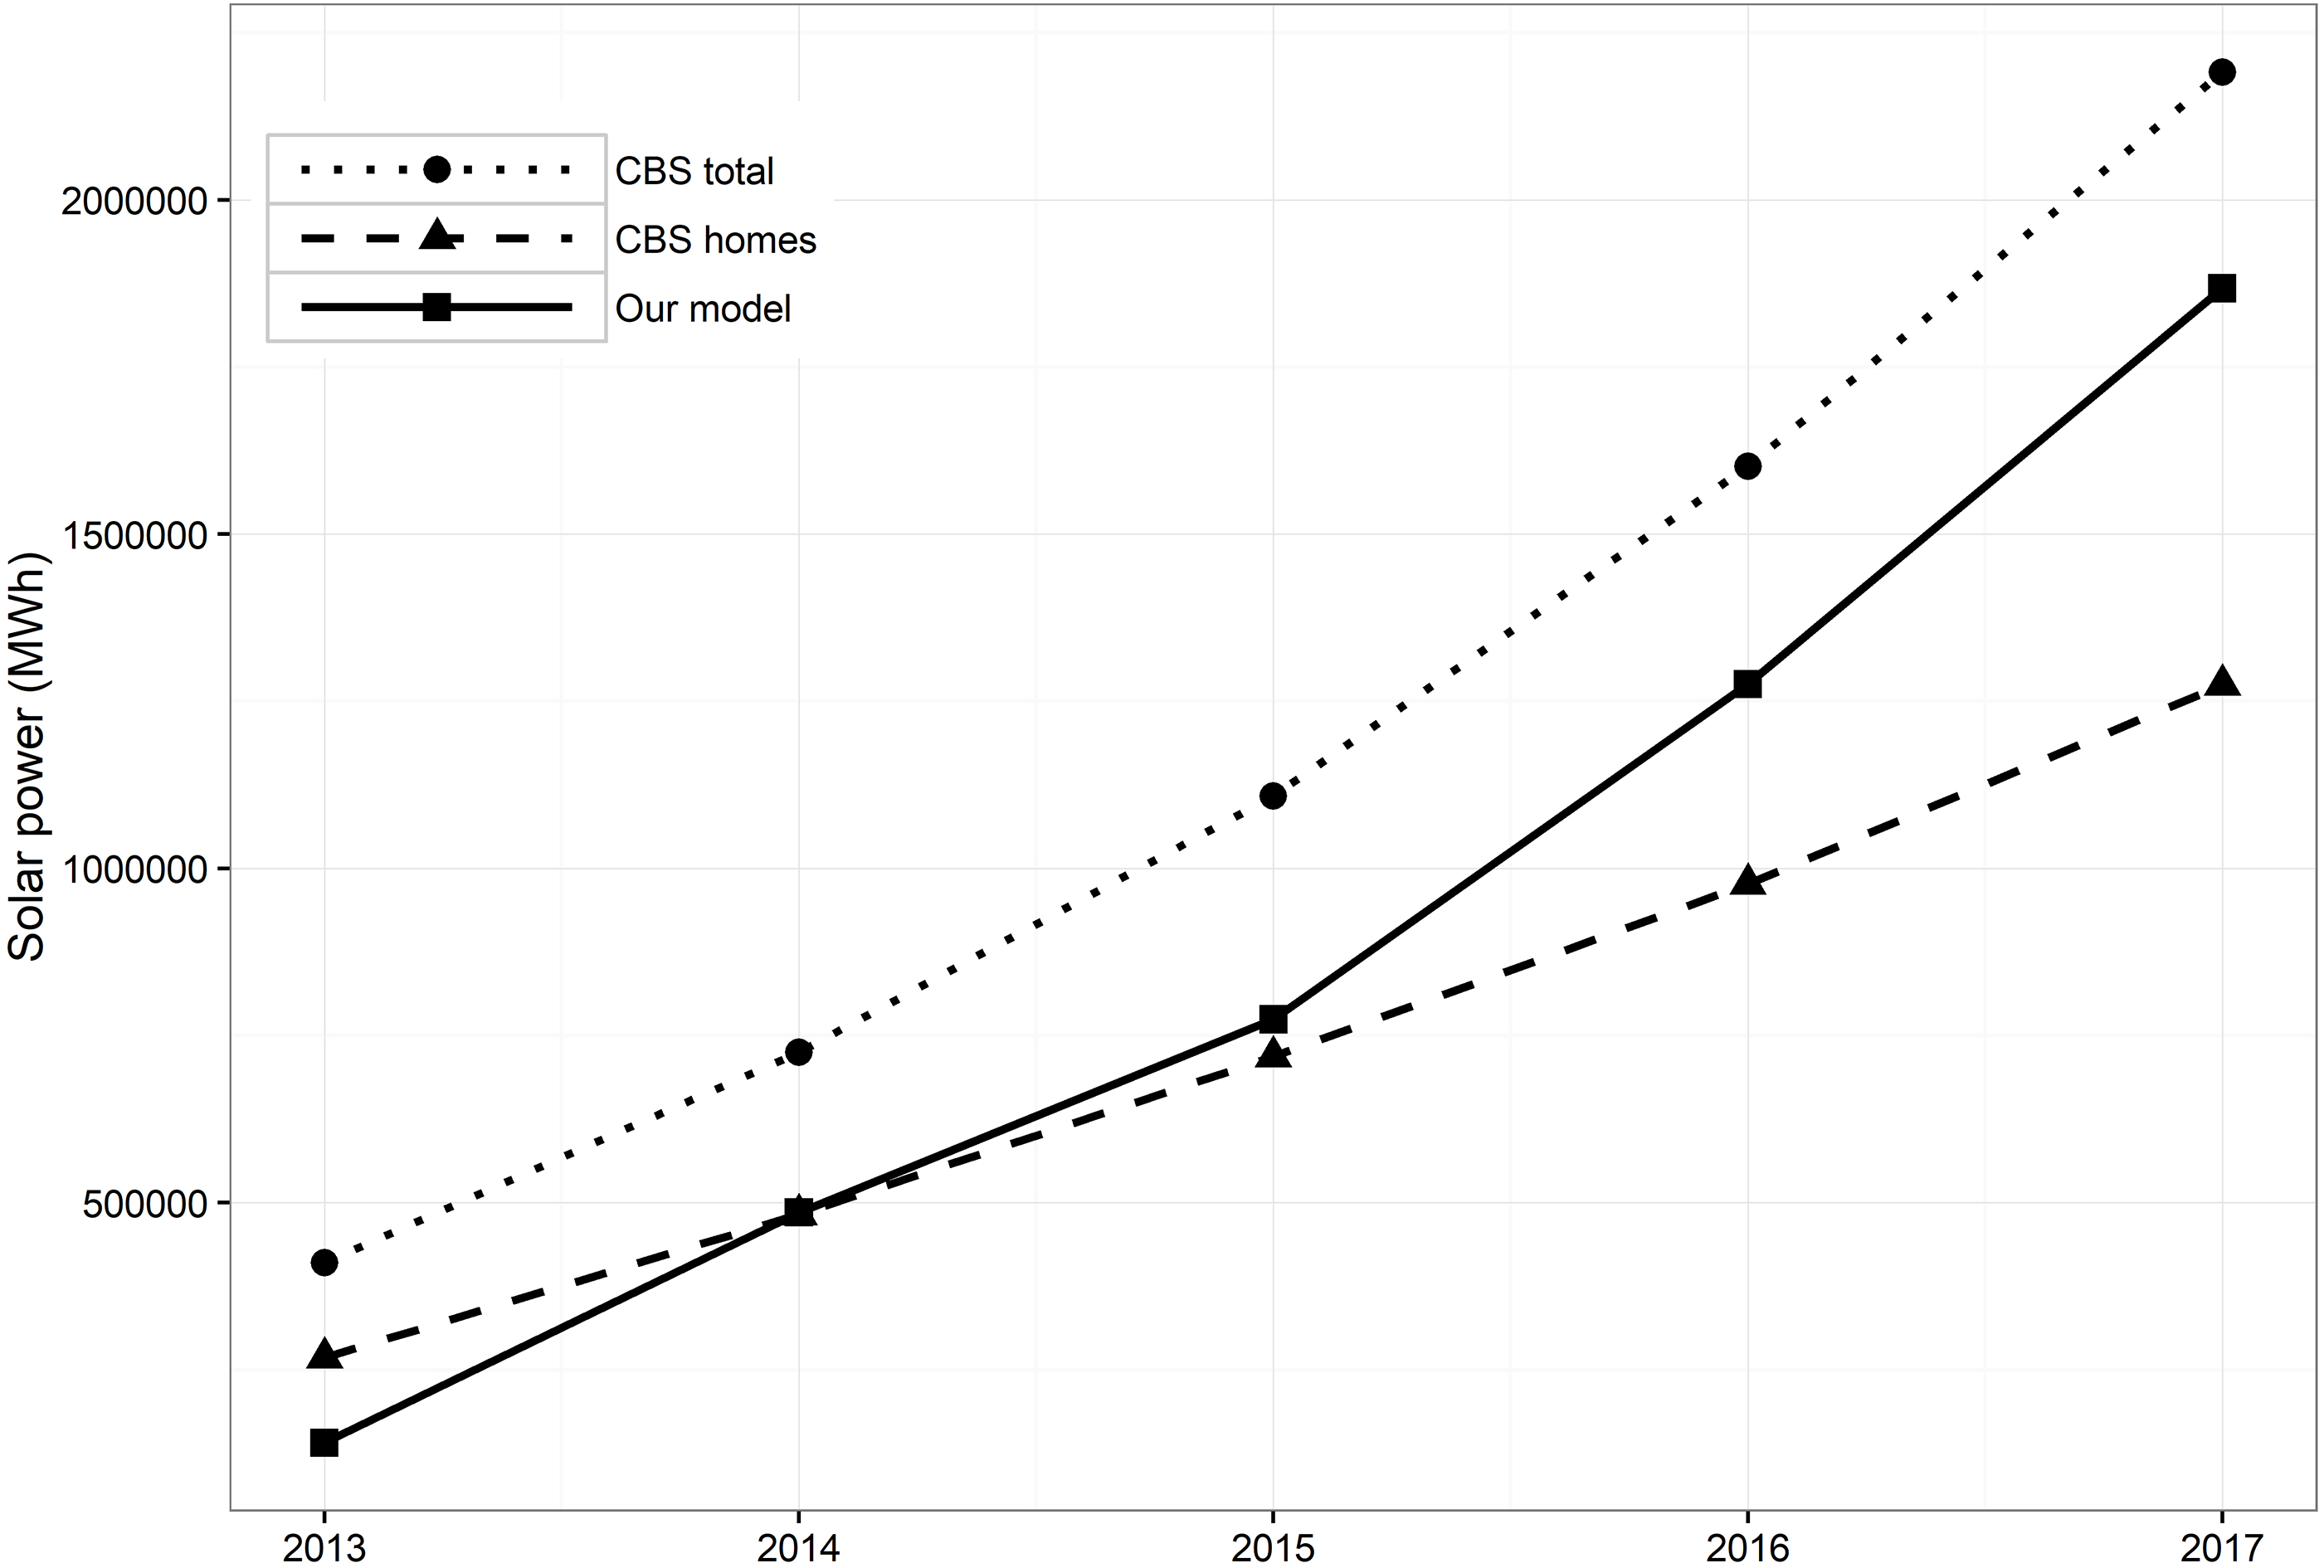
With respect to the direct estimation of solar power production using pvoutput: the first results indicate that the annual pvoutput totals are in reasonable agreement with the estimated totals, as would be calculated according to the scaling production constant. This becomes apparent when considering Fig. 3 (pvoutput system size versus generated power), which shows the pvoutput system size versus the annually generated power. The black line shows the aforementioned scaling constant. One interesting observation is that installations do not only produce less power than expected, there are also a number of installations that generate more power than could be expected. This is something to be explored further. All in all, the results are a starting point for the design of a more refined model to calculate solar production statistics, which will be reported on more extensively in another paper.
Comparing results
It can be expected that the direct approach to calculating solar power production using an up to date administrative register of solar panels, extended with panels identified from tax data and possibly from aerial images, using production constants based on exact measurements from citizen science panel data, combined with data on irradiance per time unit and location will be a sound base for next generation solar production statistics. However, this can be said if all the pieces fit together and at time of writing we only have partial results. However these results are promising.
It can also be expected that every approach has its pros and cons. A downside to the indirect modelling approach is a potential quality issue caused by the quality of the model or the input data. Therefore one of the following steps will be to validate the model for a different region. This could be a different country or a smaller region within the Netherlands for which the required data is available. For smaller regions the correlation with solar irradiance could even be higher. As an alternative quality check we compared the estimates of the model with official statistics based on the administrative data. The results are shown in Fig. 4. The official estimates of domestic PV in the years 2013, 2014 and 2015 and our model estimates are close. Both estimates diverge in 2016 and 2017. This might be due to an increase of unmetered solar power installed by small businesses, which are also included in our model estimates.
Discussion
Towards best practices in the transition from beta to offstat
Best practices in the transition from experimental to official statistics should be seen in a wider context. Official statistics should offer an accurate reflection of the social and economic society. The European statistical legislation outlines reliability as one of the core principles of official statistics: they should reflect reality in a reliable, accurate, consistent and reproducible manner [15]. Official statistics have increasingly become “phenomenon-oriented”. In order to understand complex phenomena, as many data sources as possible should be gathered and combined. The challenge lies in being able to combine the information in such a way that a coherent story or description can be provided about the observed phenomenon.
When transforming a beta product to an official statistic based on new data sources, one has to think of several steps in the process. In this paper, we focus mainly on issues such as data, method, output and process. One should have a good feeling of the quality of the used data. Since metadata of new data sources might be less, metadata should be made available and interpretation of the definition of used variables should be clear and consistent. Differences in variable definitions between different data sources have to be made explicit. The coverage of the data should be known or investigated. How well does the data source relate to the target population? Often data sources are used which have not been used before. Only after performing explorative data analysis for a longer period one can understand the nature and quality characteristics of these data. Part of the implementation process is performing such continuous quality monitoring system. It is also important that the data measures what is intended and therefore the measurement error needs to be assessed for every source being used in the analysis. Finally the stability of the source is essential. Successful research on a new data source does not guarantee that it is also fit for production. One must make sure that the required information can be extracted from the source, or pre-empt changes, so that future output is guaranteed.
Standard, proven methods should be applied as much as possible. However new data sources might require new methods. They should be justified, explained and if useful, the new methods should be added to the standardised methodology handbooks for further re-use. A validation assessment of the new method needs to be undertaken through peer-review. In case a choice has to be made between several methods, these should be compared and a clear decision should be taken and documented with respect to which methodology provides the best results and stable output. On the IT side, algorithm design and efficient computing (sometimes referred to as high performance computing) is often required for implementation in a continuous production process. Also new tooling or IT infrastructure available to implement the beta product into the statistical process could be necessary.
On the output side the core principles of official statistics are important: reliable, accurate, consistent, reproducible and repeatable. For stability, assumptions should be made explicit and justified based on the literature wherever possible. These should be regularly re-tested as part of the implementation process. Results should be validated (and cross-validated) through comparative analysis of other national or regional data and disclaimers of the initial beta product addressed. The results should also be reproducible and repeatable based on the same or similar data (although maybe differently structured) at different time intervals by different researchers. This may be a problem with BD as many of them are too big to store and archive, or when only aggregate data from a dynamic BD source is used (such as in the case of social media). With new data sources, especially BD, new legal and ethical issues may arise, which have to be addressed. Output should not be hampered by them. Also different legal boundaries might apply for experiments and a continuous production process.
It is important to involve domain specialists from the start in the development of a new Beta product in order to maximally exploit the knowledge on the subject and to allow a smooth acceptance and incorporation into the existing statistical production process. Early publication of the Beta product helps in order to get users’ feedback on relevance and usability of the product as well as getting users familiar with a different statistical output (these are often visual products, data portals or dashboards). Ideally, an efficient standardised migration process should be in place within the organisation to allow a harmonised and transparent transition from beta to offstat. In practice, however, the transition process will depend on the type of new statistic: whether it’s a completely new statistic, a supplement to or extension of an existing statistic or it will replace an existing statistic.
From beta to offstat for solar energy
Although the approaches presented in the previous section are works in progress, we are confident that the principle of a combined approach using different angles and data sources is very promising. A short assessment of the aforementioned criteria for the case of solar power is presented below.
A powerful energy dataset can be obtained by combining stable sources such as register data (SN has access to these by law) with data that could be labelled as less stable (e.g. aerial images), open data (citizen data PV output, KNMI and Tennet data) or for which access depends on clear agreements with data owners (smart meter data). The power of such a combined dataset lies in joining different variables for the identification of solar panels (e.g. registers versus aerial pictures) which yield a more complete picture of solar power. Metadata were limited in some cases. Therefore a good partnership with data owners is crucial in order to address certain questions during the process.
Methods used for linking of administrative sources can be considered as standard methods which have been used previously and validated within SN. Time series modelling is now common practice. However, the ARIMAX model used to estimate solar power from grid load still needs to be validated with other sources in order to verify the accuracy with which solar energy generation is being measured. Preferably the model should also be applied to other countries or on a different geometrical scale to test its validity. Since the underlying physics are the same everywhere, the model shouldn’t be specific to the investigated area (the whole of the Netherlands). Relatively new to SN are state of the art machine learning techniques, which are a key ingredient to data science [23]. Knowledge on how to apply these techniques is fast becoming embedded at SN with several staff members being very skilled in machine learning algorithms. In the context of this paper, this was demonstrated with the detection of solar panels.
Output of the estimate of solar power based on microdata (number of solar panels multiplied by average yearly assumed output) is already being checked and validated at the level of the statistical division. Results are reproducible but detail by region and timeliness should be increased. The modelling approach to estimate solar power from grid load has not been validated and should therefore be considered as beta (experimental) output. The approach offers a lot of potential for estimating solar power generation from weather data in a timely manner. For all applied methods, data visualisation products are offering more user friendly output than tables. There are legal issues involved in that individual households must not be identified but this issue is being addressed in that no individual data are leaving SN.
Domain experts were involved from the beginning and are still involved in the process of developing the beta statistics. They are relied upon for their knowledge as well as guaranteeing a smooth transition into the statistical production. The challenges lie in further increasing data science skills throughout the statistical office, as well as spreading knowledge on modern statistical and data processing languages such as R and Python. First steps for a transition have been made where data sets and skills have been transferred to the statistical division. Further steps need to be made in order to improve the development of the beta statistics and transition to an official statistic. Good communication with domain experts in statistical divisions is a crucial key for success.
In line with the criteria presented earlier, the results of the approaches will be published initially as beta products or experimental statistics as they do not carry the official statistics quality label. This makes it possible to collect feedback from stakeholders and the general public. It also allows us to continue developing a strategy on detailed energy statistics products that could support national and local governments implementing the energy transition. As such, SN is increasing the scope of its role for tackling complex societal questions. Extra information is produced alongside the official, traditional, table-based statistics which can contribute to the shaping of timely policies at a national or regional level.
Conclusions
There are several conclusions to be drawn: the process from beta to official statistic and the solar energy case study. SN has built up experience with experimental statistics using new data sources over the past years. Two cases were used to illustrate the experiences we built up along the way and best practises were formulated based on those experiences. We demonstrated this in the field of energy statistics, i.e. the estimation of solar power. This exercise allowed us to identify some key issues. We have demonstrated the power of combining several data sources that have different strengths in terms of data quality and timeliness. We have also shown the potential of using new methods not traditionally used for producing official statistics. Different types of output in the form of visual products or higher resolution (regional) output have proven very powerful in answering the user’s needs and in turn being more user friendly. The process demonstrated a great need for diverse data science skills among official statisticians in order to process, analyse, visualise and make the innovative statistical output. This highlighted the necessity of a workplace culture change i.e. transitioning from a cyclical production work pattern to a more experimental working culture with data science at its core. We would like to draw attention to the innovation website of SN www.cbs.nl/innovation, where all beta products are published.
Footnotes
Companies can use the Energy Investment Allowance (EIA) to invest in energy-efficient technology and durable energy under favourable fiscal conditions. On average the EIA, commissioned by the Ministry of Economic Affairs and Climate Policy, gives them a 13.5% tax advantage.
Acknowledgments
We like to thank Mr. Ruud Kempener for valuable comments on the paper about EU energy policy.