
Abstract
This paper discusses the opportunities and challenges presented when utilizing scanner data to compile the CPI, with a focus on implementation guidance to national statistical offices. Empirical results for the Australian CPI are examined following the implementation of a multilateral price index method in December quarter 2017.
Introduction
The environment in which statistical agencies operate is changing. New opportunities to access and interrogate big data are becoming available, increasing the potential to provide new insights into matters of importance. The statistical landscape is becoming more complex, expectations of decision makers are growing, and National Statistical Offices (NSOs) are being challenged to deliver the best possible statistical program in more efficient and innovative ways.
The launch of barcode scanner technology during the 1970s, and its growth in the 20th century, has enabled retailers to capture detailed information on transactions at the point of sale. Scanner data is high in volume and contains information about individual transactions or summaries, date, quantities and values of products sold, and product descriptions. As such it is a rich data source to NSOs that can potentially be used to enhance their price statistics, reduce respondent burden, and reduce associated costs of physically collecting data.
In this paper we discuss the opportunities and challenges presented when utilizing scanner data to compile the Consumer Price Index (CPI); provide implementation guidance to NSOs; and examine empirical results for the Australian CPI following the implementation of a multilateral price index method in December quarter 2017. Section 2 outlines some practical considerations regarding the acquisition of scanner data sets, the assessment and preparation of the data, and implementation issues. New methods that have been developed to construct price indexes from scanner data sets, so-called multilateral methods, are presented in Section 3. Section 4 discusses the assessment of the new methods, communication with users and stakeholders, and publication and dissemination of the ‘new’ price indexes. In Section 5 we present a case study of the Australian CPI, with a focus on implementation challenges and empirical results. The CPI series presented in this paper is the result of re-calculating the CPI series using multilateral index methods for the period March quarter 2014 to December quarter 2017. Section 6 presents conclusions.
Practical considerations
Introduction
The availability of scanner data provides opportunities to improve the accuracy of the CPI. Scanner data sets typically contain complete coverage of items sold by a retailer at all their locations; as well as item quantities sold and revenue received by the retailer for these items. With this information, NSOs have the potential to improve the accuracy of the prices used to compile the CPI by calculating unit values for homogenous products; improve the samples of items priced, with the potential to utilize a census of items sold to compile the CPI; and use quantity/revenue information to weight items according to their economic importance. While scanner data sets present opportunities to improve the accuracy of the CPI, there are also challenges that need to be overcome before NSOs can utilize scanner data to compile the CPI.
This section describes some of the most important opportunities and challenges presented by scanner data sets; outlines practical considerations; and provides insight and advice to enable the use of scanner data to compile the CPI.
Obtaining scanner data sets
Scanner data have existed for several decades and their value in the compilation of official statistics has become evident over time. One challenge faced by NSOs is obtaining the scanner data sets. Two main options are available. NSOs may seek the supply of scanner data sets directly from retail businesses or from third party data providers. Both options present benefits and challenges.
Several NSOs, including Australia, the Netherlands, New Zealand, Sweden and Switzerland, have successfully negotiated the supply of scanner data directly from retail businesses and are using these data in the compilation of their CPI. Direct collection of data sets from retail business has a number of potential benefits. These include the ability to negotiate the supply of the data set at no (or minimal) cost, the scope of items included in the data set, and the level of item aggregation to ensure homogenous information.
Negotiating the supply of scanner data sets directly with retail businesses presents challenges as well. The primary challenge is that the bilateral negotiation of scanner data sets with retail businesses is resource intensive. Experiences in the Netherlands, Switzerland and Australia suggest these negotiations will take approximately six months to complete. France introduced legislation for the transmission of the data, which turned out to be useful.
An alternate approach to obtaining scanner data sets directly from retail businesses is to source these data sets from intermediaries or market research companies. Market research companies like Nielsen and GfK possess scanner data sets that have been obtained by some NSOs for CPI assessment and compilation purposes [1]. The primary benefit of this approach is the ability to negotiate the supply of multiple data sets relating to a diverse set of products with a single or small number of data providers. Another benefit is the receipt by NSOs of ‘clean’ data, which reduces NSO processing costs.
Assessing and preparing scanner data for use
If the NSO is successful in securing scanner data, the data has to be turned into information that can be effectively and efficiently used to compile the CPI. Apart from the need to having staff with appropriate skills to interpret, process and utilize big datasets for official statistics, the NSO has to overcome a number of challenges.
Developing an Information Technology (IT) system
Scanner data are by their very nature big data. The NSO requires an IT/computing system that can acquire, store and process the large scanner data sets if the information is to be used to compile the CPI. This IT system needs to be able to acquire and process data sets that have different classification structures, formats and contents. This is because retail businesses (and third-party data providers) normally develop bespoke systems for their own internal reporting purposes. A few NSOs have documented the challenges presented by the need to develop an IT system as well as their various approaches to address these challenges [2, 3]. The solution is dependent on the local context.
Classifying scanner data
Scanner data sets generally possess product clas- sifications that are unique to the individual retailer. The NSO will most likely receive data sets that contain different product classifications which need to be mapped to a single CPI classification. The classification of scanner data sets is likely to require significant NSO resources. The largest investment of resources is needed when the data sets are first received by the NSO; however, there is a need to provide ongoing classification resources as new products enter the data set.
The challenge of classifying scanner data items to the CPI classification has been addressed by NSOs in various ways. The Swiss NSO has classified scanner data items to the CPI classification by purchasing market research metadata [4]. Some NSOs have, for various reasons, undertaken the entire classification of scanner data items to their CPI classification within the NSO [5].
Several NSOs have been exploring the use of machine learning methods for classifying scanner data [6] as well as prices ‘scraped’ from websites [7]. These methods use an input dataset either of pre-classified items (supervised learning) or unclassified items (unsupervised learning) to model which features tend to distinguish between item categories. The resulting model can then be used to classify new datasets. These methods are particularly promising where the product classifications used by retailers differ from the classifications desired for CPI compilation.
Quality assurance of the scanner data sets
Scanner data sets are a new data source to compile the CPI. As is the case with any change in data source, the compilers of statistical series should undertake a range of ‘checks’ to ensure the new data source provides the foundation from which to produce fit-for-purpose statistics. These scanner data checks can be classified as either global checks or detailed checks.
Global checks relate to broad quality measures that are generally applied at the time the NSO receives the data set. These checks aim to ensure the data set is broadly consistent with data sets received by the NSO from the same data provider in previous periods. The checks may relate to the format of the data set; the total number of products within the data set; and the total revenue by outlet. These global checks should highlight significant errors with the data set.
Detailed checks are generally applied at the product or product group level. These checks aim to highlight significant changes in the quantities sold, revenue and the prices of the products within the data set. These detailed checks have traditionally been referred to as micro-editing of price data.
Implementation – from confrontation to new methods
The benefits and challenges of utilizing scanner data sets
The use of information contained in scanner data sets to compile the CPI can represent quite a significant change to the data collection practices and the price index methods traditionally employed by NSOs. This suggests that these changes need to be carefully managed, both in terms of the statistical impacts as well as communication with users and key stakeholders. A detailed description of communication strategies associated with scanner data implementation is given in Section 4.2.
Scanner data potentially enable the accuracy of the CPI to be enhanced in a number of ways and at lower cost. The scanner data sets can be used to: (i) undertake data confrontation; (ii) replace field collected prices; (iii) expand pricing samples; (iv) weight products at the lowest levels of the CPI structure to reflect their economic importance; and (v) implement methods that possess desirable price index properties and enable process automation.
The enhancements listed above each improve the accuracy of the CPI. A number of NSOs have utilized scanner data to achieve some of these enhancements, particularly (i), (ii) and (iii). While these enhancements are significant, implementing (iv) and (v) will maximize the use of scanner data to enhance the quality of the CPI. Of note, some NSOs have gradually implemented each of the enhancements listed above [8] while other NSOs moved directly from enhancement (i) to (v) [9, 10]. Both approaches are valid and often reflect the local context in which the NSO operates. The next five sub-sections describe the benefits of utilizing scanner data sets for each of the enhancements.
Using scanner data sets for data confrontation and quality assurance
Scanner data sets contain product quantities sold and revenue received by the retailer for these products for some period of time, usually a week or a month. This information enables NSOs to calculate a price for an individual product by dividing a product’s revenue by the quantity sold. This price is referred to as a unit value and represents the average price experienced by consumers over a period of weeks or months. It should be noted that revenue data may not align perfectly with the purpose and concept of the national CPI because it may include expenditure by non-resident households and businesses [11].
For a homogeneous product, the unit value more accurately reflects prices paid by consumers over the whole period than point-in-time pricing [12]. Unit values contain discounts and the effects of these discounts on the quantity of products sold. The period for which unit values are calculated is important in terms of the accuracy of the unit value. Unit value prices used for constructing the CPI should be for the same period as the index to be constructed, rather than for a sub-period [13]. The latter approach can lead to an upward bias in the CPI. It is acknowledged that NSOs may use a sub-period of the reference period due to data supply timeliness and publication deadlines. The bias and variance introduced can be assessed by comparing indexes compiled using a sub-period of data with indexes compiled using the full reference period [9].
Price analysts are able to compare the prices collected in the field to those calculated from the scanner data sets. This analysis provides insight into any biases introduced to the CPI from point-in-time pricing compared with unit values. An analysis of the product revenue and quantities sold can be used by the NSO price analysts to highlight where CPI samples could be improved.
Using scanner data sets to replace field collected prices
Utilizing scanner data sets to replace field collected prices generally results in NSO resource savings. This is because NSO field officers are no longer required to visit businesses where prices were collected. Replacing field collected prices also presents challenges. Unit values should relate to a single homogenous product whose specifications should remain constant over time because changes in the composition of products sold and the quality of products should not be reflected in price changes [14].
Several NSOs have experience in producing unit value data from scanner data sets. In some countries the use of Stock Keeping Unit (SKU) has proven to be successful [5], while the use of barcode and the corresponding Global Trade Item Number (GTIN) may not always work well [15]. GTIN may be too low a level of detail, differentiating products by product aspects, such as packaging, which are considered irrelevant to consumers. While these detailed data reflect homogenous products, the problem of relaunches often occurs: when barcode (GTIN) is used as item identifier, the price change of a homogenous product whose barcode changes at the same time will not be measured.
An essential part of price measurement is accounting for quality change and the introduction of new items [14]. Accounting for quality change is particularly challenging when using scanner data sets. Scanner data tend to exhibit a high level of churn in the products available from month to month. There are new models (and versions of models) of products becoming available in the market and old models dropping out of the market as they become obsolete. Calculating quality adjusted prices is therefore difficult.
There are broadly three scenarios where there is a need to quality adjust prices obtained from scanner data sets. They are: (1) where new items are brought into the price samples, including as replacements; (2) where there has been a quantity change (e.g. change in packet size) and the product identifier has changed; and (3) where there has been a quantity change and the product identifier has not changed. The first scenario is the simplest case and requires calculating a previous period price for the new item. In the second and third scenario, a quality adjustment factor is calculated to account for the quantity change. The NSO will need to develop a method to link new and disappearing products.
Scanner data sets are voluminous and can vary significantly in meta-data structure and formats from one retail business to the next. This can result in a significant amount of NSO resources being required to transform these raw datasets into a comprehensive database suitable for the analysis and creation of CPIs [2, 3]. Scanner data acquisition, storing, cleaning and coding are also resource intensive challenges that need to be considered by the NSO.
Using scanner data sets to update pricing samples
The collection of point-in-time prices by NSO field price collectors visiting retail businesses is resource intensive. A census of items cannot practically be priced each period resulting in the need for some sort of sampling approach. NSO field staff then aim to select a representative basket of items for pricing. This is a purposive sampling approach.
Purposive sampling can be replaced by more scientific sampling methods due to the availability of scanner data. Since scanner data typically is a census of products, scanner data sets can be used as a sampling frame for updating pricing samples. A pricing sample is usually two-dimensional; it is a combination of a sample of outlets and a sample of items/product varieties. If all the stores from a retail chain are covered, the scanner data set can be used as sampling frame for both the outlet and item dimension.
Revenue shares for each product (or product/outlet combination) can be used to determine the significance of each product within a product group. Products are then selected for inclusion in the CPI ‘basket’ based on revenue share either through sampling proportional to revenue or cut-off sampling [16].
Over time, however, products in the sample can lose relevance or even cease to exist. In these cases, a replacement product is needed to maintain the relevance of the sample. Relevance tests can be used to highlight items in the samples that have become unsuitable and also highlight and rank suitable items as replacements.
The main principle behind these relevance tests is that the products should have a stable revenue share (i.e. consistent revenue share compared to other products) within the CPI product group. These product groups are referred to as the Elementary Aggregate or ‘EA’ in the price index literature; see e.g. Chapter 20 in [14].
To mitigate these problems, possible replacement products’ revenue must have been stable and significant for a specified period of time (e.g. three to six months) before they can be considered for inclusion into the price samples.
Using scanner data to update index structures and to apply weights
Pricing samples have traditionally been small. When the additional CPI analyst resources are indeed offset by the reduced field collection resources, the NSO could decide to expand the pricing samples without changing the price index formula at the EA level or the sampling procedure.
It may be worthwhile, however, to reconsider the index structure and the sampling procedure, in particular when the NSO obtains scanner data directly from retail chains. Traditionally, an EA index is compiled from prices collected at outlets that belong to different retail chains (or independent stores). When the NSO wants to use much more price information from a retail chain than before, it seems preferable to treat EA-chain combinations as separate strata in the index compilation process.
In particular when the NSO decides to use the classification system provided by the retailer, it will be necessary to change the index structure: the lowest level in that classification should now be treated as a separate (chain-specific) EA. This raises several challenges. The first challenge is whether the stores belonging to the chain should be viewed as separate outlets, as is the traditional situation. In that case, unit values for the sampled items should be calculated at the store level. On the other hand, when the items are deemed homogeneous across stores, it may be useful to calculate unit values across all the stores belonging to the chain [17]. Some NSOs do not have a choice, however, as they receive scanner data at the chain level.
The next challenge is to what extent existing sampling procedures should change. Suppose the NSO formerly used sampling of items proportional to revenue from the scanner data. This procedure can also be used to sample items from chain-specific EAs, where items are either defined (and unit values calculated) at the store level or the chain level. If the NSO wants to significantly increase the sample sizes in order to make use of a substantial part of the price information contained in the scanner data set, sampling procedures need to be reconsidered.
Another challenge is how to integrate the chain-specific EA price indexes from scanner data with price information from other sources. Because these ‘EAs’ are different from the EAs in the traditional index structure, the scanner data price indexes have to be aggregated up to a level – perhaps the lowest level of product aggregation the NSO publishes price indexes – where they can be combined with price indexes from other sources. In other words, two aggregation steps are required: aggregation of the chain-specific EA price indexes up to some higher-level product category, and aggregation of the resulting scanner data indexes with price indexes at that level pertaining to other retail chains and independent stores.
The revenue data provides the opportunity for NSOs to weight price indexes more frequently using more timely data. It is suggested that the weights to combine the price indexes from scanner data be updated annually, using product revenue data from the previous 12 months. Combining the scanner data indexes with the price indexes compiled from other sources requires expenditure data for the latter indexes, which may be difficult to come by or estimate.
Scanner data sets contain revenue data at the most detailed level. These data can be used to sample items proportional to their revenue, as mentioned above, but that raises a few issues. The inclusion probabilities serve as implicit weights. That is, the EA price index will actually be an implicitly weighted index, and the inclusion probabilities should correspond with the target/population index aimed at [18]. The revenue distribution within a product category as observed in scanner data is often highly skewed. Sampling proportional to revenue therefore likely selects some high-revenue items with a probability of 1. Now suppose the NSO tries to estimate a weighted geometric target index using the (unweighted) sample-based Jevons index. All the items that are selected with certainty will receive equal weights, which is not a good solution as they may have substantially different revenues.
It seems preferable to reflect the items’ economic importance explicitly via a weighted index number formula rather than implicitly via the inclusion probabilities in an unweighted index. Weighted methods for scanner data will be discussed in Section 2.4.6 and in greater detail in Section 3.
Using scanner data sets to implement new CPI compilation methods
The approaches outlined in Sections 2.4.2 and 2.4.5 enable the NSO to continue using sample-based methods to compile their CPI. Improvements to the accuracy of the CPI will be achieved because the prices (i.e. unit values) are more representative of those actually paid by consumers; the products sampled reflect volume sellers; and the weights used to produce aggregate measures of price change are based on more timely information and can be updated more frequently.
Ideally, a NSO would use all the available information in scanner data sets rather than taking samples. Manually processing a census of products from scanner data sets is prohibitively expensive, however, and cannot be undertaken to meet the CPI production timeframes. That is, automating CPI compilation processes is required.
Also, when using a census of products, a weighted index number formula should be used. Again, product turnover poses a significant problem. To maximize the number of matches in the data, chaining at high frequency will be needed. This, however, can lead to significant drift in the index. Multilateral price index methods, which are drift-free by construction, are most suitable to handle a census of products from scanner data.
Multilateral price index methods
Introduction
Scanner data can be implemented in the CPI using traditional sample-based methods: the prices formerly observed by price collectors visiting the stores can simply be replaced by unit values from scanner data without changing the sampling design and the price index number formula used. If the statistical agency decides to use all the available data rather than taking samples, which seems an obvious approach, multilateral price index number methods are most suitable. Multilateral methods were originally developed to compare price levels across countries, but they can be easily adapted to price comparisons over time. These methods are particularly useful for scanner data, where item turnover is often large and promotional sales occur frequently.
This section briefly describes the most important multilateral price index number methods. For convenience, a short overview of traditional bilateral price indexes and chaining is provided.
Bilateral price indexes and chaining
Suppose first that the set of items sold is fixed over time, i.e. that we are dealing with a static universe. This fixed set of items is denoted by
In the situation with no expenditure information, [14] recommends the use of the Jevons price index, the unweighted geometric mean of price relatives:
The statistical agency traditionally draws a sample of items from the entire universe
Since scanner data contains expenditure information for a census of items, the construction of superlative price indexes is possible on the entire set
where
In a dynamic universe there are new and disappearing items so that not all items can be matched over time. The sets of items in periods
where
However, empirical work showed that high- frequency chaining of superlative price indexes can lead to strong chain drift, which in scanner data is often due to promotional sales. Chain drift in superlative price indexes due to sales is typically downward. Using ACNielsen scanner data on goods sold in Australian supermarkets, [19] found downward drift in chained Fisher price indexes; see also [20, 21]. Drift in chained matched-model superlative price indexes has been documented for durable goods as well. Here, the drift is likely due to seasonal fluctuations in prices and quantities. Using scanner data from GfK, [22] found downward drift in chained Törnqvist price indexes for consumer electronics goods sold in New Zealand. Evidence of downward bias in chained Fisher indexes using UK GfK scanner data on televisions was presented in [23].
A simple solution to the chain-drift problem would be not to weight the items and construct a time series by chaining period-on-period matched-model Jevons price indexes:
where
Transitivity is desirable for price comparisons across countries because it means that the results will be independent of the choice of base country. Adapted to comparisons over time, the use of multilateral price index methods as the results will then be independent of the choice of base period and therefore free from chain drift. Multilateral methods have in common that price indexes are constructed simultaneously for the entire sample period.
Two types of multilateral method can be distinguished. The first type starts from matched-model price comparisons between any pair of time periods across the entire sample period and then ‘transitivizes’ this set of bilateral price indexes. The best-known method is GEKS [26, 27, 28]. The second type attains transitivity in another way, which will be explained below, and includes the Geary-Khamis method [29, 30] and the Country Product Dummy method [31].
GEKS method
The GEKS index between period 0 and period
The time reversal test requires that when the base period and the comparison period are reversed, the result should be equal to the reciprocal of the original index. In its standard form, the GEKS method uses bilateral Fisher indexes, which satisfy the test, but other choices are possible, including bilateral Törnqvist indexes. The GEKS-Törnqvist method is also known as CCDI [33, 34].
The choice of length for the sample period or window remains a point of concern. In [21], a 13-month (or 5-quarter) window was advocated as this is the shortest window that can deal with strongly seasonal goods. Enlarging the window would lead to a loss of characteristicity in that recent price movements would be increasingly affected by prices and price changes in the distant past.
It is possible to construct weighted GEKS indexes which may take into account the reliability of the bilateral price indexes [35]. A weighted GEKS method where the weights depend on the degree of matching of the items, for example in terms of their expenditure shares, was proposed in [36]. Here, the choice of window length is less important since bilateral indexes with a lower degree of matching will be down-weighted.
The Geary-Khamis (GK) method, when applied to comparisons over time, gives rise to the following price index:
The numerator of Eq. (6) is a price index (using period
The reference prices are given by
where
Since the GK index acts as the deflator in Eq. (7), Eqs (6) and (7) define a system of equations which must be solved simultaneously. This can be done iteratively, but there are other ways to solve the system [37].
This is a regression-based approach. Assuming
where
Diewert [38] proposed to estimate model Eq. (8) by Weighted Least Squares regression with the items’ expenditure shares in each period serving as weights. Exponentiating the estimated time parameter
Equation (10) shows that the exponentiated item fixed effect estimates
Notice that the TPD index Eq. (9) can be viewed as a normalized geometric Paasche index with imputed period 0 prices based on the reference prices Eq. (10). Similarly, the GK index Eq. (6) can be viewed as a normalized (ordinary) Paasche index with imputed period 0 prices based on the reference prices Eq. (7).
Implicit quality adjustment
Like GEKS, GK and TPD are matched-model methods in the sense that items with a single observation in the entire sample period do not affect the index. This is easy to understand: items contribute to aggregate price change only when price relatives can be calculated from the prices observed in both periods compared, unless information on characteristics would be available to perform explicit quality adjustments; see Section 3.4.3. One implication of the matched-model property is that items introduced in the most recent period
In Eqs (6) and (9) for the GK index and TPD index, respectively, the base period prices for all the items sold in period
Implicit quality adjustment can also be illustrated by using an alternate interpretation of the GK index. Dividing the value index of the product category by the ratio of ‘quality-adjusted quantities’ defines a quality-adjusted unit value index [42, 43]:
Notice that if
A comparison of Eqs (6) and (11) shows that the GK index can be viewed as a quality-adjusted unit value index where the quality-adjustment factors are measured by the reference prices Eq. (7). Similarly, the TPD index Eq. (9) can be viewed as its geometric counterpart where the quality-adjustment factors are measured by the reference prices Eq. (10). Whether the reference prices in the GK and TPD indexes properly reflect quality differences is likely to depend on the market circumstances [23].
Data on item characteristics permitting, explicit quality adjustment is preferable, in particular using hedonic regression.
A useful starting point is the multilateral Time Dummy Hedonic (TDH) model
where
The resulting weighted TDH index,
The GEKS method does not aim at implicitly adjusting for quality change. It is possible to estimate explicitly quality-adjusted GEKS indexes by replacing the bilateral matched-model Törnqvist price indexes by bilateral hedonic imputation Törnqvist indexes, as proposed in [22].
When new data becomes available, previously estimated multilateral indexes change. This is problematic because the CPI is not revisable. Two types of method have been proposed to extend a multilateral time series without revising published index numbers: rolling window methods and an annually-chained direct method.
Rolling window methods estimate multilateral indexes on a window with fixed length, which is shifted forwards each period. The results of the latest window are then spliced onto the existing time series, for example by splicing the most recent movement onto the latest index number. An alternative to this movement splice is a window splice, which splices the most recently estimated movement across the entire window onto the index level of
These two extension methods splice price movements onto a single link period. Since all link periods are equally valid, [40] proposed using a mean splice by taking the geometric mean of the price indexes obtained from using every possible link period. This makes the result independent on the choice of link period.
The annually chained direct extension method [10] constructs multilateral index series of, say, 13 months, starting in e.g. December and ending in December of the next year, and chain links them in December of each year to obtain a long-term time series. The length of the estimation window for the short-term indexes is extended each month – the index for January in the short-term series is estimated on two months of data (which is a bilateral rather than multilateral comparison), and so forth, until in December thirteen months of data is used.
A potential weakness of the direct extension method is that the price indexes for the first couple of months of each year are based on sparse data and expected to be volatile. Also, December acts as the short-term index reference period and is given special importance. If, for some reason, December is an ‘unusual’ month, the results may be adversely affected. To mitigate these problems, [46] suggested combining the annually chained direct extension method with a rolling window approach.
As observed in [8], the formula for extending the time series between periods
where
For Rolling window methods use previous and current windows spanning from
Similarly, the mean splice extension between periods
Assessing multilateral methods
The implementation of new data sources and methods in any statistical series requires careful consideration of the statistical impacts, as well as the benefits and costs. Only a handful of NSOs have currently implemented multilateral price indexes in the CPI, displaying caution in implementation and a divergence in methods and practices.
In [47], criteria were proposed to assess multilateral methods considering a broad concept of statistical quality. The framework distinguishes seven dimensions of statistical quality. This framework can be used to determine the benefits and challenges of using multilateral index methods in the local context.
Multilateral methods can also be assessed from a theoretical perspective. A theoretical assessment of multilateral index methods in the present temporal context can utilize approaches previously applied to spatial price indexes; see [37, 40] for the latter applications. In [41] the economic approach to index number theory was used to assess multilateral index methods in the temporal context and concluded that GEKS (-Törnqvist) is ‘best’. Restrictive assumptions about consumers’ preferences are required to defend GK and TPD. The GK method is additive, and the TPD method can be called approximately additive, but economic theory does in general not support additivity. A detailed theoretical assessment of multilateral (temporal) price index methods from the economic as well as the axiomatic or test approach to index number theory is provided in [48].
While GEKS seems to be preferable from a theoretical perspective, there are also practical issues to consider as well as the context in which the NSO operates. Furthermore, at very low levels of product aggregation, i.e. for broadly comparable items, an (approximately) additive method may still provide reasonable results. Empirical research typically found rather small differences between GK, TPD and GEKS indexes.
Calculating indexes
The matched-model property of (non-hedonic) multilateral indexes implies that without any manual intervention, the results depend on the choice of item identifier. For example, when using barcode as item identifier, the price change of a homogenous product whose barcode changes at the same time – a ‘relaunch’ – will not be measured. As mentioned earlier, the use of Stock Keeping Unit (SKU) mitigates the problem since SKU generally consists of multiple barcodes for similar items and is more stable than barcode. Nevertheless, even SKU may be too detailed.
If a relatively small number of observable attributes with discrete values suffice to define homogeneous products, items could be defined by cross-classifying the sets of categorical variables for each attribute and prices calculated as unit values across all the barcodes/SKUs. Most likely there will still be new and disappearing items (cells) across the sample period. To maximize the degree of matching without introducing chain drift, a multilateral method could be applied [10]. A potential issue is that the available characteristics information may be limited, especially when the characteristics are extracted from product descriptions in scanner data, which are often rather broad. In this case, unit value bias is likely to arise. Also, if the characteristics information is deemed sufficient, it may be better to construct hedonic price indexes.
It is important to produce preliminary empirical results. The purpose is twofold: examining the performance of various methods in local contexts as well as demonstrating to users the likely impacts of moving from current CPI data sources and methods to new approaches. Ideally these multilateral methods should be examined against each other and in comparison to the official CPI. These comparisons should be undertaken at the lowest aggregation level of the published CPI as well as at various higher levels, including the Total CPI.
Communicating with users and stakeholders
The use of scanner data to compile the CPI can represent quite a significant change to the data sources and methods employed by NSOs for many years. These changes need to be carefully communicated to CPI users and stakeholders.
The NSO should publish a position paper that both responds to the topics raised as part of the consultation process; and clearly articulates how the NSO will proceed with the use of scanner data to compile the CPI, including the rationale and empirical results that support this approach.
Following the publication of the position paper, it is suggested the NSO compile in parallel the CPI using the current and new data sources and methods for a period of approximately six months. This transition period allows the NSO to refine processes and procedures to compile the CPI using the new methods, as well as to confront the empirical results of the two approaches. This transition period is often the first opportunity for the NSO to utilize the new data sources and methods in real time.
The Australian experience using multilateral methods
The multilateral method employed in Australia
The ABS method for compiling the CPI using scanner data is the GEKS-Törnqvist method; see Section 3.3.1. While the different multilateral methods produce similar results, the two main criteria that differentiate the GEKS-Törnqvist from the other multilateral methods are its theoretical properties, as discussed in Section 4.1, and its interpretability: it is constructed from bilateral indexes which are familiar to key users and analysts. The ABS has employed processes to remedy the sensitivity of the GEKS-Törnqvist to products with atypical prices and small quantities, mostly clearance prices. These processes detect and exclude these products from index compilation. The exclusion of products at clearance prices is consistent with current practices adopted in the CPI.
The GEKS-Törnqvist method is used to compile approximately 17 percent of the weight in the Total CPI. The Appendix lists the 28 expenditure classes covered by the scanner data; see also [8].
There are a few additional expenditure classes, such as Garments for Women and Garments for Men, where the scanner data available to the ABS represent a relatively small proportion of household expenditure. Prices are sampled from the scanner data for these classes and incorporated into existing Elementary Aggregates using the approaches described in Sections 2.4.3 and 2.4.4.
The extension method employed in Australia
The decision to implement a multilateral method requires an NSO to specify the number of time periods used for price comparisons. Most research using rolling window approaches has recommended a minimum of one year and one period (i.e. five quarters, 13 months) to account for products seasonal availability, though there is currently no consensus on the optimal length of the multilateral window.
The choice of multilateral window length is a trade-off between two criteria: characteristicity and transitivity. If the multilateral window is too long then the index could suffer from a loss of characteristicity where price change in the past may disproportionally impact recent inflation estimates. If the multilateral window is too short, the index may suffer from the ’chain drift’ problem. Empirical testing of different window sizes is necessary to assist with this decision.
Results presented by the ABS [47] used a window size of two years and one period (i.e. nine quarters, 25 months) as the preferred window length. This was based on empirically testing various estimation windows compared to each other (as well as their proximity to different full price series). Empirical testing showed that varying the length of the estimation window generally made little difference to the price series generated. When the series did diverge the use of a shorter window (i.e. one year and one period) tended to display more downward (upward) drift if the series showed a decreasing (increasing) price trend. Therefore the ABS has implemented a window size of two years and one period for the length of the multilateral window.
Implementing a multilateral method in the CPI also requires a strategy for extending the index to the current period without revising previously published values, as described in Section 3.5. The ABS has chosen to use the mean splice method proposed by [40]. This choice was based on the attractive conceptual properties of this method, as touched on in Section 3.5, as well as empirical comparisons with other extension methods. In particular, the ABS found evidence that the movement and window splice methods were more susceptible to drift when products appear and disappear at atypical prices, and the direct method produced volatile results early in the year. More information on this decision is presented in [8].
Implementation challenges and solutions
From December quarter 2017, the ABS implemented multilateral methods into the compilation of the Australian CPI. Based on empirical evidence and theoretical reasons, the GEKS-Törnqvist method was chosen [8].
The methods and processes the ABS uses to address a number of practical issues when implementing multilateral methods are also presented. They include: (1) Monitoring systems of multilateral inputs and outputs; (2) Detecting and treatment of abnormal observations; and (3) Item churn and quality adjustment.
Monitoring systems of inputs and outputs
To manage the quality of the Australian CPI over the implementation of multilateral index methods, the ABS has set up systems to monitor the inputs and outputs and identify the most influential anomalies for further investigation or resolution. This is particularly important because a large number of price observations are used and multilateral indexes are relatively complicated. The ABS systems mirror those used by other NSOs who process scanner data.
As a starting point, the ABS conducts global checks (see Section 2.3.3) to confirm that scanner datasets received for the current period are broadly consistent with historical data. This includes plotting time series of aggregate expenditures, quantities and items sold.
After the compilation of multilateral indexes, the ABS decomposes each index movement into contributions from individual items. This decomposition is used to rank items in order of their contribution to the index movement, and to identify the combined contributions of groups of items. The price and expenditure history of the most influential items are then examined by analysts. This helps analysts to understand and explain the story behind the index movement, and sometimes helps to identify abnormal price observations that were not removed by the pre-compilation filters described below.
Impact of clearance filter on Snacks and Confectionery index, December 2013 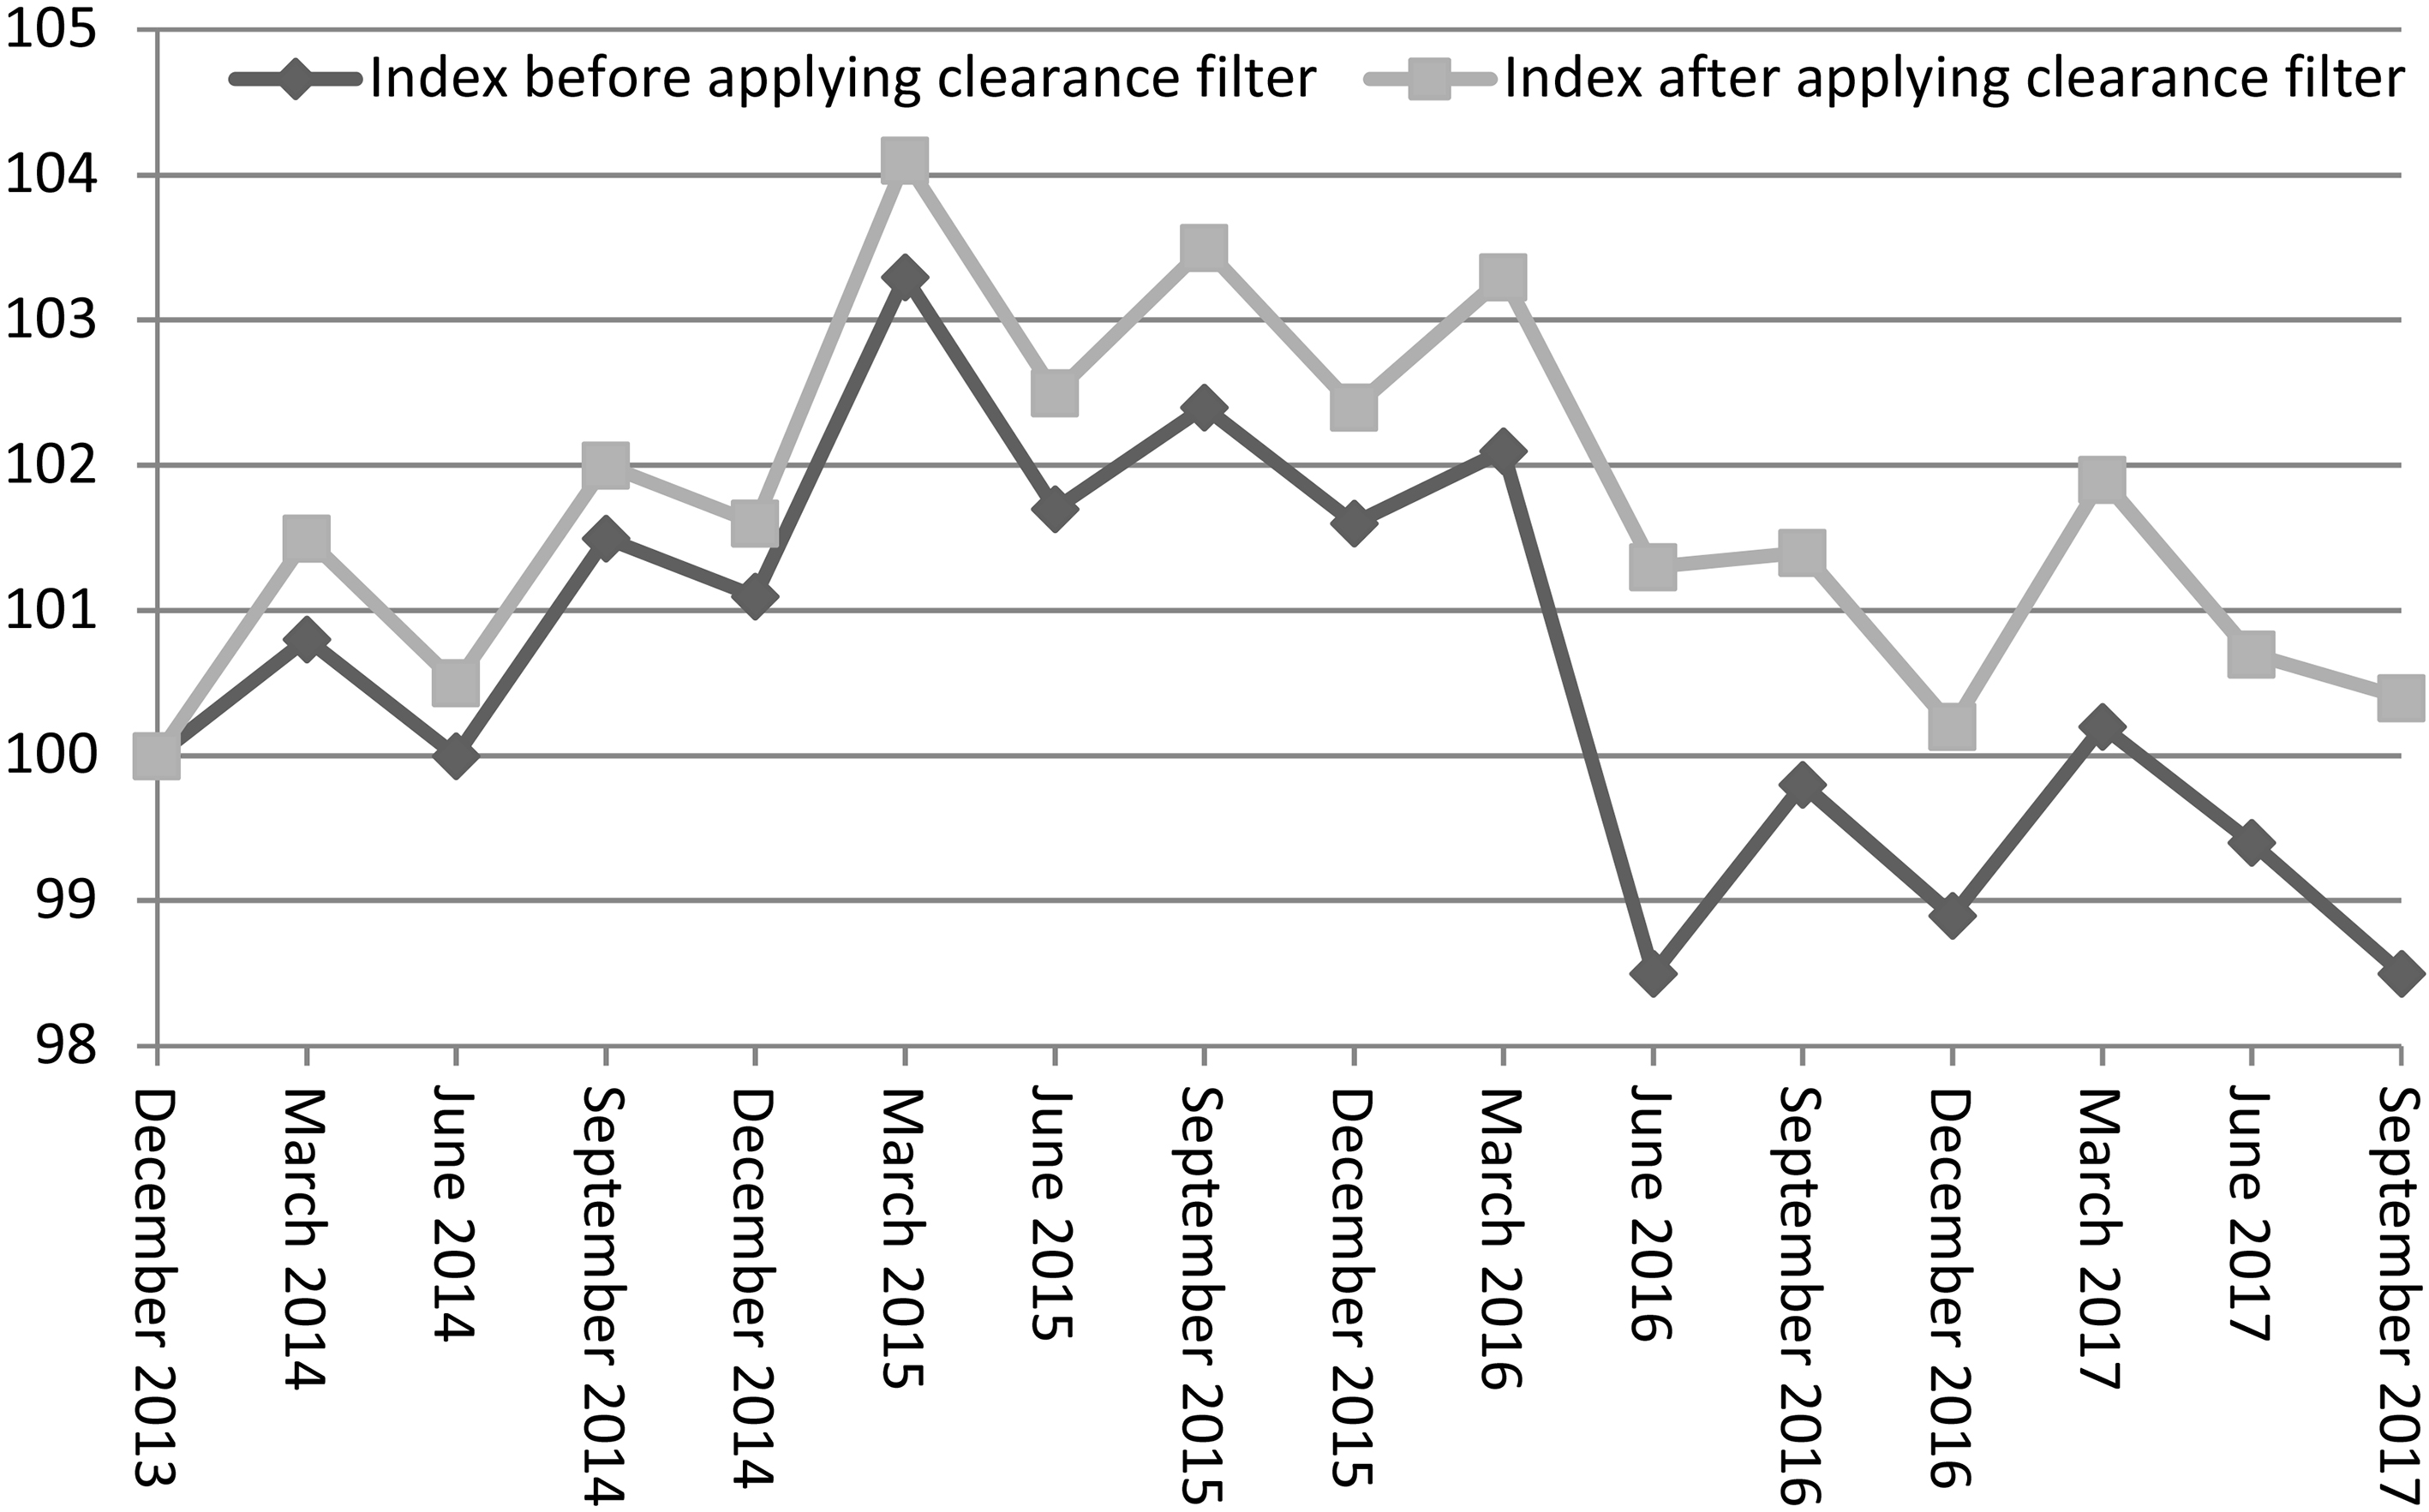
Before compiling indexes, the ABS filters out prices that seem implausible or may cause problems for compilation. Items are filtered out when their prices increase or decrease by more than a factor of 4 between consecutive periods, following an approach described by Statistics Netherlands [32]. The few price changes that are removed by this filter are more likely to reflect a change in quality of the item than a pure price change.
Another filter aims to remove price decreases associated with clearance prices. While ideally the CPI would capture the price decreases associated with these discounts, the effective price increases when these discounted products disappear are not captured by implicit quality adjustment methods (see Section 3.4.1), which can result in downward bias. A feature that helps to distinguish clearance sales from other discounts is a simultaneous decrease in both price and quantity (units sold): in normal circumstances, discounts would have a non-negative impact on consumer demand, but usually clearance discounts are offered only when a small volume of stock remains. The ABS uses a modified version of a filter proposed by Statistics Norway [49] to filter out items that have simultaneous decreases in price and quantity of more than 30% from one period to the next. This filter is not used in the Fruit expenditure class, where products disappear and reappear seasonally but clearance sales are uncommon. Figure 1 shows the impact of this filter on the price index for the Snacks and Confectionary Expenditure Class.
Item churn and quality adjustment
As described in Section 2.4.3, item churn poses challenges for quality adjustment. The GEKS- Törnqvist is a matched-model method that uses implicit quality adjustment, which means that any price changes associated with new and disappearing items may be missed. As such, the ABS monitors match rates for each product class: the proportion of items that the current period and previous periods have in common and the proportion of total expenditure that those items make up. Match rates are typically less than 100% due to the gradual appearance and disappearance of items from sale over time. However, sharp decreases in the weighted match rate are of concern, as these may reflect the appearance or disappearance of items with high expenditure shares. Moreover, persistently low match rates may suggest that the item identifier is too detailed.
The ABS uses SKU as an item identifier. Item prices are computed as quarterly unit values for each SKU over each chain of outlets. The ABS mitigates the challenge of item churn through linking new and disappearing items to comparable items where possible, using item descriptions provided by scanner data providers. Where a new or disappearing item has a sufficiently similar description to another item sold in the previous or subsequent period respectively, an automated process is used to link these items and adjust for changes in quality (e.g. package size) that are apparent from the descriptions. Where sharp decreases in the match rate are still apparent after this automated linking process, an analyst will examine the top few new and disappearing products by expenditure with a view to making such links manually. This linking process is designed to address the relaunch problem described in Section 2.4.3.
Aggregation structure incorporating multilateral methods used in the Australian CPI.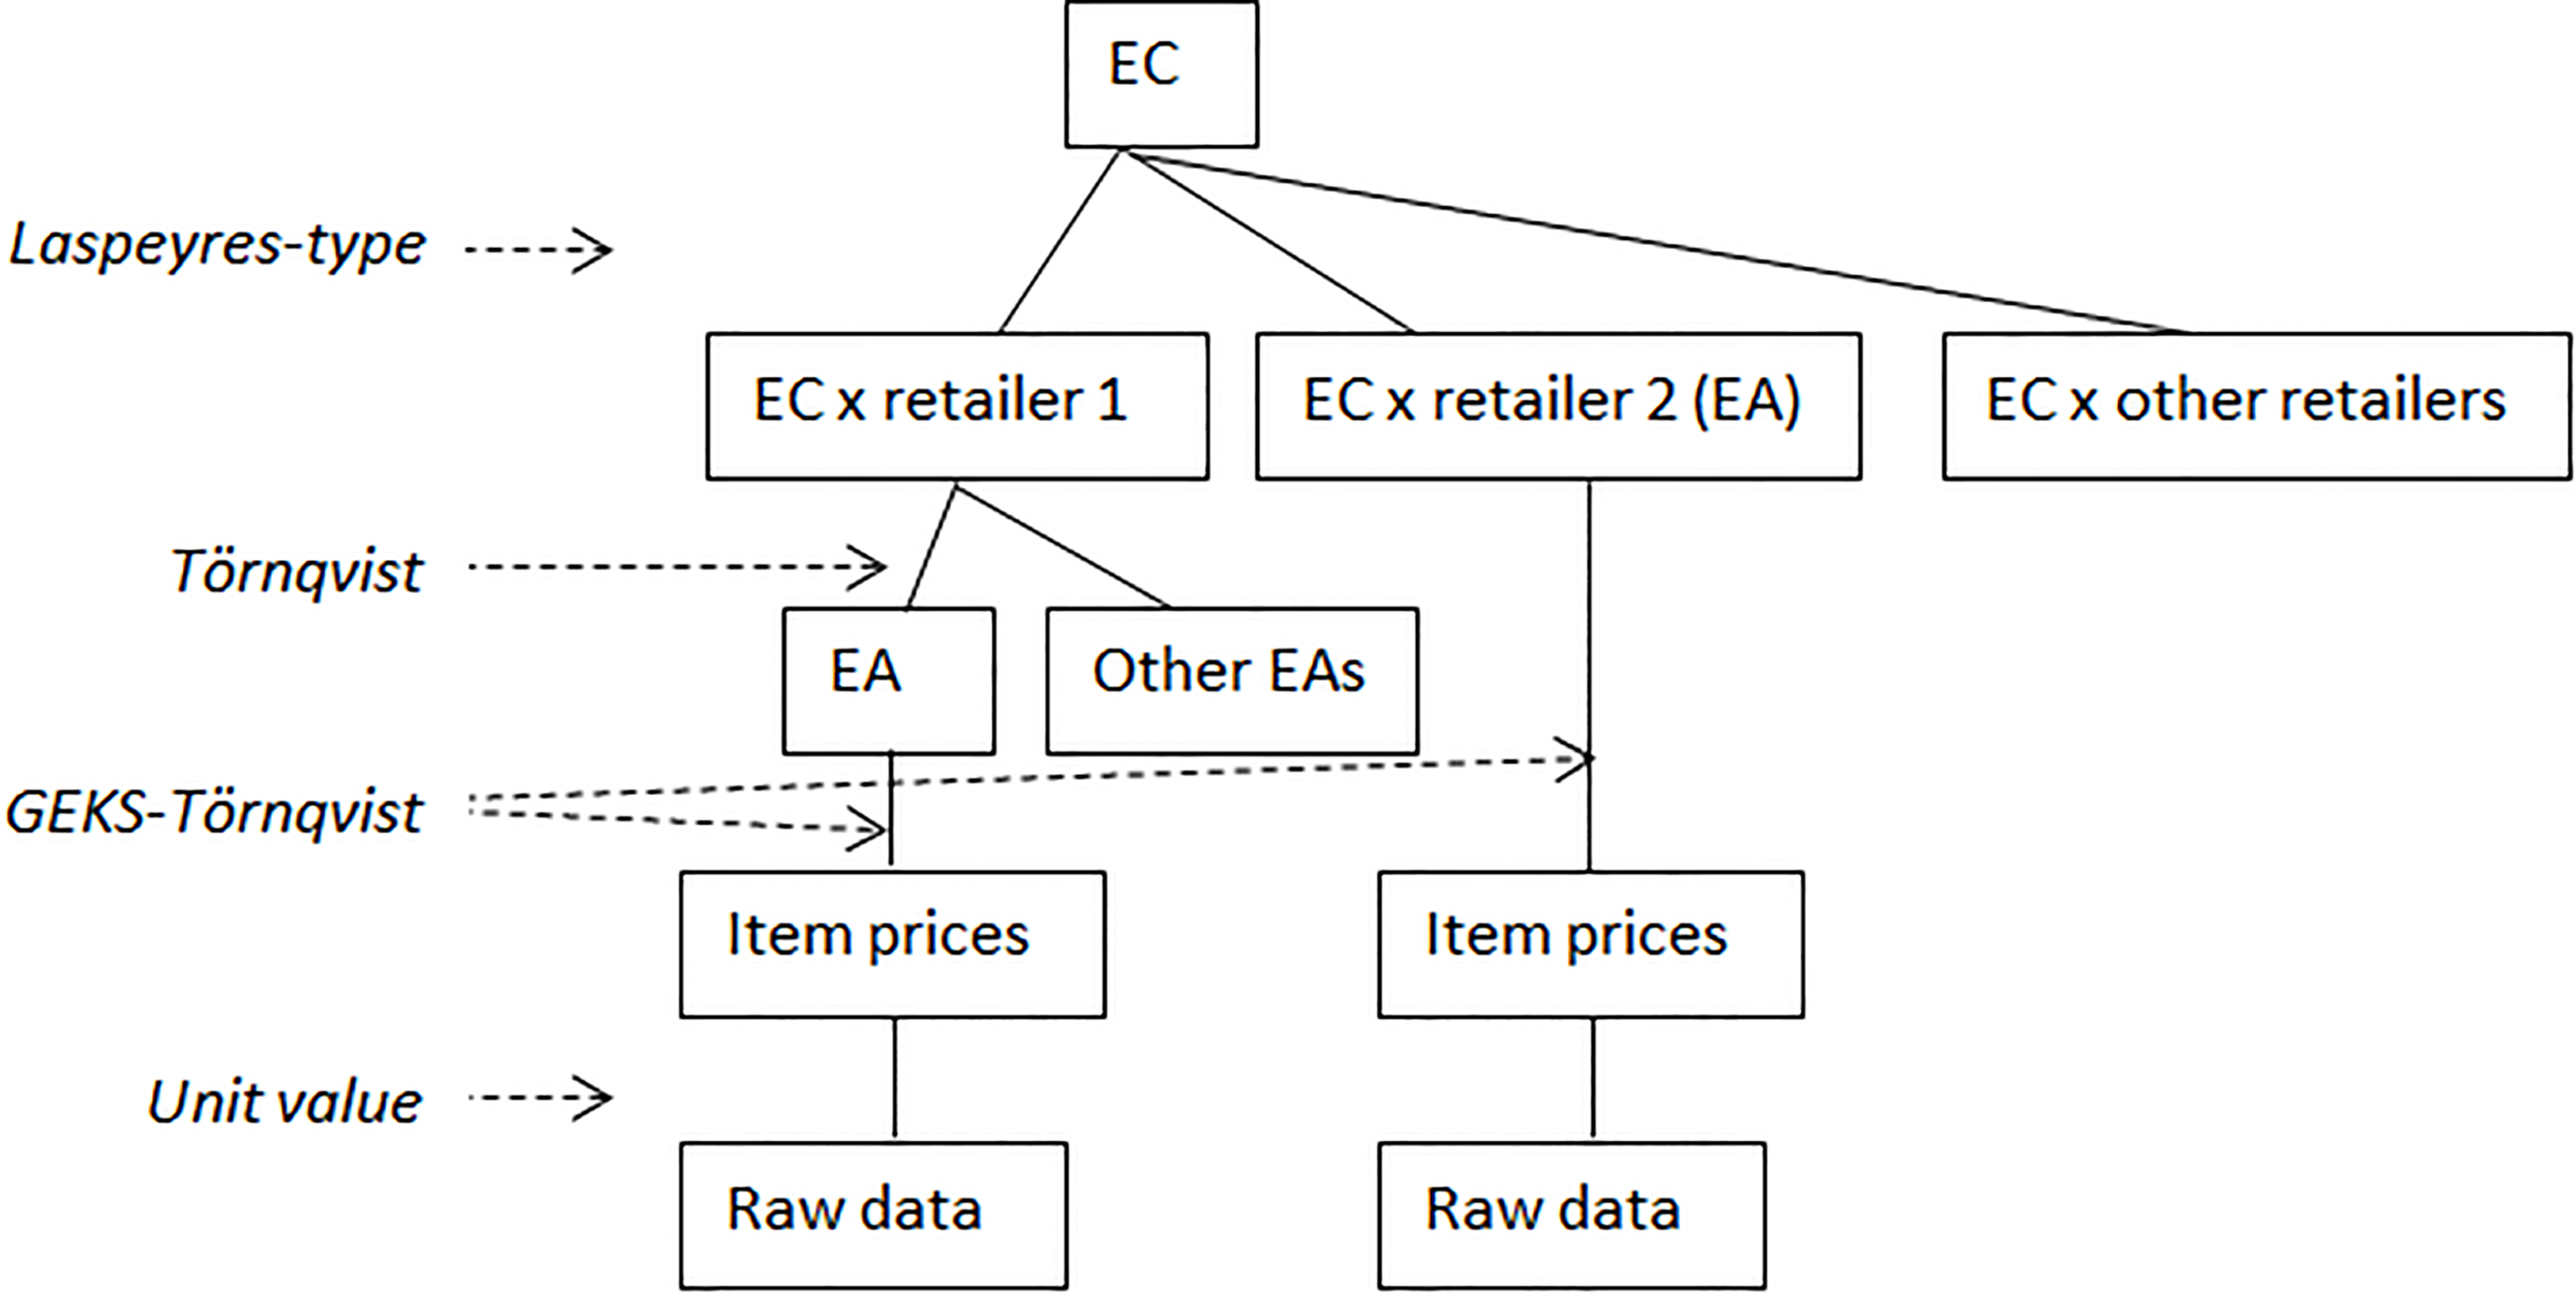
Multilateral methods are used in the Australian CPI for a subset of product classes where scanner data is available. The items on each dataset are classified to the Expenditure Class (EC) level, which is the most detailed level at which the CPI is published. Where possible, the ABS uses classifications supplied by data providers to further partition each provider’s data into more homogeneous Elementary Aggregates (EAs); otherwise the EC level itself is used as the EA.
Multilateral methods are used to aggregate from the item level to the EA level. Where EAs are defined below the EC level, the Törnqvist index is then used to aggregate EA price movements to the EC level. This aggregation is performed separately for each provider, using aggregate expenditures from their scanner data for weighting. The use of the superlative Törnqvist index captures any substitution between product classes that occurs below the level at which the CPI is published. However, if a country wished to capture substitution within but not between EAs, it could instead use Lowe or Young indexes to aggregate from the EA to the published level.
Price movements are aggregated across transaction data providers at the EC level using a Laspeyres-type index. The weights assigned to each provider are updated annually in the December quarter, using expenditures from the ending in the previous (September) quarter. As described in Section 2.4.5, where reliable estimates of the price changes of other retailers are available from other sources (e.g. through personal or online price collection), these can also be incorporated at the same time after aggregation to the EC level.
Figure 2 illustrates the aggregation structure incorporating multilateral methods used in the Australian CPI, up to the EC level.
Empirical results
Empirical results at the published level are presented below for a selection of indexes which combine the price movements of both scanner and non-scanner data respondents. The figures plot both the published CPI and the CPI with the GEKS-Törnqvist index to measure the statistical impact of the methodological changes. The time series produced covers the period March quarter 2014 to December quarter 2017 for the weighted average of Australia’s eight capital cities. Note that the GEKS-Törnqvist index was incorporated into the published CPI in the December quarter 2017, so both indexes have identical price movements between September and December 2017.
Figure 3 presents results for the All Groups index, the Total CPI for Australia. At this level, the CPI with the GEKS-Törnqvist index is generally close to the published CPI over the last four years, though it ends up slightly lower. The difference between the official Total CPI and the CPI with the GEKS-Törnqvist index for the product classes covered by the scanner data is approximately equal to the difference shown in Fig. 2 divided by 17 percent. This consistency with the GEKS-Törnqvist (which incorporates a greater volume of pricing information) reflects well on the quality of the historical series. It also suggests that the implementation of multilateral methods for compiling scanner data should not have a substantial statistical impact on the Australian (Total) CPI.
All Groups index, December 2013 
Non Alcoholic Beverages Subgroup index, December 2013 
Fruit Expenditure Class index, December 2013 
Tobacco Subgroup index, December 2013 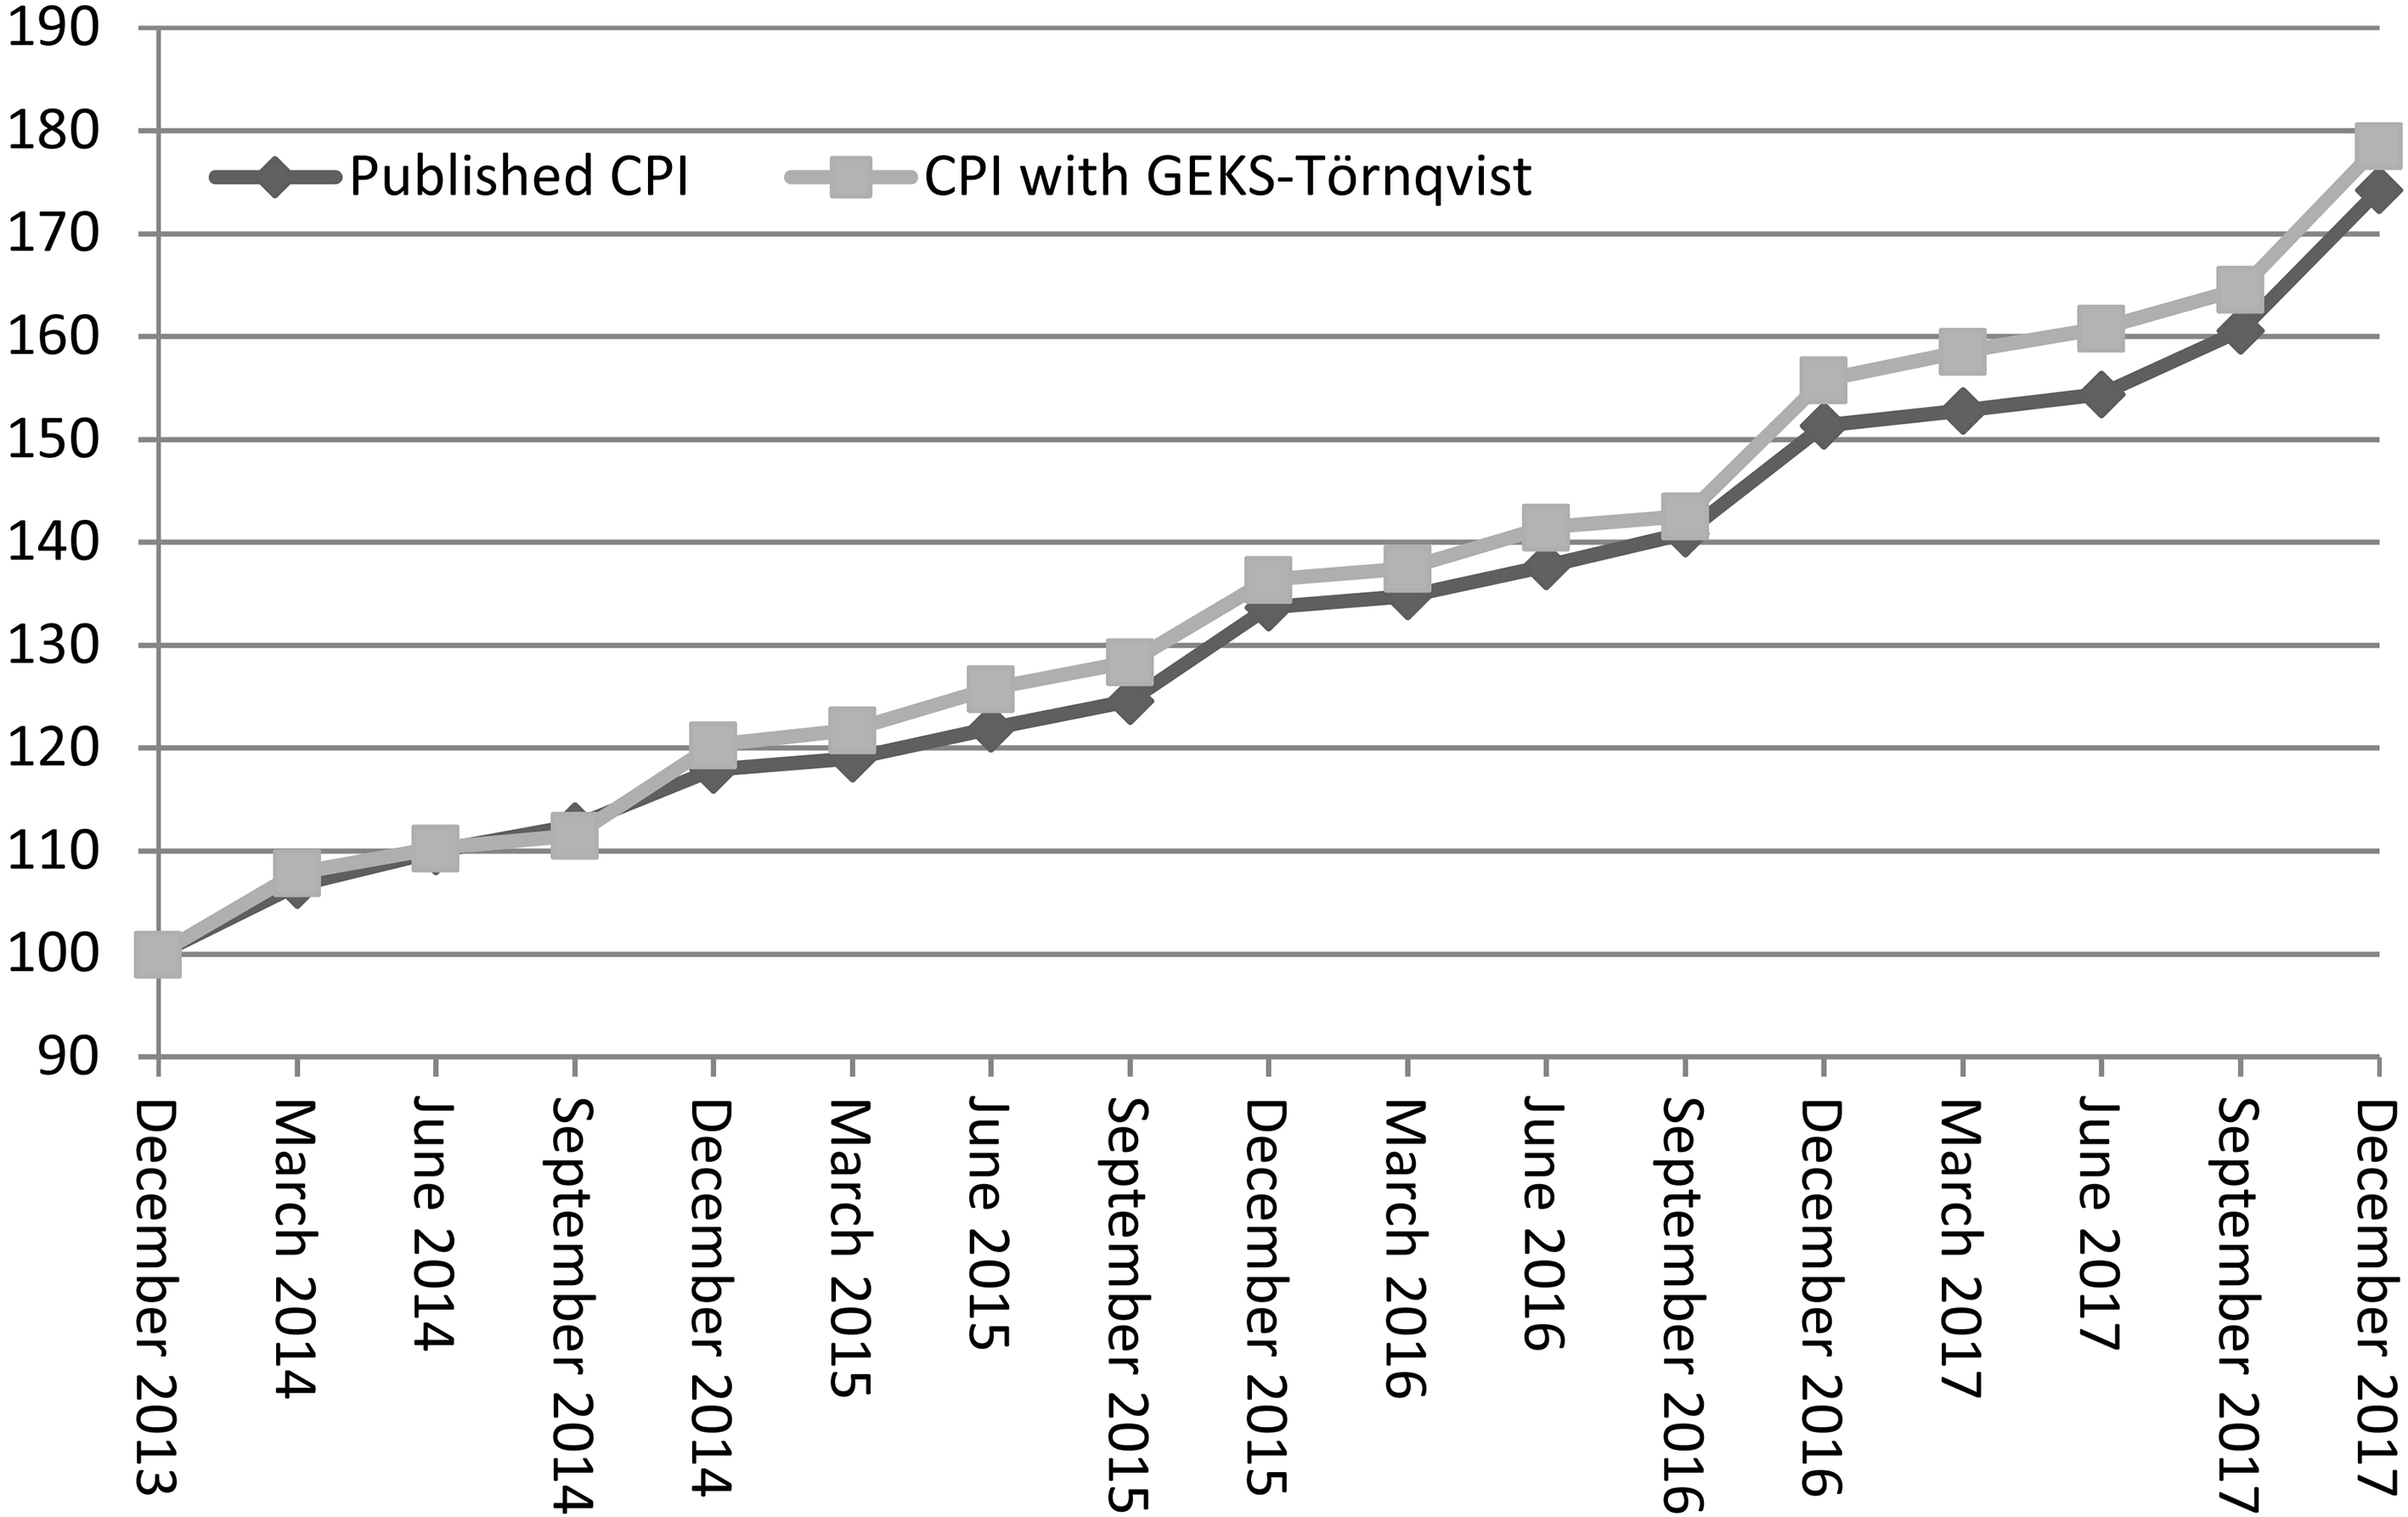
The index comparisons presented in Fig. 4 for the Non Alcoholic Beverages Subgroup are typical of the relationships observed at finer levels. Once again, the indexes evolve in a broadly similar manner, though there are more substantial differences in this example. These reflect differences in the samples and weights used to compile the two indexes. For instance, price changes relating to temporary discounts (both decreases and increases) will only be reflected in the published CPI if the discounted items were included in the sample at the time, whereas all items from transaction data providers are included in the GEKS-Törnqvist. Moreover, the GEKS-Törnqvist can reflect consumer substitution between items as prices and preferences change, whereas the published CPI uses fixed weights for each item. On the other hand, the similarity between the indexes suggests that the impact of substitution between close varieties on longer term price comparisons is small, and that the smaller sample used in the published CPI still captures the most dramatic price changes (around December 2015 and 2016, in this example).
Figure 5 presents comparisons for the Fruit Expenditure Class. Over the last four years, the published CPI has shown higher inflation in the September quarter but the indexes return to similar values a few quarters later. Decomposition analysis suggests that this difference is due to weighting. In September quarters, the scanner data suggests there tends to be substitution away from fruit varieties with seasonal price increases. The GEKS-Törnqvist approach used in the Australian CPI, which uses dynamic weights up to the EC level, measures a smaller price increase than the published CPI, which uses fixed weights. However, the indexes return to similar levels a few quarters later, when those varieties (which now have greater weight in the published CPI) have price decreases. Overall, while the seasonal patterns differ in this Expenditure Class, the long term inflation trend shown by the indexes is comparable.
Other multilateral methods yield indexes similar to the GEKS-Törnqvist in this Expenditure Class when we allow for substitution up to the EC level (see [47], Figure 5.14). However, as noted in Section 5.4.3, multilateral methods could conceivably be used with fixed weights at the EA level, which would capture substitution within but not between varieties.
Figure 6 plots these indexes for the Tobacco Subgroup. Interestingly, the published CPI sits below the CPI with GEKS-Törnqvist in this product class, which has very rapid inflation due to regular increases in taxation of tobacco products. Decomposition analysis suggests that consumers respond by substituting towards products with relatively low prices per volume of tobacco. However, because excises increases are based on volumes – per stick or per kilogram – these products actually have relatively high inflation [8].
The empirical results reveal that the implementation of multilateral methods would not have had a substantial statistical Australian (Total) CPI over the last four years. Some differences are apparent at lower levels between the published CPI and a parallel index using the GEKS-Törnqvist method. These differences reflect how the dynamic weighting used to compile the GEKS-Törnqvist indexes can capture substitution between items. While intuition might suggest that accounting for substitution should yield a lower inflation rate, it appears to make more of a difference to short term than long term price comparisons, and it can have the opposite effect.
Conclusion
Scanner data is a rich source of information that offers NSOs opportunities to improve the accuracy of their consumer price indexes and to reduce costs. Challenges arise, however, in acquiring this data, in monitoring its quality and in preparing it for use in the production of official statistics. NSOs that are seeking to make use of this data can learn from the experiences of those that have faced these challenges.
NSOs can utilize scanner datasets in a range of ways that make progressively more use of the information they contain, from confrontation with existing samples of price quotations, to utilization as a source of price information, to expansion and improved maintenance of price samples; and from utilization in weighting product categories to weighting individual items in index compilation.
The implementation of multilateral indexes for scanner data represents a substantial change to the data sources and methods used in the CPI, and NSOs have taken a cautious approach to change given the high profile of CPI statistics The Australian experience provides a practical example of what it looks like to adopt a multilateral index method for scanner data. In addition to the choice of multilateral method, techniques for resolving practical issues and incorporating scanner data aggregates in CPI structures may be of interest to other NSOs. The empirical results suggest that implementing multilateral methods can have a small impact on the Total CPI (for Australia at least). At finer levels, there is evidence that the larger samples and dynamic weights used in compiling multilateral indexes can improve the measurement of price change.
Footnotes
Acknowledgments
The authors thank Michael Holt for helpful comments and for assistance with producing the empirical results. The views expressed in this paper are those of the authors and do not necessarily reflect the views of the Australian Bureau of Statistics and Statistics Netherlands.
Appendix
Expenditure classes covered by scanner data
The list below details the Expenditure Classes (ECs) which are currently covered by scanner data in the Australian CPI.
Beef and veal
Bread
Breakfast cereals
Cakes and biscuits
Cheese
Cleaning and maintenance products
Coffee, tea and cocoa
Eggs
Fish and other seafood
Food additives and condiments
Fruit
Ice cream and other dairy products
Jams, honey and spreads
Lamb and goat
Milk
Oils and fats
Other cereal products
Other food products n.e.c.
Other meats
Other non-durable household products
Personal care products
Pets and related products
Pork
Poultry
Snacks and confectionery
Tobacco
Vegetables
Waters, soft drinks and juices