
Abstract
This article proposes some analytical and methodological solutions to study the dynamics of retail business development, based on the results of business tendencies surveys. The following business conditions indicators were developed and tested: Retail Market Indicator (RMI) and Retail Business Potential Indicator (RBPI). The proposed indicators are aimed at quickly identifying current tendencies in the retail business, which, together with the quantitative parameters of the market, increase the scale of representation of the actual and expected phase of economic development of trade and the associated consumer market. The technique was tested to measure the business conditions of Russian organizations in the retail business, over the period 2005–2018. In this study, it was shown that RMI and RBPI are aggregated characteristics of business conditions that can warn about turning points of the business cycle. In addition, based on the decomposition of their dynamics, a tracer of cyclical profiles of indicators, which increases the visualization of industry tendencies, was built and the development of entrepreneurship at different stages of the business cycle was analysed. The results of this study show that the proposed methodology and statistical tools can give a significant contribution to the improvement of the existing techniques on industrial processes’ monitoring.
Keywords
Introduction
Small enterprises (SEs) are contributing significantly to countries’ economic development.1
It’s important to take into account these organisations’ potential, including ability to flexibly adapt to quickly changing business conditions, create new jobs, promote development of highly dynamic innovation-based economies and transfer of technology and services.
Evolving business conditions (which reflect this segment’s specific development tendencies in various countries) promoted, especially during the previous decade, a growing interest to the nature of the emerging structural changes. Accordingly, there is a growing need to advance existing methodological approaches and design new ones, to more accurately measure various parameters of business conditions for entrepreneurship [4].
A substantiated reference point for advancing statistical techniques to measure small entrepreneurs’ business activity is provided by the long international experience, where various indicators based on business conditions surveys are applied to measure business sentiment [8, 9, 31].
More than 50 years of their successful application to support economic decision-making stress the need to update the existing techniques, and adopt such approaches in countries whose statistical practices lack similar methodological and empirical studies.
Contrary to extensive international practices, such studies have not yet become sufficiently common in Russia. Furthermore, current Russian conventional statistical observation practices do not have a potential to promptly measure, and react to the cyclic and structural shifts in small entrepreneurship development in various industries. This is due to a lack of methodological and empirical statistical studies of SEs’ economic activities, based on business conditions surveys. The existing statistical and analytical apparatus requires the development and application of new measurement tools to identify actual and expected short-term business development tendencies. Therefore, the need to upgrade the existing information infrastructure becomes increasingly urgent, especially regarding the extension of available statistical tools and techniques for measuring various activities of the abovementioned economic agents.
Against the background of the emerging new economic growth model, this issue seems to be particularly relevant, and stresses the need for statistical techniques which would help to expand the scope of scientific knowledge and obtain a deeper, more thorough understanding of entrepreneurs’ business sentiment.
In that regard, the goal of the study is the development and testing of techniques and statistical tools that cover the analysis of social and economic processes in small entrepreneurship. At this purpose, in this work composite indicators of business conditions are built and tested. The proposed technique broads the existing theoretical and empirical practices on the study of small entrepreneurship’s branch tendencies and can be easily extended to other countries’ structures.
The proposed methodology was tested and applied to measure and analyse business conditions for small Russian retail companies. The following business composite indicators (CIs) were built: Retail Market Indicator (RMI) and Retail Business Potential Indicator (RBPI). Tracers of these indicators’ cyclic profiles were constructed by decomposing the CI dynamics, to analyse business growth at various stages of the business cycle.
In the conditions of turbulence in economic development and toughening competition between SEs, requirements for information and analytical support are increasing, as a result of which statistical information is becoming an increasingly important resource. Obtaining such assessments will help to identify important extensive and intensive factors that determine the dynamics of the enterprises development, as well as guide legislative or political decisions aimed at optimizing business activity. The development of market relations determines the growing role of the available information set due to the fact that there is an increasing need to study the influence of a wide range of factors reflecting the state of the economic environment at the macro, meso and micro levels on the performance of economic agents.
In the context of dynamic economic transformations, a comprehensive system of composite indicators of early response is needed to measure business sentiment in small retail market organizations, in particular, reflecting the business environment, business potential, competitiveness, investment activity, etc. The wording “composite indicators of early response” in this study is based primarily on the specifics of the empirical base of study. The fundamental criterion for the above definition is the deadline for receiving information and the possibility of official publication of the results of conjuncture monitoring and indicators. This is especially important, because business survey data are usually available much earlier than the corresponding quantitative macro-aggregates. So, for example, according to the publication plan of Russian Federal State Statistics Service, the main indicators of business activity are published at the end of the last month of the reporting quarter, while the corresponding quantitative statistics are significantly delayed, becoming available no earlier than the second half of the next month.
Moreover, if traditional statistics are expressed in cost and volume, then conjuncture monitoring uses an ordinal scale for all variables, usually a three-point scale (increase/without change/decrease), which makes them quite sensitive to short-term cyclic changes. In addition, these variables are related to the judgments and expectations of economic agents that are able to record cyclical changes earlier than the corresponding statistical meters.
The importance of developing such leading indicators is growing, especially during the period of economic destabilization. It is in these conditions that the delay in economic support due to the insufficient speed and increased depth of research can keep the economy at new lows of its cyclical development.
Given the breadth and diversity of trading activities as a multifaceted economic phenomenon, measuring the current business climate using only one indicator cannot effectively reflect all the features of industry trends. Numerous and intense connections between the various components of the trading process require additional CIs.
A composite indicator approach to the study of the segment involves a multidimensional assessment of economic factors that can characterize not only the current state, maturity, competitiveness, innovativeness, but also the market development prospects. The accumulated array of qualitative statistics (retail surveys have been conducted since 1998) indicates that entrepreneurs are able to provide comprehensive (within the framework of the questionnaire) information that allows us to evaluate not only prevailing, but also expected trends in the development of the situation in a particular field of activity. In this regard, the importance of developing, for example, an indicator of retail business potential (RBPI) as the measuring indicator lies in the fact that its components are predictive assessments of entrepreneurs about the short-term prospects for the development of their business for the coming quarter. The results of conjuncture surveys presented in the public domain on the Russian Federal State Statistics Service website demonstrate a high accuracy of the business response to the expected market fluctuations if we conduct a retrospective data analysis. The good quality of forecasts based on business surveys should not be surprising, since they are based on estimates of people who are fully aware of planned sales, turnover, stocks, number of employees, the general economic situation – indicators that, along with other endogenous and exogenous variables form a business strategy. Based on the monitoring data, an obvious striking example of possible upcoming negative changes, for example, in retail trade, are such forecast signals from respondents as a reduction in the number of employees, a decrease in the assortment, plans to reduce storage space, etc. It is empirically proven that fluctuations in forecast estimates are reliable positive or negative short-term signals of possible transformations of the trading process.
Thus, RMI as a generalized characteristic of the results of the industry activity surveys is primarily intended to provide an early and quick assessment of the cyclical situation in the industry, while RBPI, as an additional indicator, should be a harbinger – a guideline for short-term changes.
The choice of the sector for the study is explained by the high volatility of retail businesses. The history of retail is closely linked to technological innovations, and to consumers’ changing lifestyle. During the previous decade, technological development has led to the emergence of new formats for buyers’ interaction with supplier companies. According to IDC Future Scape global estimates [23], by 2020 three times more companies than now will be able to successfully link their customer relations strategies to the so-called “third platform” technologies, i.e. those that combine Big Data processing and visualisation techniques with social, mobile, and cloud technologies. The success of catering to tomorrow’s buyers will directly depend on the application of such technologies. Since these companies’ economic activities serve as major market drivers, their results provide some of the most important and accurate business sentiment indicators, due to close links with the consumer segment [4]. Russian households’ expenditures on goods, including those purchased from retail companies, exceed 60% of their disposable income.
The paper is structured as follows: the first section provides a review of the existing small entrepreneurship studies based on application of CIs. The second section presents the proposed methodology for building CIs, and describes the empirical basis of the calculations. The results of the study are presented in the third section.
Review of international practices
The increasingly quick transformation of statistical approaches, techniques, and methods applied to measure SEs tendencies is evidence of the importance, in national economies, of the object under study. Countries which have a long empirical experience of studying small entrepreneurship through business surveys, using composite indicators built on the basis of the collected data, have established important discussion platforms to exchange relevant results achieved in this field of knowledge. The US, UK, Sweden, Germany, Italy, Japan, China, Australia and New Zealand can be named as leaders in this area [31]. The better-known relevant organisations include the US National Federation of Independent Business, the US Bureau of Economic Analysis, the Swiss Economic Institute, the Ifo Institute (Germany), the Institute for Studies and Economic Analyses (Italy), The Brazilian Institute of Economics, and the South African Bureau for Economic Research.
E.g. one of the more widely applied in the US indicators is Small Business Optimism Index calculated jointly by the National Federation of Independent Business (NFIB) and the major banking corporation Wells Fargo [35]. An index describing the current state of SEs specialising in various industries (also for specific regions) has been maintained by the Canadian Federation of Independent Business (CFIB) for a long time [6].
The German statistical practice has a significant experience of measuring business climate for small entrepreneurship. E.g. the Munich Institute for Economic Studies (Institut für Wirtschaftsforschung – Ifo) calculates a specialised business climate index for small and medium companies (KfW ifo SME Barometer), commissioned by the banking group KfW (Kreditanstalt für Wiederaufbau). On the whole, the best-known German indicators for tracking and forecasting economic cycles are considered to be the ZEW Indicator of Economic Sentiment, applied in the German financial sector, ifo Index West German business sentiment, ifo Business Climate Index, measuring business confidence/climate in Germany, ifo World Economic Climate Index and ifo Business Climate Index in the German service sector.
In the UK, the Federation of Small Businesses (FSB) [18], a leading British organisation protecting small business owners’ interests, studies and analyses industry-specific small entrepreneurship tendencies. In particular, the FSB maintains a composite business climate indicator for small businesses specialising in various industries, including for various UK regions – the Small Business Index (SBI). The index calculation is based on quarterly surveys of small businesses – members of the FSB Big Voice community.2 In addition, the British group Sage conducts a major exercise to assess the state of SE in various countries. The results are aggregated into an indicator called the 41 [32], which allows to monitor business climate for small companies not just in the UK but in 17 other countries.3 Also interesting is the survey of small businesses conducted by the major consulting and marketing firm BVA BDRC [5], commissioned by the R3: Association of Business Recovery Professionals. The monthly Business Distress Index Barometer publishes an index that allows assessing the scale of British small businesses’ financial problems. This study is important for the British economy because it helps to detect companies potentially facing bankruptcy at an early stage, to provide them support and help maintain their market shares.
One of the better-known Italian indicators is the Italian Services Purchasing Managers Index (PMI).4 This forward-oriented indicator provides up-to-date information about changing business climate, and it is widely applied by companies, government agencies and financial analysts to better understand business conditions and design investment strategies. In addition, since June 2012 Italian experts calculate the composite Istat Economic Sentiment Indicator (IESI) [24], broken down by industries.
The Business Trust Index INSEE and the Business Climate Index PMI are considered to be the main statistical indicators describing business conditions for small entrepreneurs in France (calculated using the INSEE methodology and published by the financial group BNP Paribas). Business activities of French entrepreneurs in various industries are also analysed by experts employed by the French Small Business Centres Association [15]. Business activity indices are calculated quarterly using a sample of 15 thousand small retail and service companies.
The Japanese experience of analysing business climate for SEs also has to be considered. Based on relevant studies, the government annually presents to the parliament a report on SMEs development tendencies – the White Paper on Small and Medium Enterprises in Japan. The most important business climate indicator in Japan is Tankan, since 1957 quarterly published in the economic review Tankan Report by the Bank of Japan [3].
Another good example of studying business climate for small enterprises in East Asia is provided by China. The best-known national indicator is the Diffuse Business Activity Index (PMI), calculated using a methodology similar to the relevant European indicator. Small and Medium Business Sentiment Index5 is calculated in China specifically to analyse business conditions for small entrepreneurship.
Also noteworthy are statistical tools applied to assess entrepreneurship in Oceania countries – Australia and New Zealand. Specifically, the National Australia Bank Group publishes the NAB Business Confidence Index and the NAB Business Conditions Index, based on monthly surveys of small companies. A similar indicator – the Sensis
In New Zealand business conditions for small companies are assessed by the Australia and New Zealand Banking Group, Limited (ANZ), which every month calculates the ANZ Business Confidence Index. This diffuse index is published in the monthly ANZ Business Outlook, which has established a reputation as an important information source, being not just the oldest business opinion review but also providing a reliable and up-to-date analysis of the current and expected economic situation in New Zealand.
The international project Global Entrepreneurship Monitor (GEM) [21] deserves a special note. The monitoring was started in 1999 by the UK, US, French, and Italian researchers; currently 70 countries participate in the project including Russia, which has joined in 2006.6 The study of entrepreneurship conducted in the scope of the project allows to compare effects of various specifically national business development aspects over the rate of business start-ups in various countries and identify the reasons for discontinuing entrepreneurial activities [7]. The GEM project is focused on studying interconnections between entrepreneurship and economic growth.
Overall, the existing methodologies for building CIs are mostly based on application of diffusion indices, which are relatively easy to calculate and include a minimal set of constituting variables. Keeping in mind the growing role of small entrepreneurship in countries’ economic development, the need to advance the existing practices of calculating CIs for statistical measurement of business conditions becomes an increasingly relevant task.
Development of new relevant methodologies would help to obtain a more detailed knowledge of the current and future industry-specific business tendencies, which in turn would contribute to quickly shaping relevant policies and extending the information and analysis basis.
Methodological and empirical basis of the study
Methodology
Keeping in mind the high productivity of international statistical tools applied to develop CIs, this study is based on the methodological principles adhered to by the Organisation for Economic Cooperation and Development [30] and the European Commission [11, 12, 13, 14]. Relevant Russian experience of measuring large companies’ business sentiment was also taken into account [26]. The main techniques applied in this study to process results of business conditions surveys include econometrics and applied statistics tools such as multidimensional statistical analysis of parametric and nonnumeric data. A number of software application suites including SPSS, MS Excel, and EViews were employed to accomplish the objectives of the study.
The empirical basis for the calculations was provided by quarterly business conditions surveys for small Russian retail companies conducted by the Russian Federal State Statistics Service between 2005 – 2018. The sample for this study comprised 3 000 SMEs economic agents from more than 80 Russian regions. The results of business conditions studies (freely available at the Russian Federal State Statistics Service website) show, if retrospective data analysis is applied, a high accuracy of companies’ reactions to expected business conditions changes. It was empirically proven that their varying projections and predictive estimates provide reliable short-term positive or negative signals of the trade sector’s development.
The system of surveys indicators is based on three-category graduation of all questions: growth (improvement) (
Methodology for building short-term cyclic composite indicator.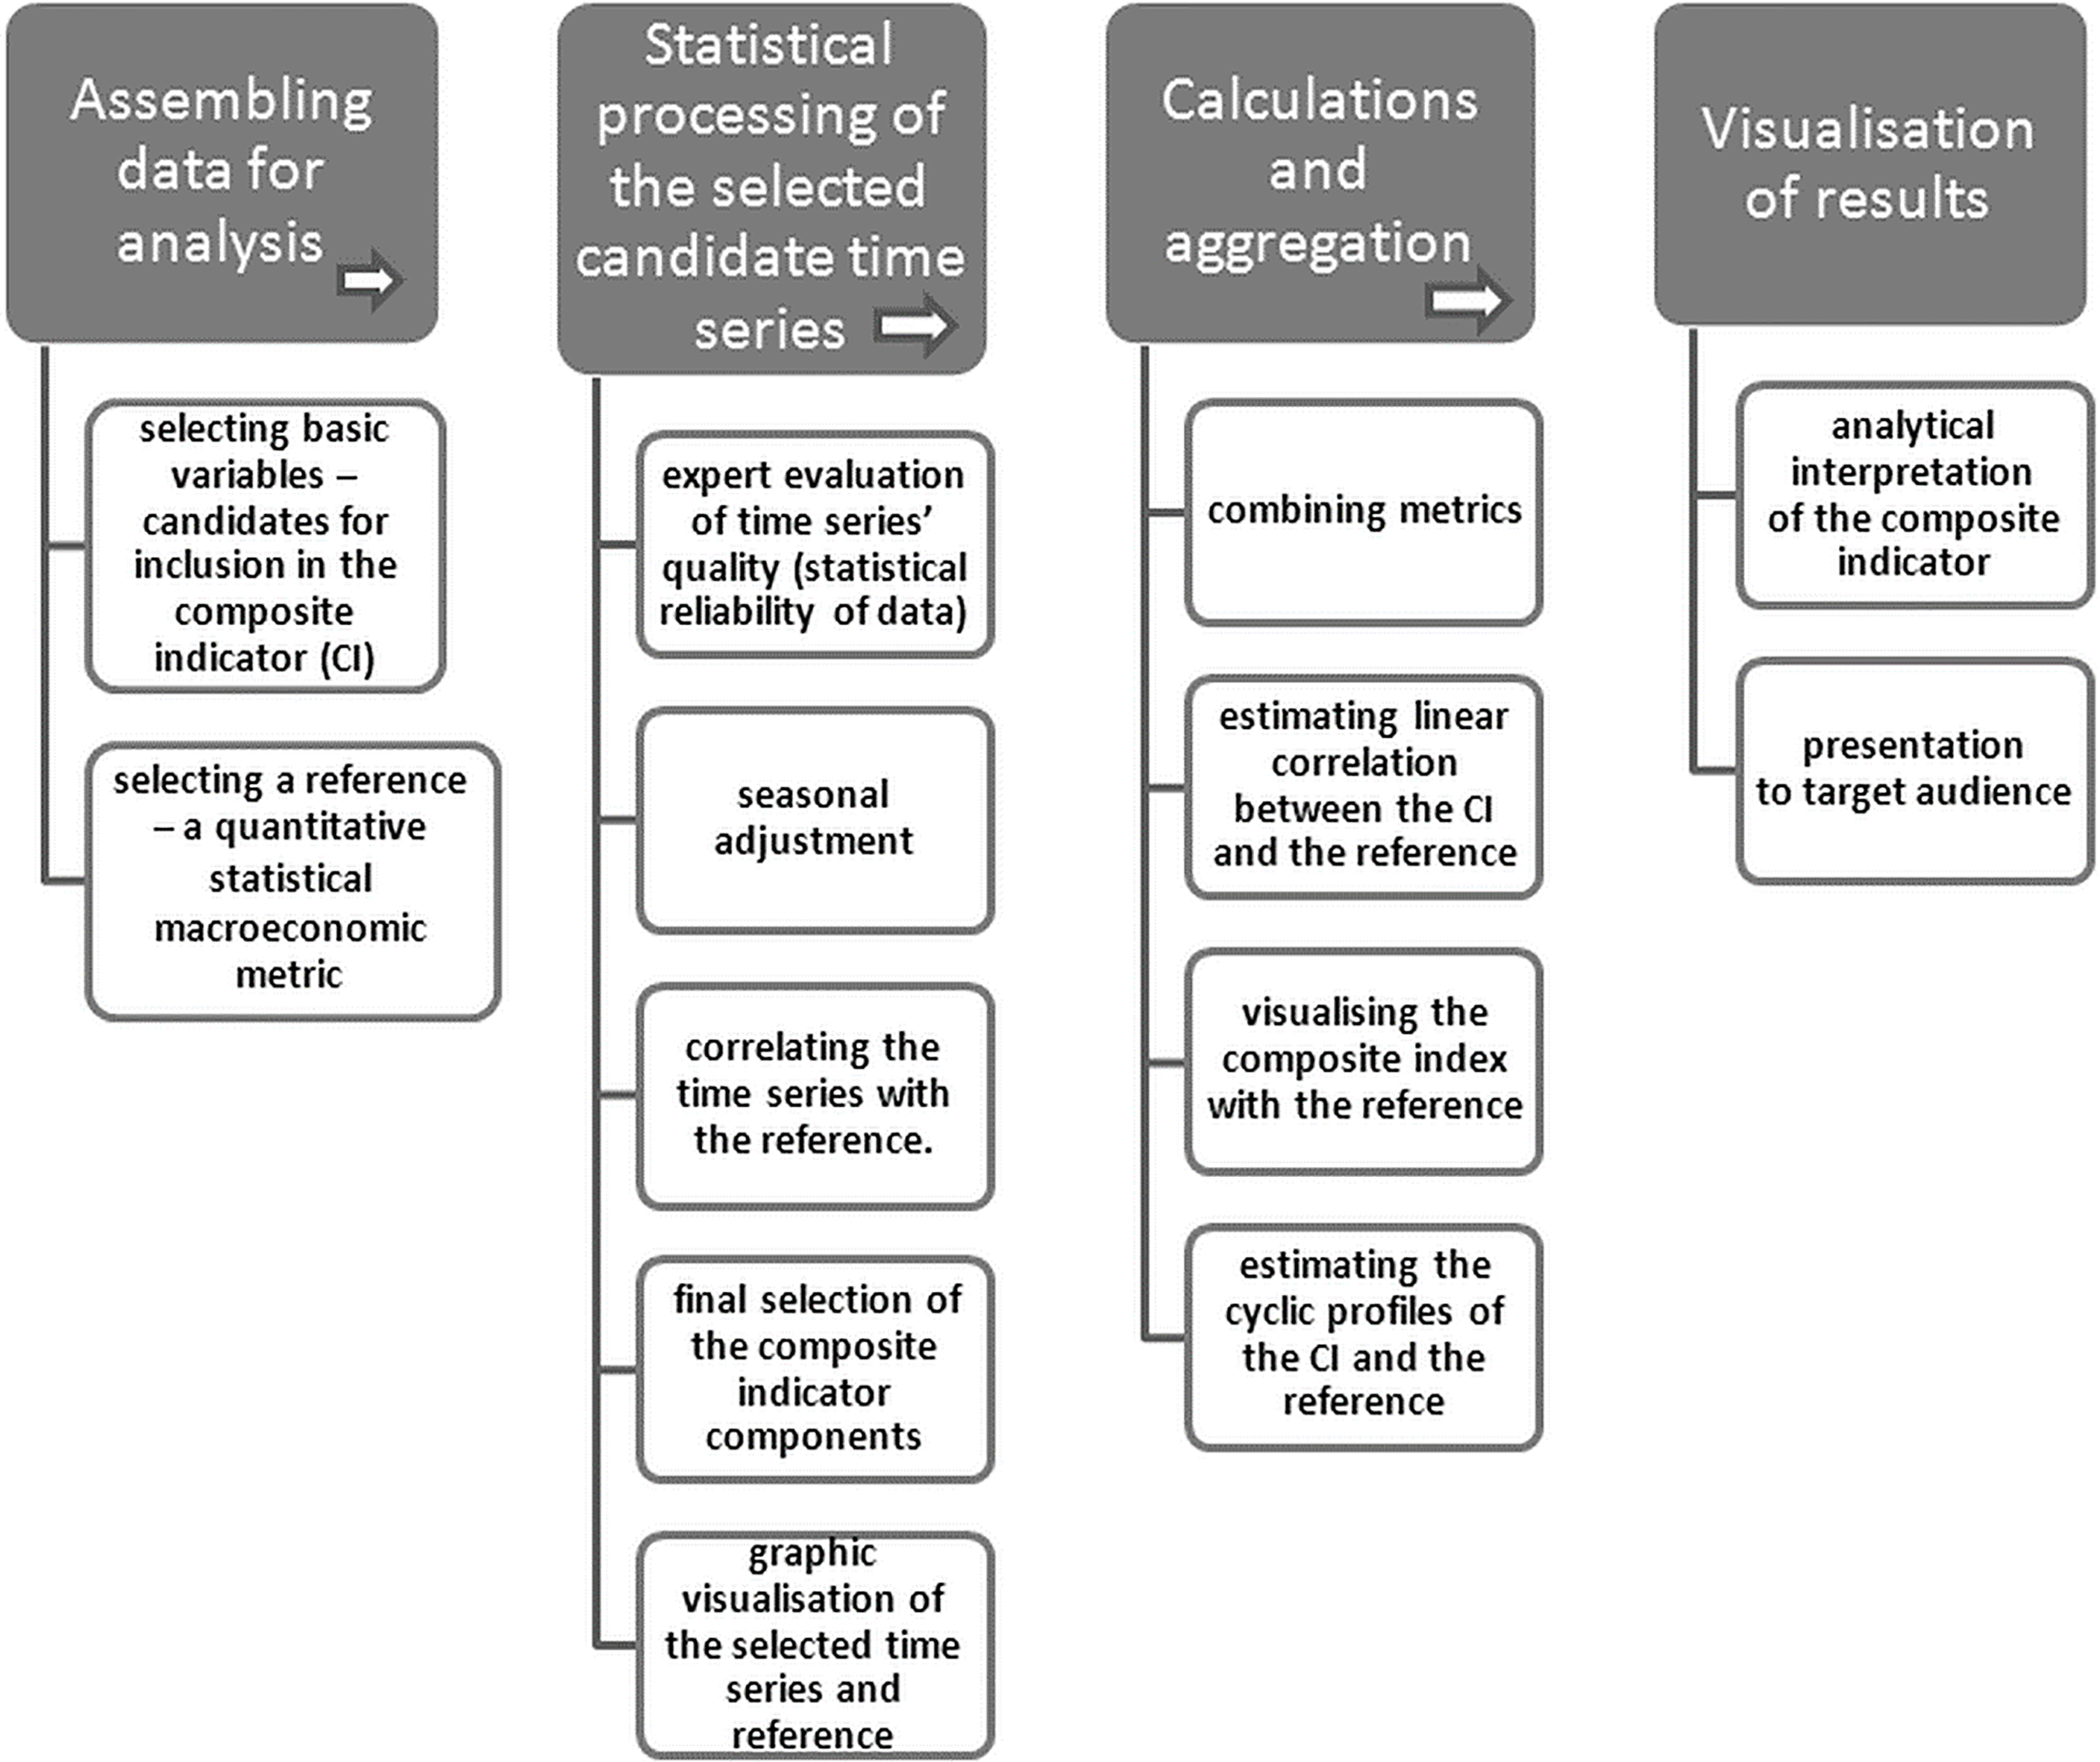
The general sequence of steps recommended as main iterations to build a CI for SEs based on business conditions monitoring results is described below, and graphically represented in Fig. 1. The initial data for the analysis was provided by time series of various economic indicators, showing quarterly dynamics for the period under consideration.
Thus, in general terms, the objective of building an indicator can be reduced to a functional representation expressed as follows:
where
where
Note for the “Calculations and aggregation” block: in this context, q-on-q growth rates cycles’ profiles for the indicators under consideration are used.
Taking into account the methodological approaches of the European Commission and the OECD, special attention is paid in the recommendations to the fact that the selected components are based on criteria of economic significance and completeness of information coverage of indicators, and have a linking with corresponding quantitative macroeconomic aggregates characterizing the dynamics of industry development.
As a result, at the first stage of building CI, the task was to select qualitative indicators-applicants, as well as to select a basic (reference) quantitative series that is most closely related to both the components and the future indicator itself, objectively reflecting the development of a process. In this regard, it should be noted that exactly a comparison with the reference series allows us to construct a chronology of cyclic turning points both in its dynamics and in the dynamics of CI, a statistically significant matching with which for potential candidates will allow us to choose the most suitable combination of candidates for CI [12, 26, 31]. For this, each potential CI and reference statistical indicator should have a number of properties that are considered universal, taking into account the existing international and Russian experience. In addition, the selected referent should confirm the reliability of the information base of conjuncture surveys, show a high correlation with the retrospective and current dynamics of one of the most important central economic macro-aggregates of the country.
A metric describing the country’s economic potential was chosen as the reference – volume index (VI) of retail turnover between the 1st quarter of 2005 and the 3th quarter of 2018. Testing of time series of industry-specific indicators including this particular quantitative macroeconomic aggregate revealed a strong correlation between them. In addition, this specific series was chosen to confirm reliability and validity of data collected through business conditions surveys and demonstrate its high correlation with retrospective and current dynamics of one of the most important national economic macro-aggregate indicators.
The choice of candidate metrics for CIs was based on general economic and statistical requirements to industry-specific indicator systems commonly applied in international practices, and on the overall expert opinion reflected in works by Russian economic statisticians. The final choice of metrics for inclusion in CIs seems to be important, since it determines the significant role of economic theory-based criteria supported by expert-based approach. Specifically, one means only the metrics which, taken together, can adequately characterise key aspects of the studied phenomena in the context of trade operations should be included in each CI. And this group must fully reflect all exogenous and endogenous factors affecting tendencies and dynamics of the industry’s development.
In the scope of the “Statistical processing of the selected candidate time series” block, various statistical techniques and tools were applied to confirm or adjust the time series of various indicators selected at the first stage for integration into the CI.
The initial iteration was the seasonal adjustment of all the selected time series – candidates for inclusion in CI [16, 17]. This is a necessary condition for trade companies’ operations, since this economic activity is by its very nature prone to significant seasonal fluctuations. This is clearly demonstrated by all-time series presented in quarterly dynamics and containing more than 60 values.
Visual analysis of the dynamics of each time series from 2005 to 2018 showed that the second and fourth quarters turned out to be the most active phases in trading, while the beginning and the middle of the year, excluding the influence of force majeure circumstances, as a rule demonstrated a steady development tendency according to the inertial scenario of previous periods.
Comparison of such series without eliminating of the seasonal component does not allow us to correctly identify industry events and identify short-term tendencies.
As a result, to analyse the economic dynamics, the series were processed in order to remove seasonality. For the seasonal time series decomposition procedure, the widely used TRAMO/SEATS algorithm was implemented, which is widely used in the econometric SPSS package.
After seasonal depuration, cross-correlational analysis between retail indicator and selected references was performed, to choose a preliminary set of indicators. Empirical examples show that for qualitative indicators, a significant correlation coefficient equals 0.63 or higher; this is confirmed by relevant international and Russian studies [19, 25]. Among other things, a forward-oriented indicator was built in course of analysis, which created the need to cross-compare the time series under study with various lags (specifically, lags falling within the [
Calculations and aggregation
At the final stage of building CI the selected indicators were aggregated by conducting principal component analysis (PCA). This technique is considered a classic and efficient data reduction method, which allows, on the basis of numerous attributes, to identify their meaningful number and explain the cause-and-effect relations in space and time [33, 34]. The essence of this technique and specific features of its application are also described in the works by foreign authors including [27]. The choice of PCA was due to the fact that in a vast majority of cases the first component explains a significant share of the dispersion (in this study, every time the algorithm was applied it was close to 80–95%), which was the main argument in favour of using this technique.
A very useful iteration at this stage was cyclic comparison of the series being analysed. Taking into account the available experience of studying economic cycles, such as PAT method (phase-average trend) with MCD (months for cyclical dominance) smoothing [28]; Christiano-Fitzgerald (CF) filter [7], and Hodrick-Prescott (HP) filter [22], the latter was chosen to identify cyclic components in the indicators’ dynamics.
Recent OECD studies of various techniques for statistical filtration of cyclic profiles suggest that the well-known Hodrick-Prescott filter should be given preference when studying economic cycles. Specifically, Nilsson and Gyomai [29] offer quite convincing empirical arguments in favour of double application of the HP filter. It was also established that this method allows not only to minimise the sum of deviations between the trend and the original series, in an optimal for the analysed series way, but also minimise, in the course of the first application, the trend’s curve by adjusting the parameter
Then, applying the HP filter to the series
It should be noted that during filtration the parameter
where
Thus the following key
When the EC methodology is applied to study cyclic profiles, the Hodrick-Prescott filter is typically used with fluctuation smoothing starting at 18 months. This fluctuation amplitude was established empirically, and it is now successfully applied by various researchers to study cycles, e.g., Christian Gayer in [20] also cites the above fluctuation exclusion period, and the
Retail Market Indicator
At the first stage, based on the national statistical observation form N1-business conditions (retail), the best candidate metrics were selected which characterise dynamics of retail companies’ performance. The table below presents these metrics with subsequent seasonal adjustment (Table 1).
Small retail companies’ performance indicators selected for possible inclusion in the RMI
Small retail companies’ performance indicators selected for possible inclusion in the RMI
Source: composed by the author.
Results of testing indicators for their potential inclusion in the RMI, using cross-correlational function
Source: composed and calculated by the author.
In the next stage, cross-correlational analysis between the time series data and the dynamics of the quantitative statistical indicator Retail Turnover VI was conducted. The testing revealed a weak correlation between retail turnover cycles’ dynamics and the following variables: tovobo_et, opnovo_et, oekpt_et, konkur_cl, chiso_et, izcro_ct, izcro_et. The variables skpo_ct, skpo_et, oekpt_cl, ozszs_cl had low negative cross-correlation values, and thus have been excluded from further calculations.
The strongest correlation with the reference indicator was established for the following variables: tovobo_ct, opnovo_ct, ptro_ct, oekpt_ct, ozszs_ct, ofco_ct. Cross-correlation coefficients between each of the above indicators and the reference indicator were in excess of 0.7, so they were included in the group of primary candidates for integration into the CI.
Along with the abovementioned leaders, a moderate correlation was established for the variables ptro_et, asto_ct, asto_et, which also allowed including them in the number of candidate index components. The variables konkur_ct, konkur_et, and chiso_ct were described by forward-oriented characteristics: the highest correlation coefficient values were established with (
Thus on the basis of the results obtained after the experiment, 12 variables were provisionally included in the CI measuring business conditions for small retail companies (highlighted in bold font in Table 2 below).
The existing CI calculation practices show that the optimal number of indicator components usually does not exceed 10 variables, which allows to obtaining quite adequate results.
Therefore it was decided to include the following 7 metrics in the CI, whose trends dominate in the retail segment’s development and which were expressed by the respondents’ assessment of the actual changes of retail turnover; sales volume; product orders; number of employees; warehouse stocks volume; competitiveness; and economic situation. This set of variables makes the composite indicator precise and balanced, characterising the industry development on a more aggregated level.
At the final stage, the abovementioned indicators were aggregated using the principal components analysis technique. Table 3 below presents the sensitivity threshold and the cumulative percentage of data interpretation by principal components.
Total dispersion of principal components (RMI)
Source: composed and calculated by the author.
Combined dynamics Retail Market Indicator (RMI) values for small businesses and statistical reference – Retail Turnover.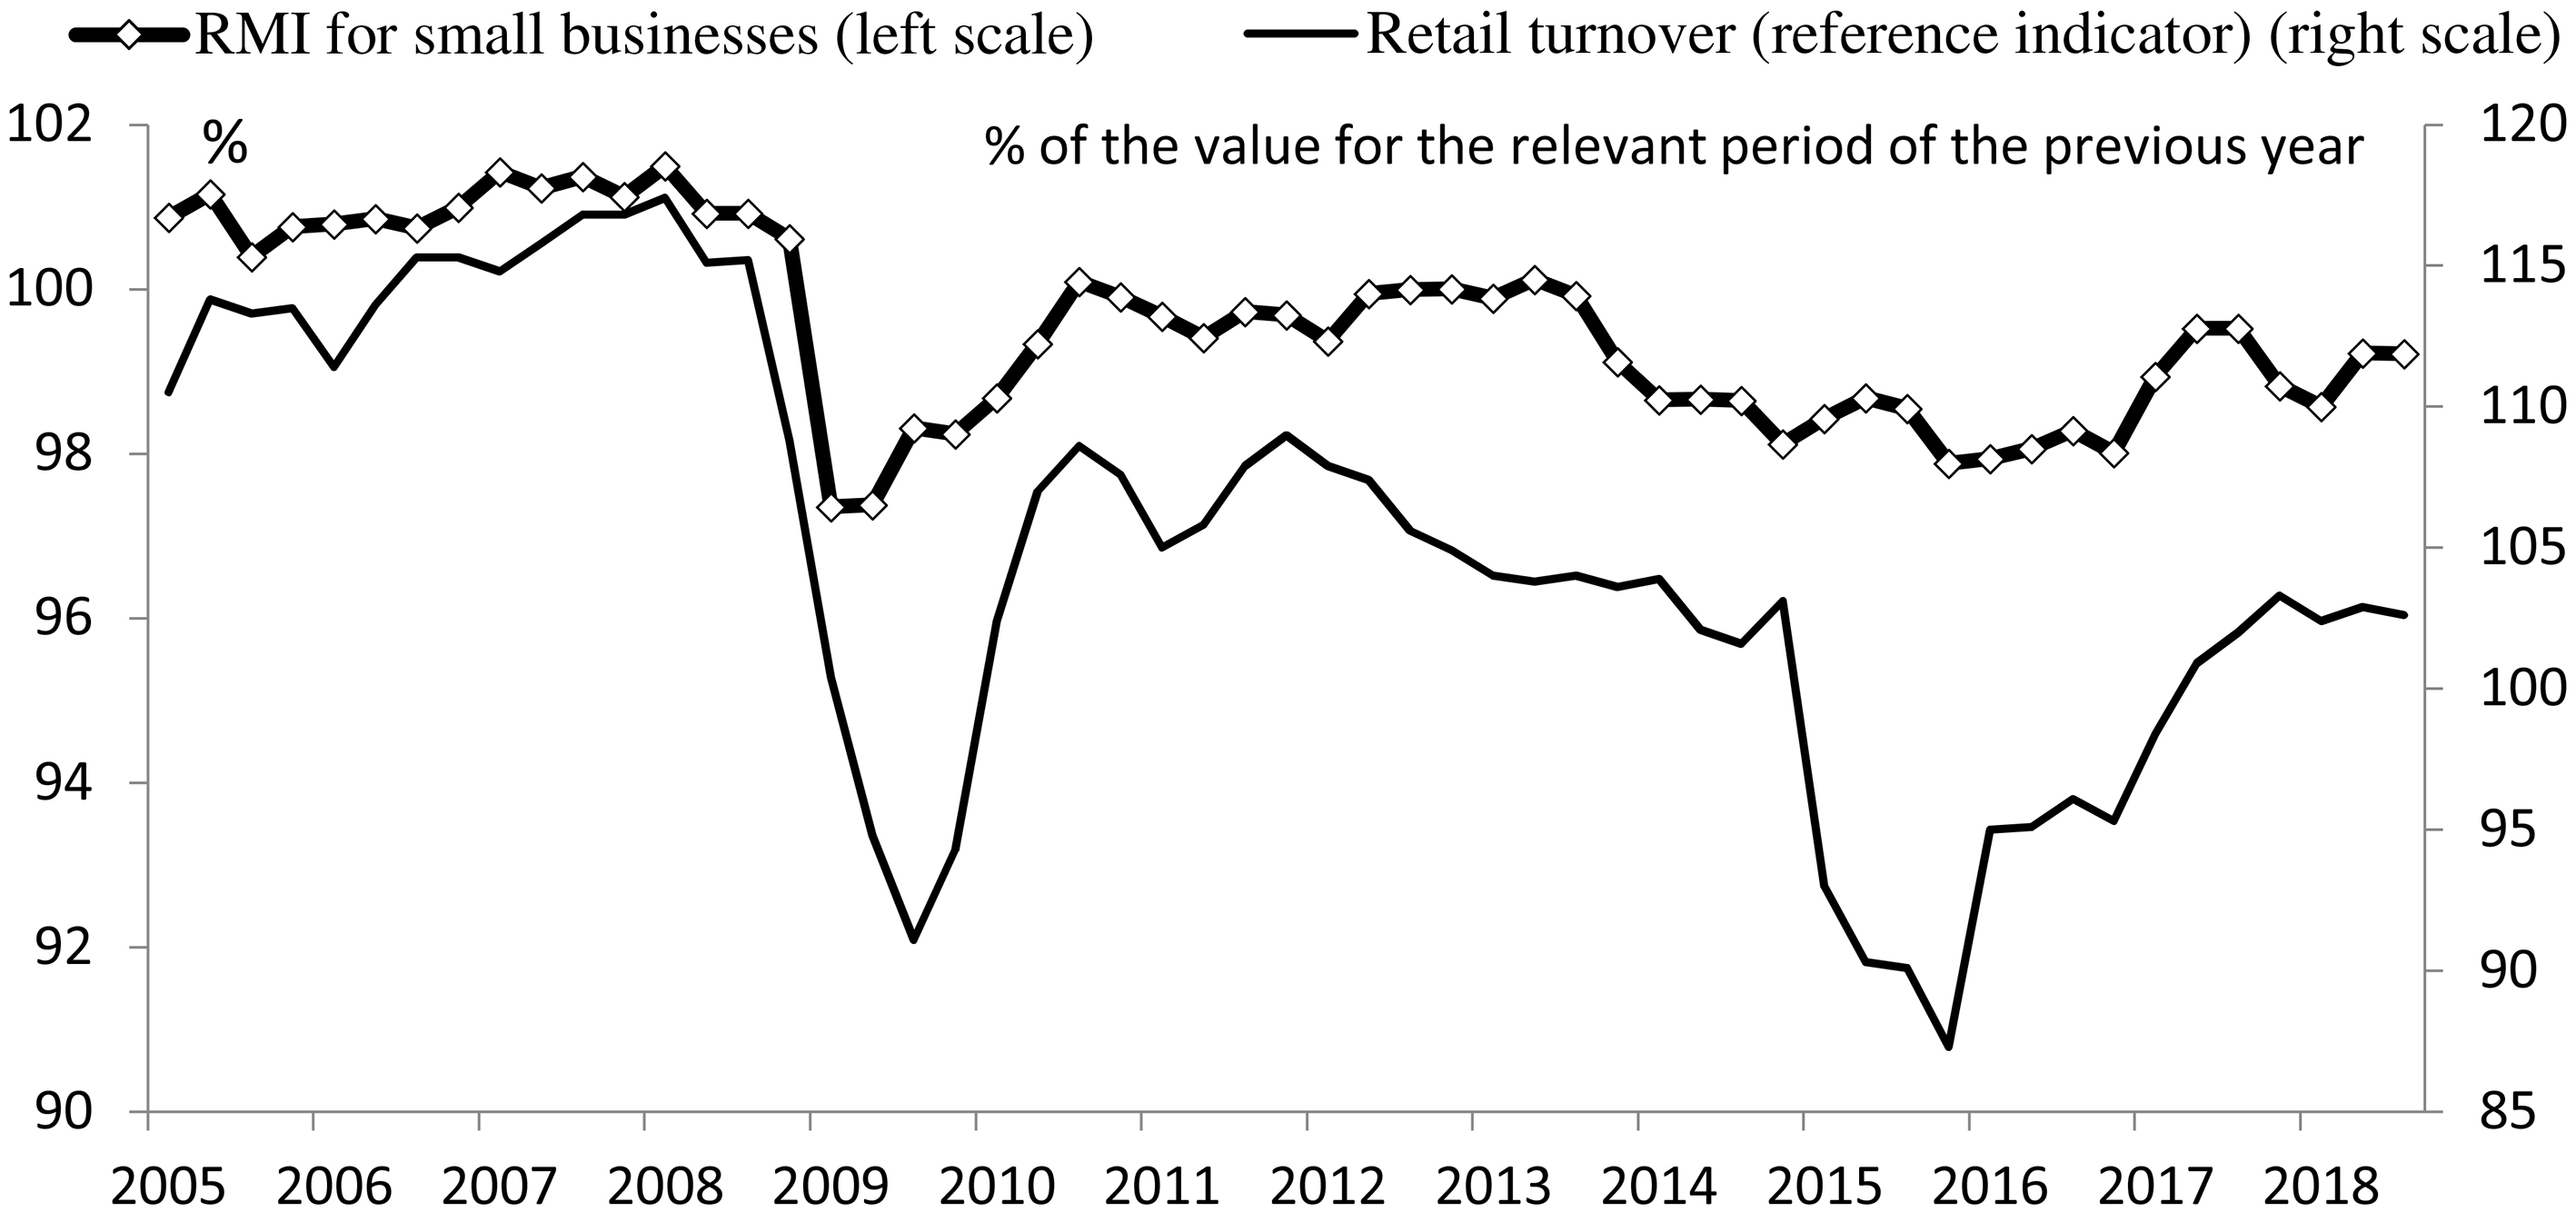
RMI medium-term cycle (MTC) and short-term unsmoothed amplitude cycle (STUC).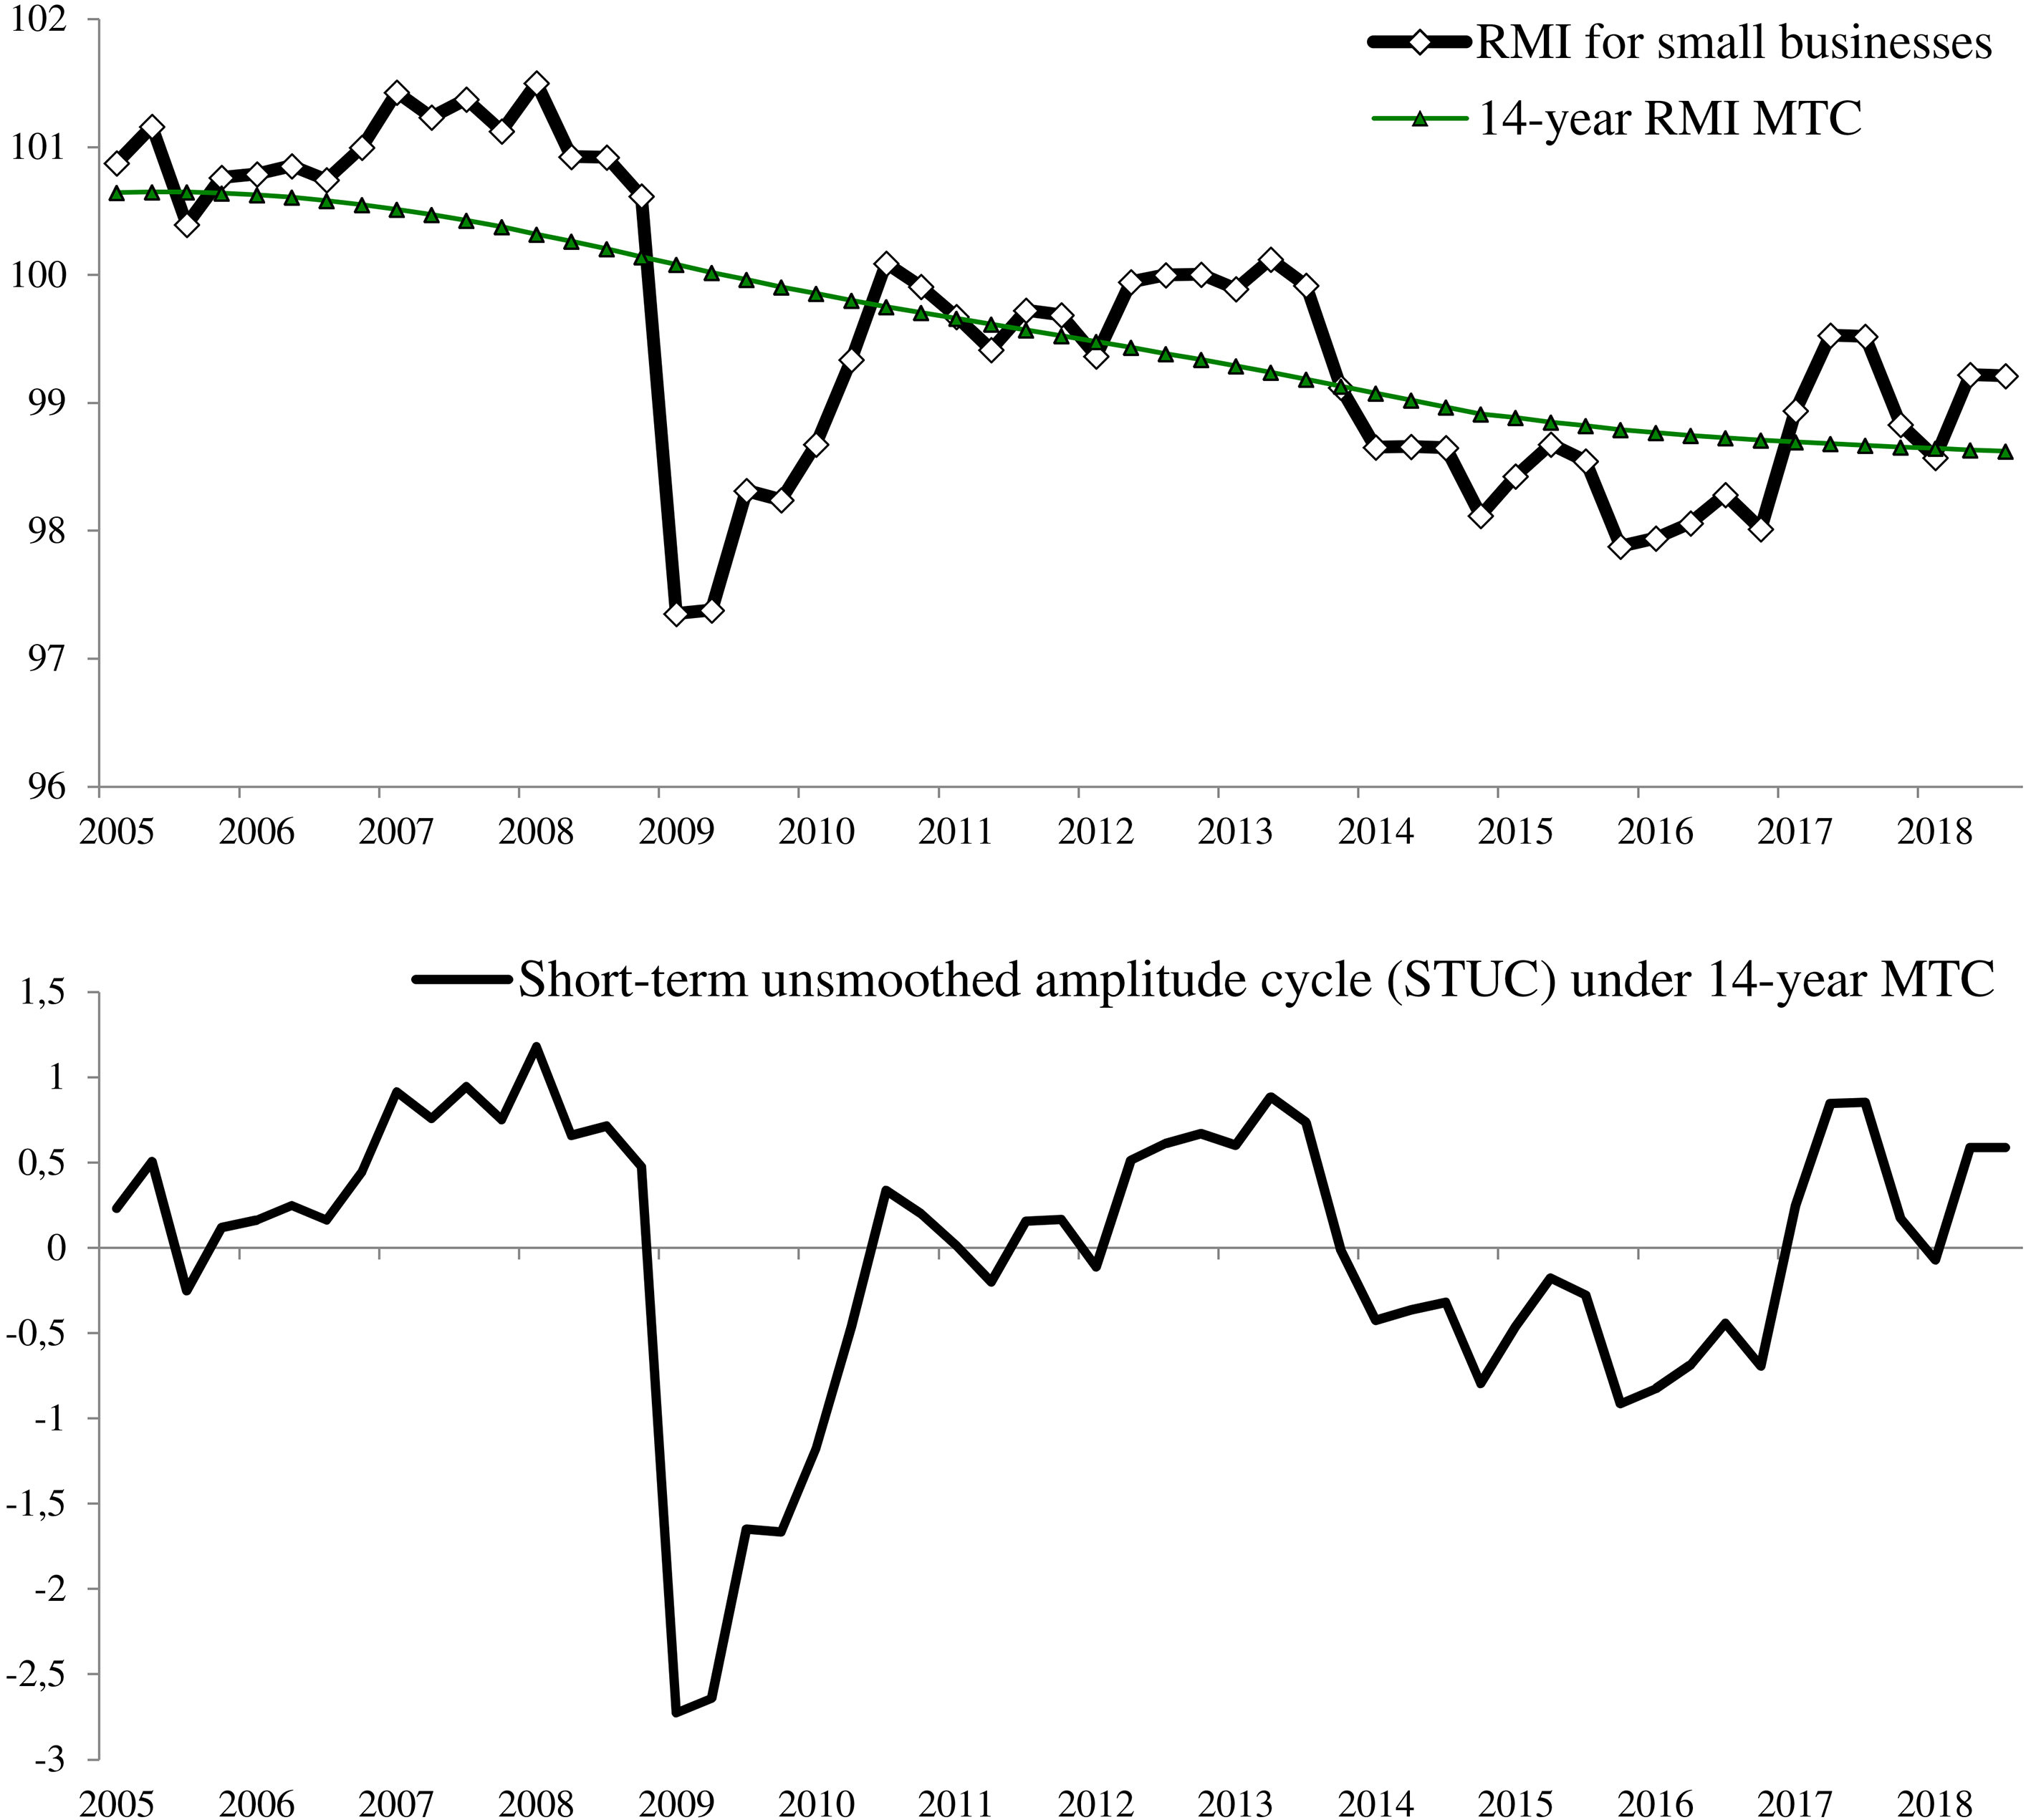
Based on the analysis results a single principal component was identified, responsible for 85.54% of all variation and representing the sought composite index (RMI).
Results of visual (graphic) and cross-correlational comparison of the RMI and the quantitative macroeconomic indicator (Retail Turnover VI) dynamics (see Fig. 2) reveal a stable statistical relationships between these indicators, with a meaningful synchronous correlation (0.83), a one quarter lead, and a high cross-correlation coefficient (0.79).
Next iteration included analysis of small companies’ RMI cyclic profile. The RMI’s cyclic component was analysed by identifying a 14-year medium-term cycle (MTC) and selecting between 18, 24, and 30-month short-term cycles (STC), determined by periodisation of the available time series. Decomposing the RMI by applying the HP filter with
Subsequent cyclic indication amounted to selection of short-term cycles with excluded 18-, 24- and 30-month cycles, which in principle matches their classic 2–3 years Kitchin periodisation. Accordingly, the second application of the filter with
RMI short-term smoothed amplitude cycles (STSC).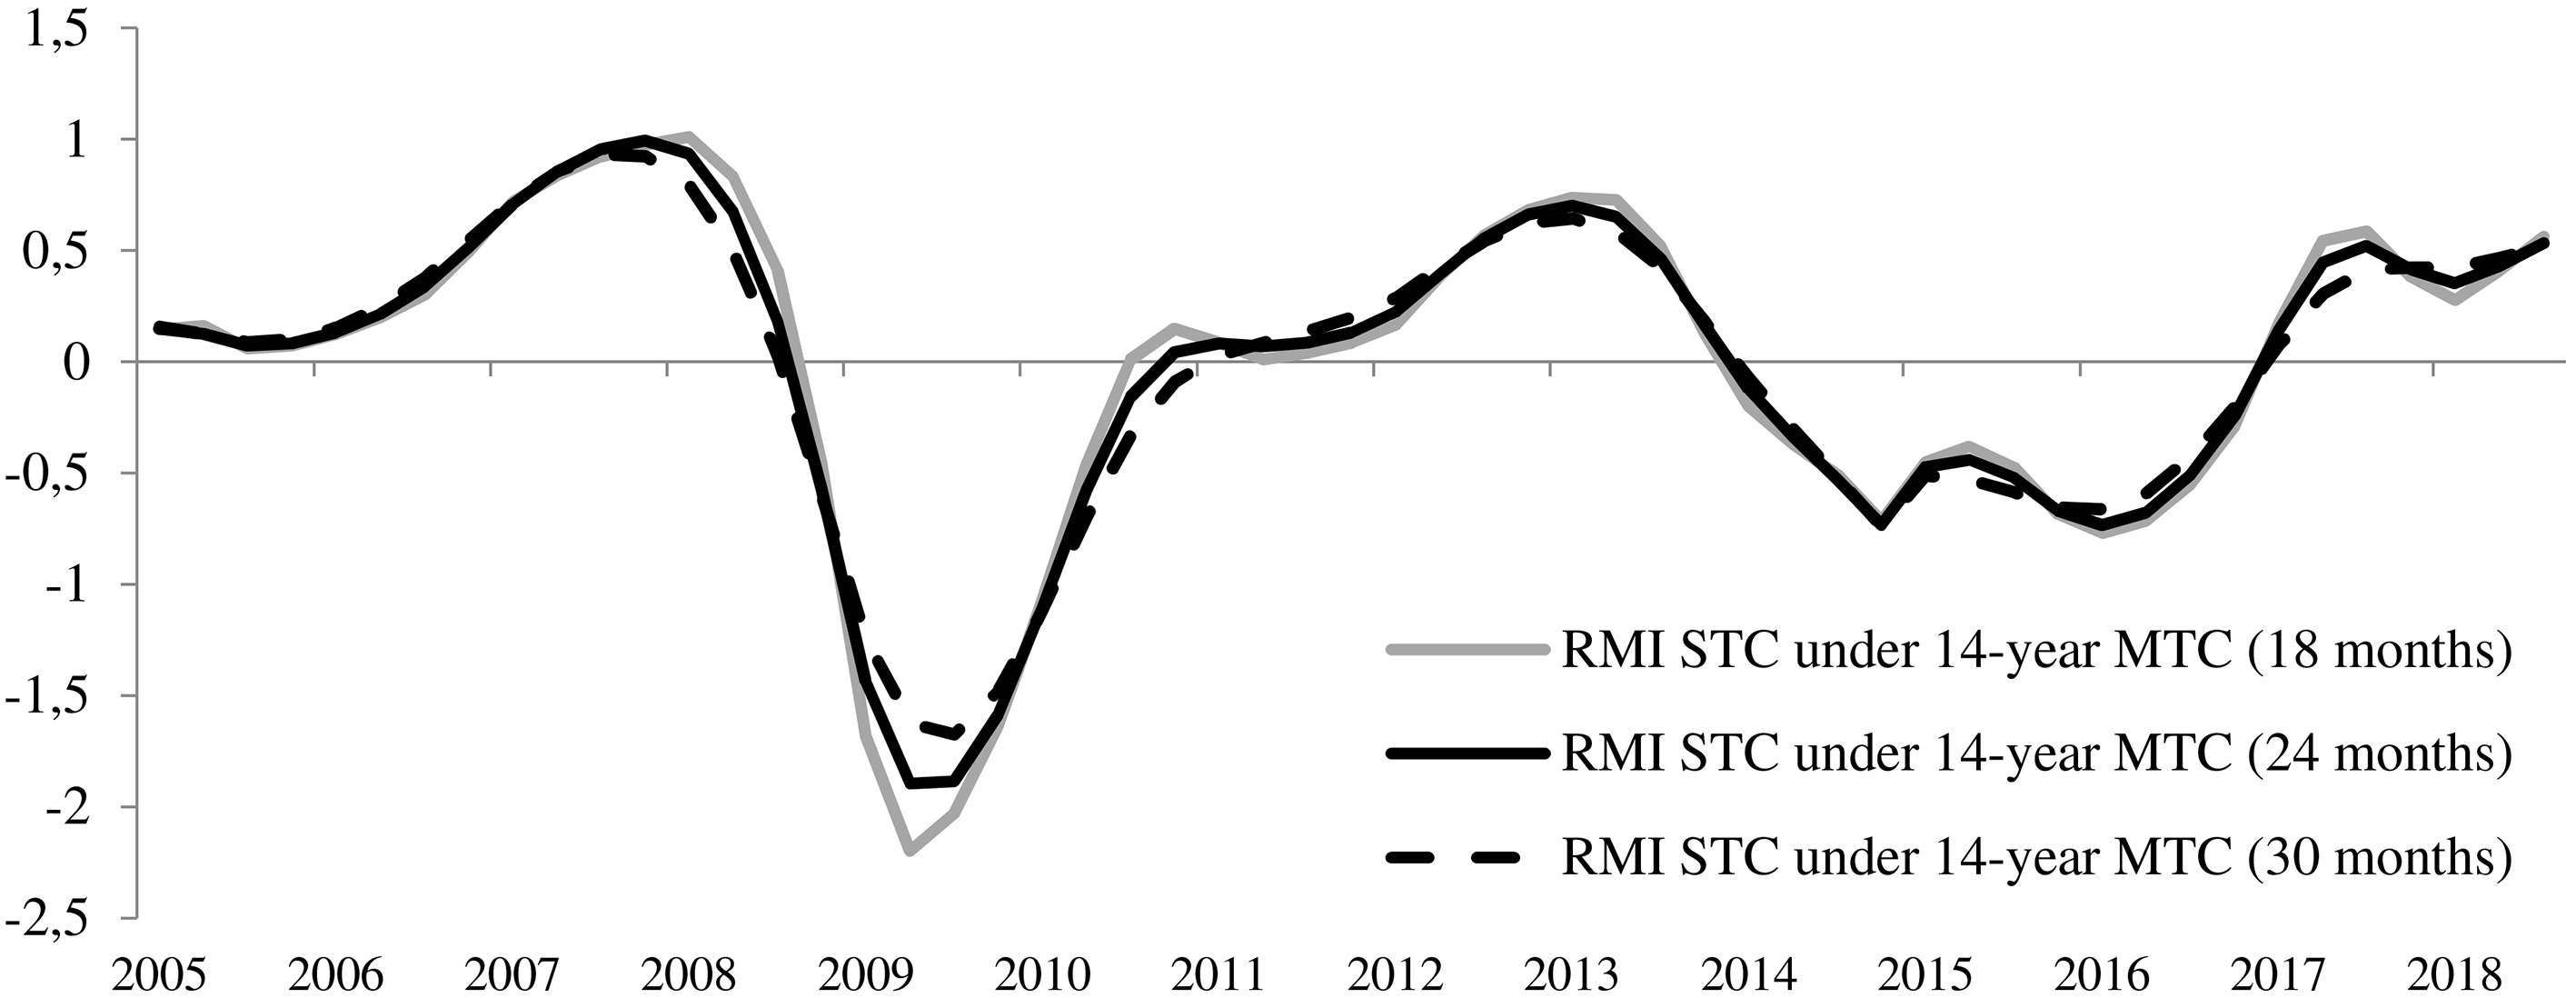
Combined cross-correlational analysis with the initial dynamics revealed a statistically significant and persistent short-term cycle, e.g. between the 1
RMI smoothed short-term cycle (STSC) under 14-year STC (18 months).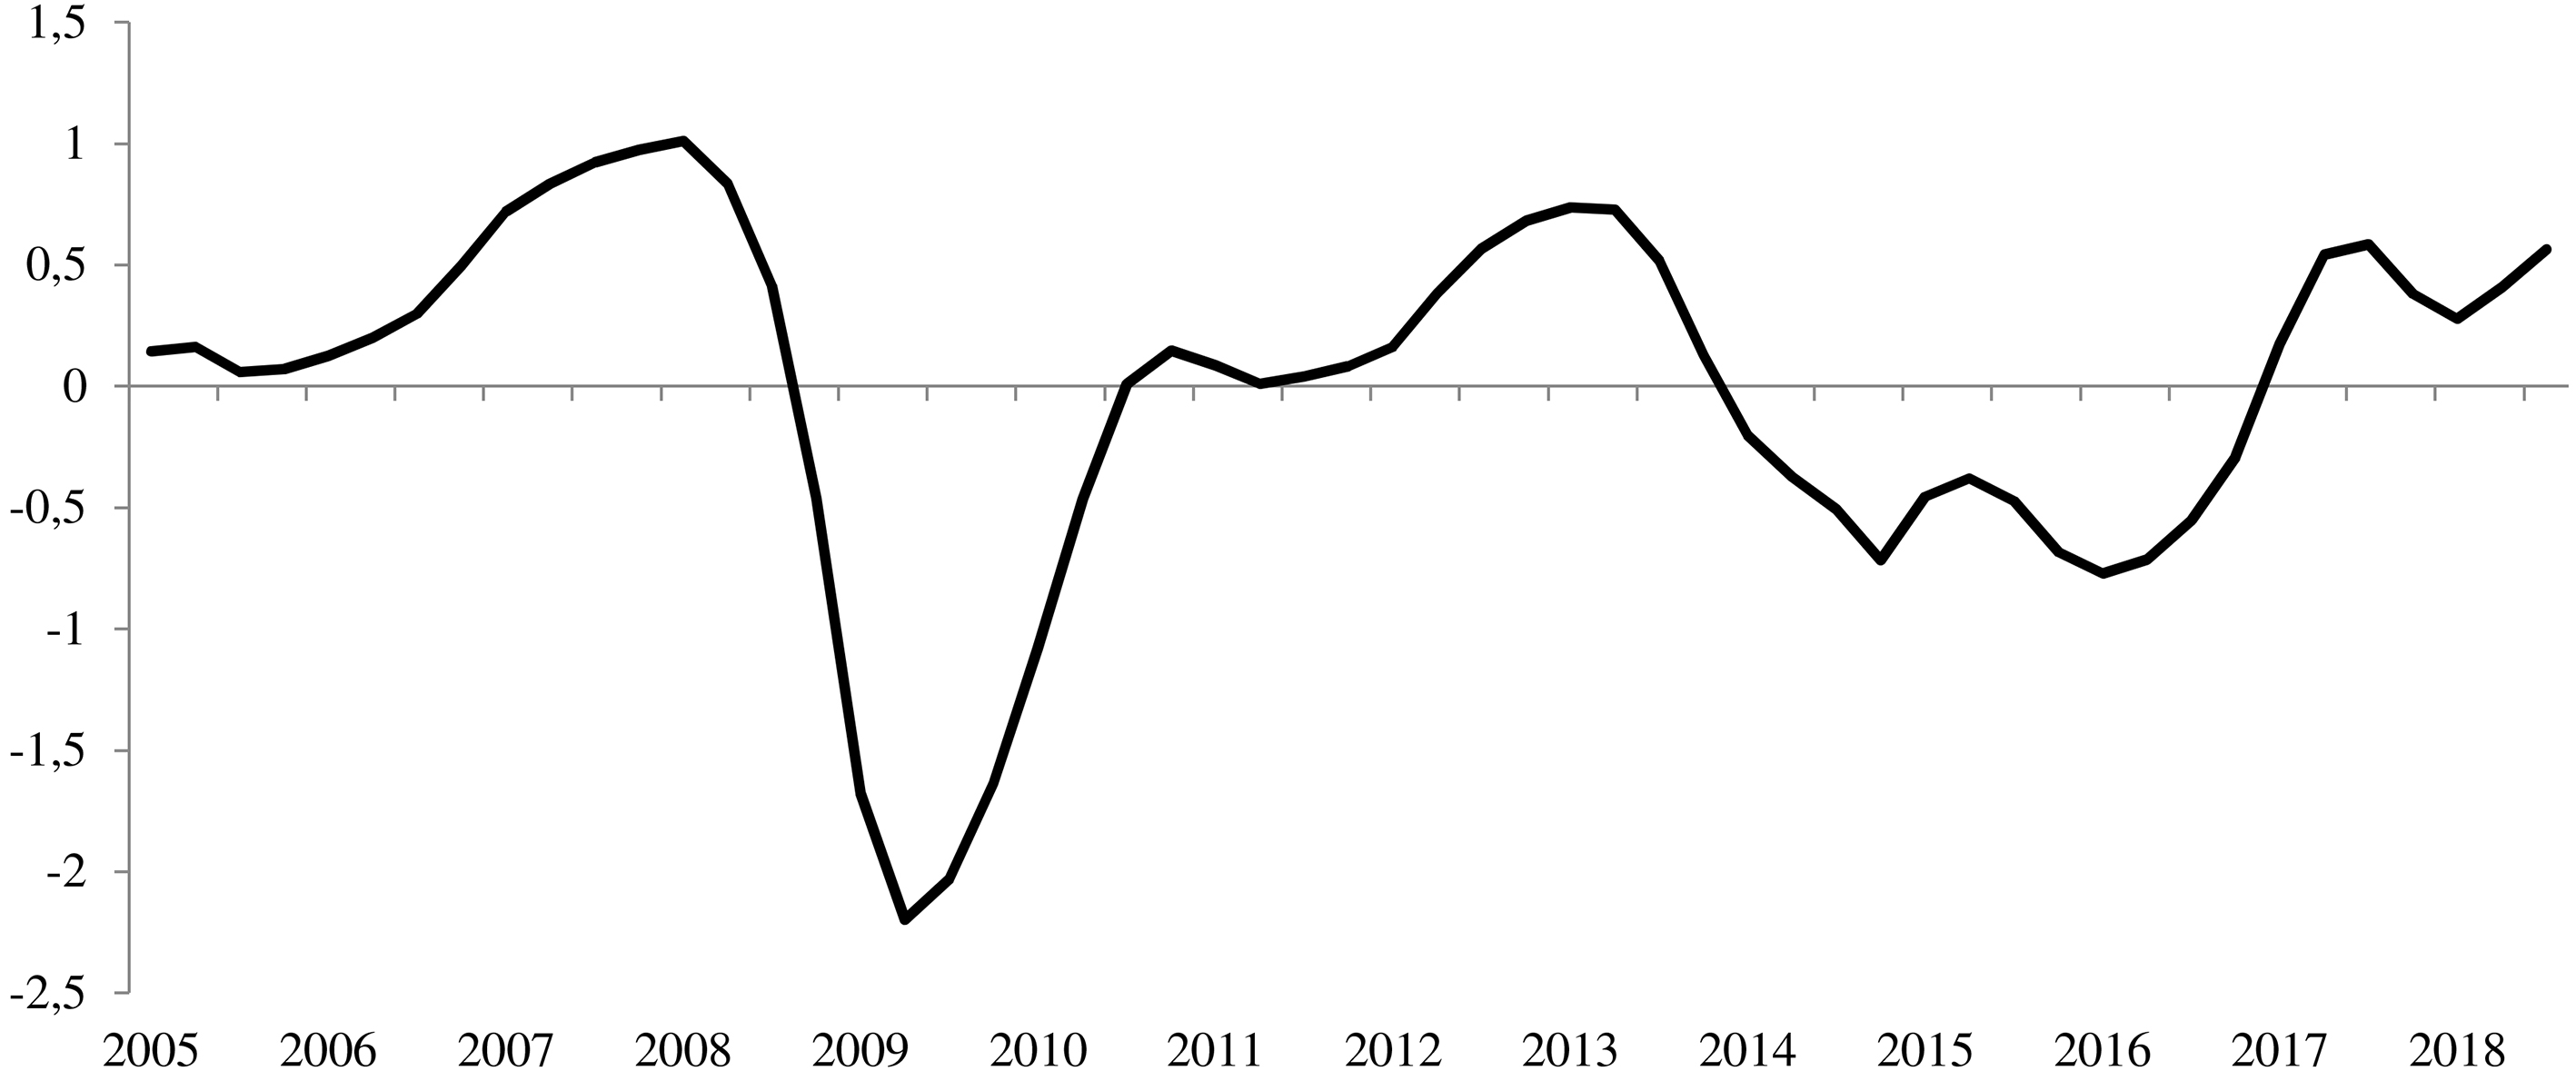
Thus, the results illustrate high adaptability of the suggested algorithm when it’s applied to a statistical array of qualitative, simple and composite SE indicators. Small businesses’ RMI dynamics were visualised by graphically representing them as a cyclicity tracer [11] (see Fig. 6), with levelled impact of medium-term trend (14 years) and the smoothed amplitude of 18 months (filter frequency
RMI cyclicity tracer.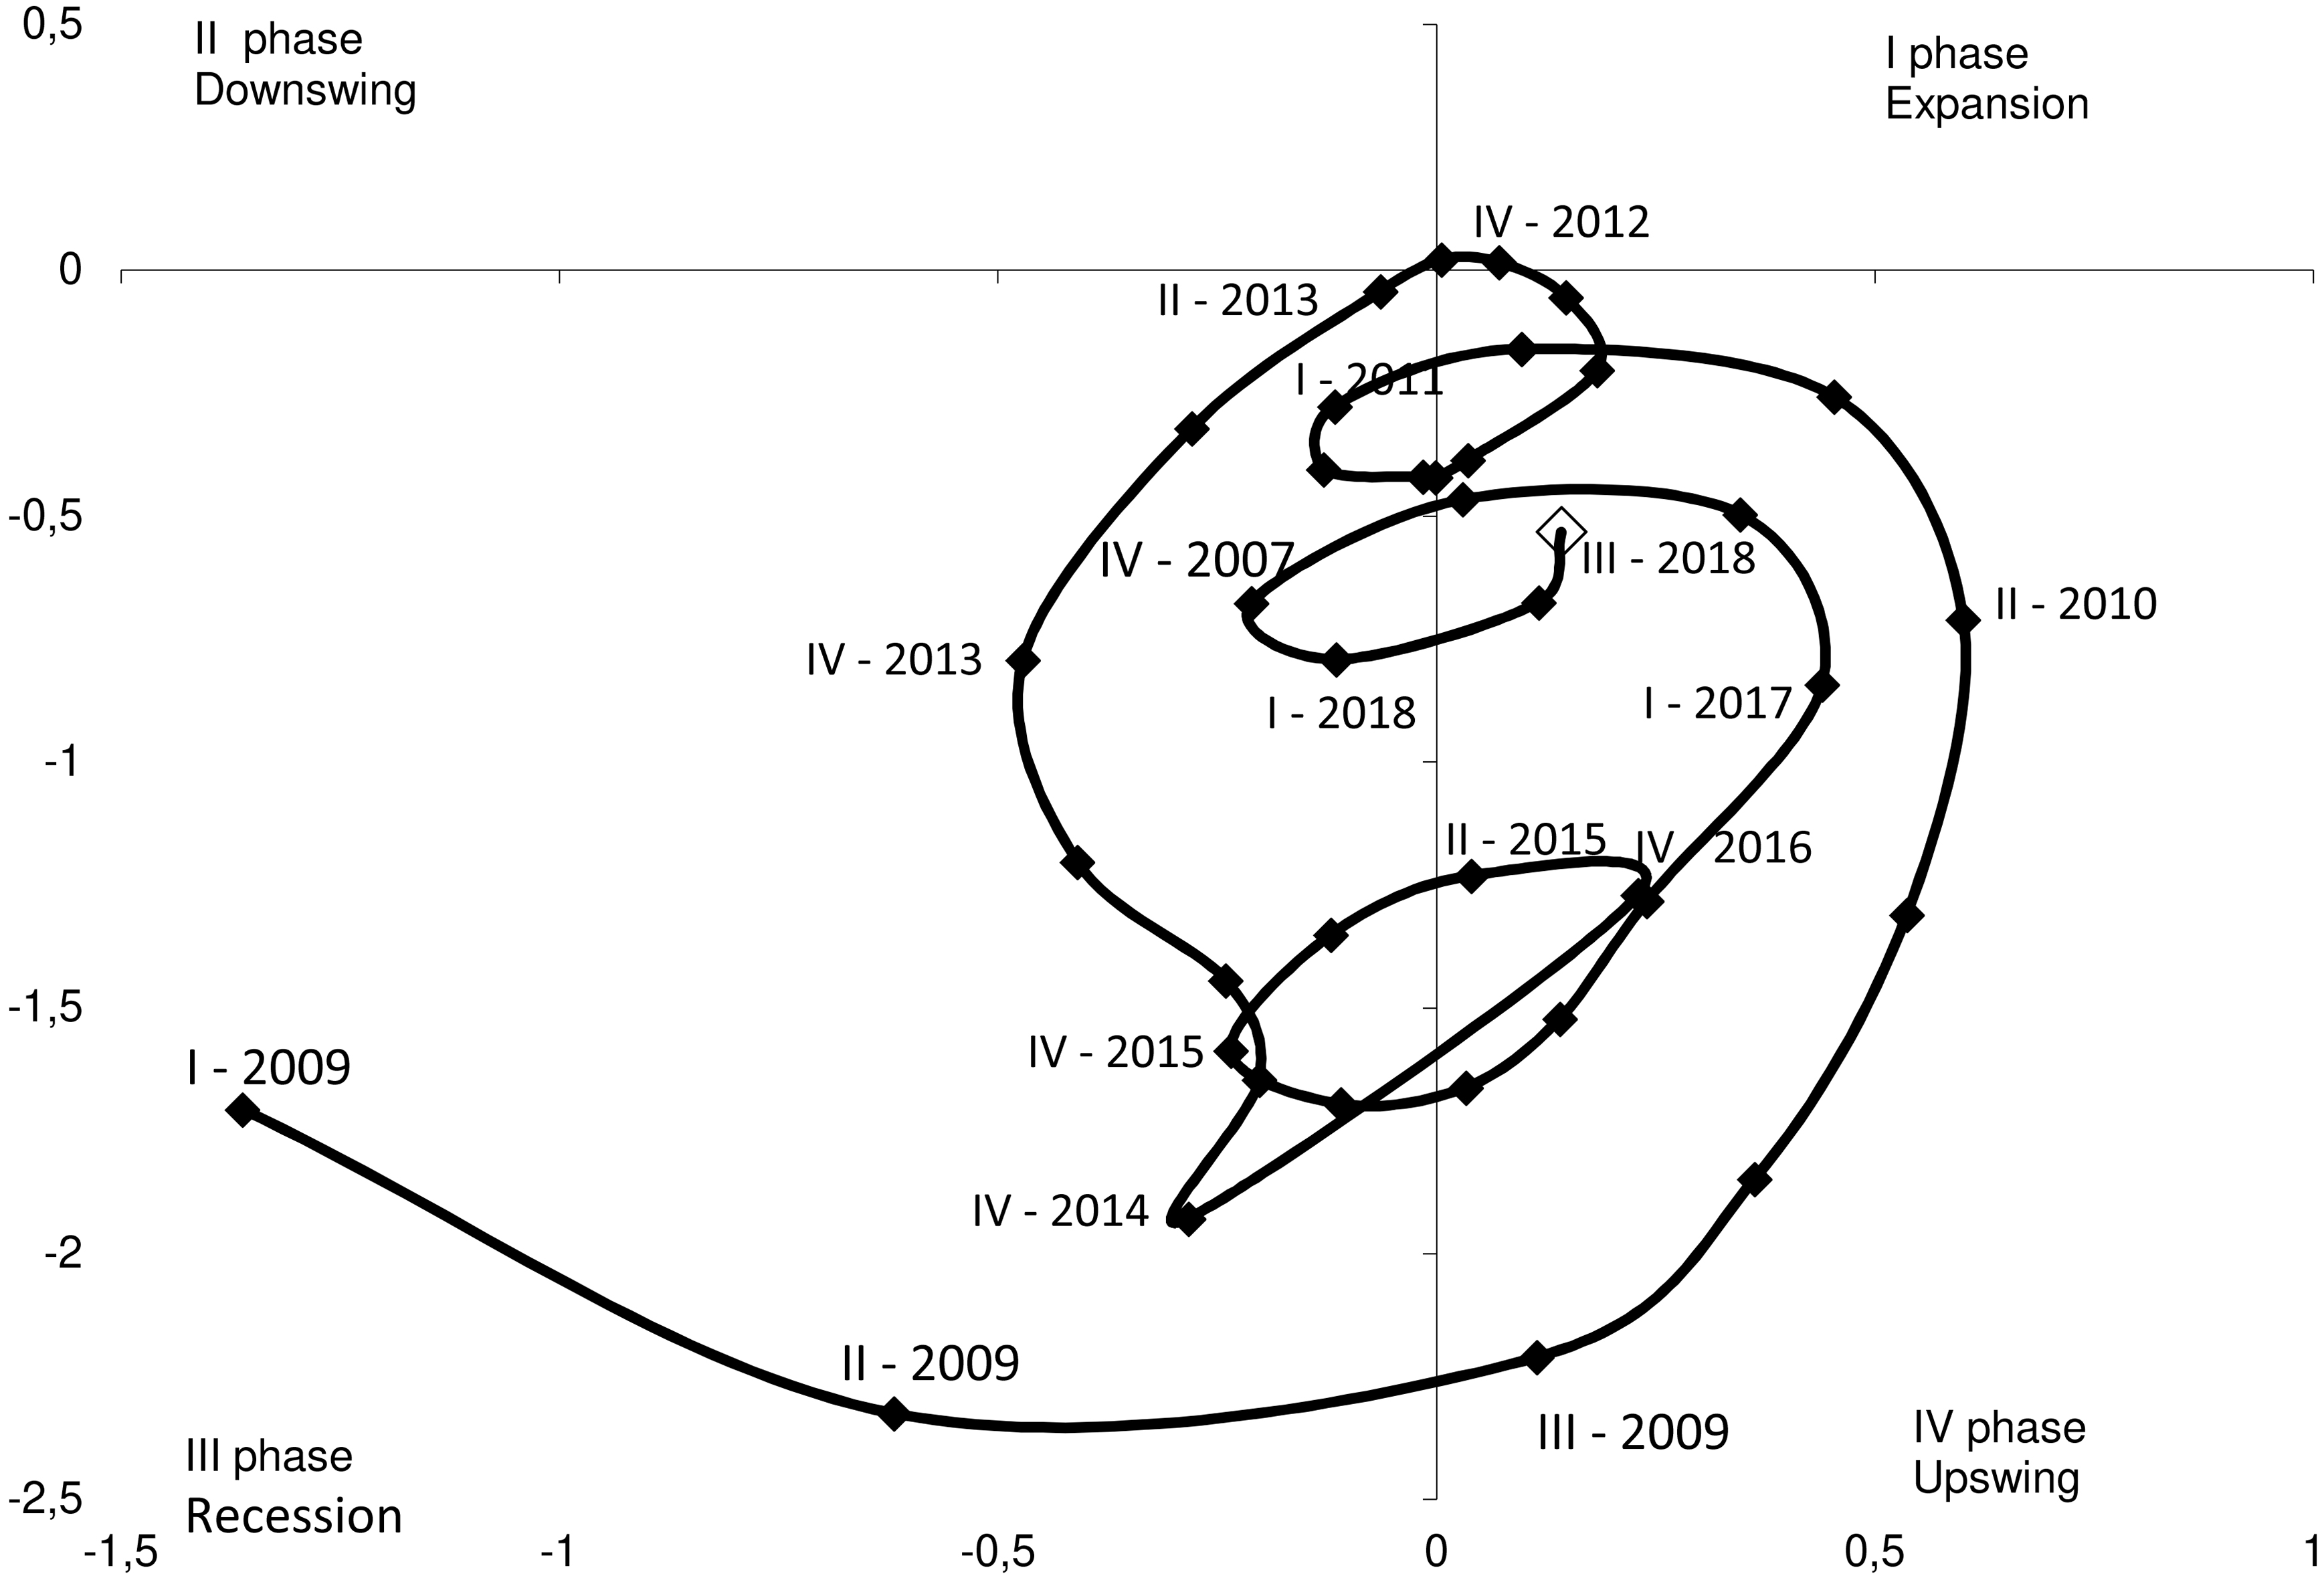
Combined dynamics Retail Business Potential Indicator (RBPI) values for small businesses and statistical reference – the Retail Turnover.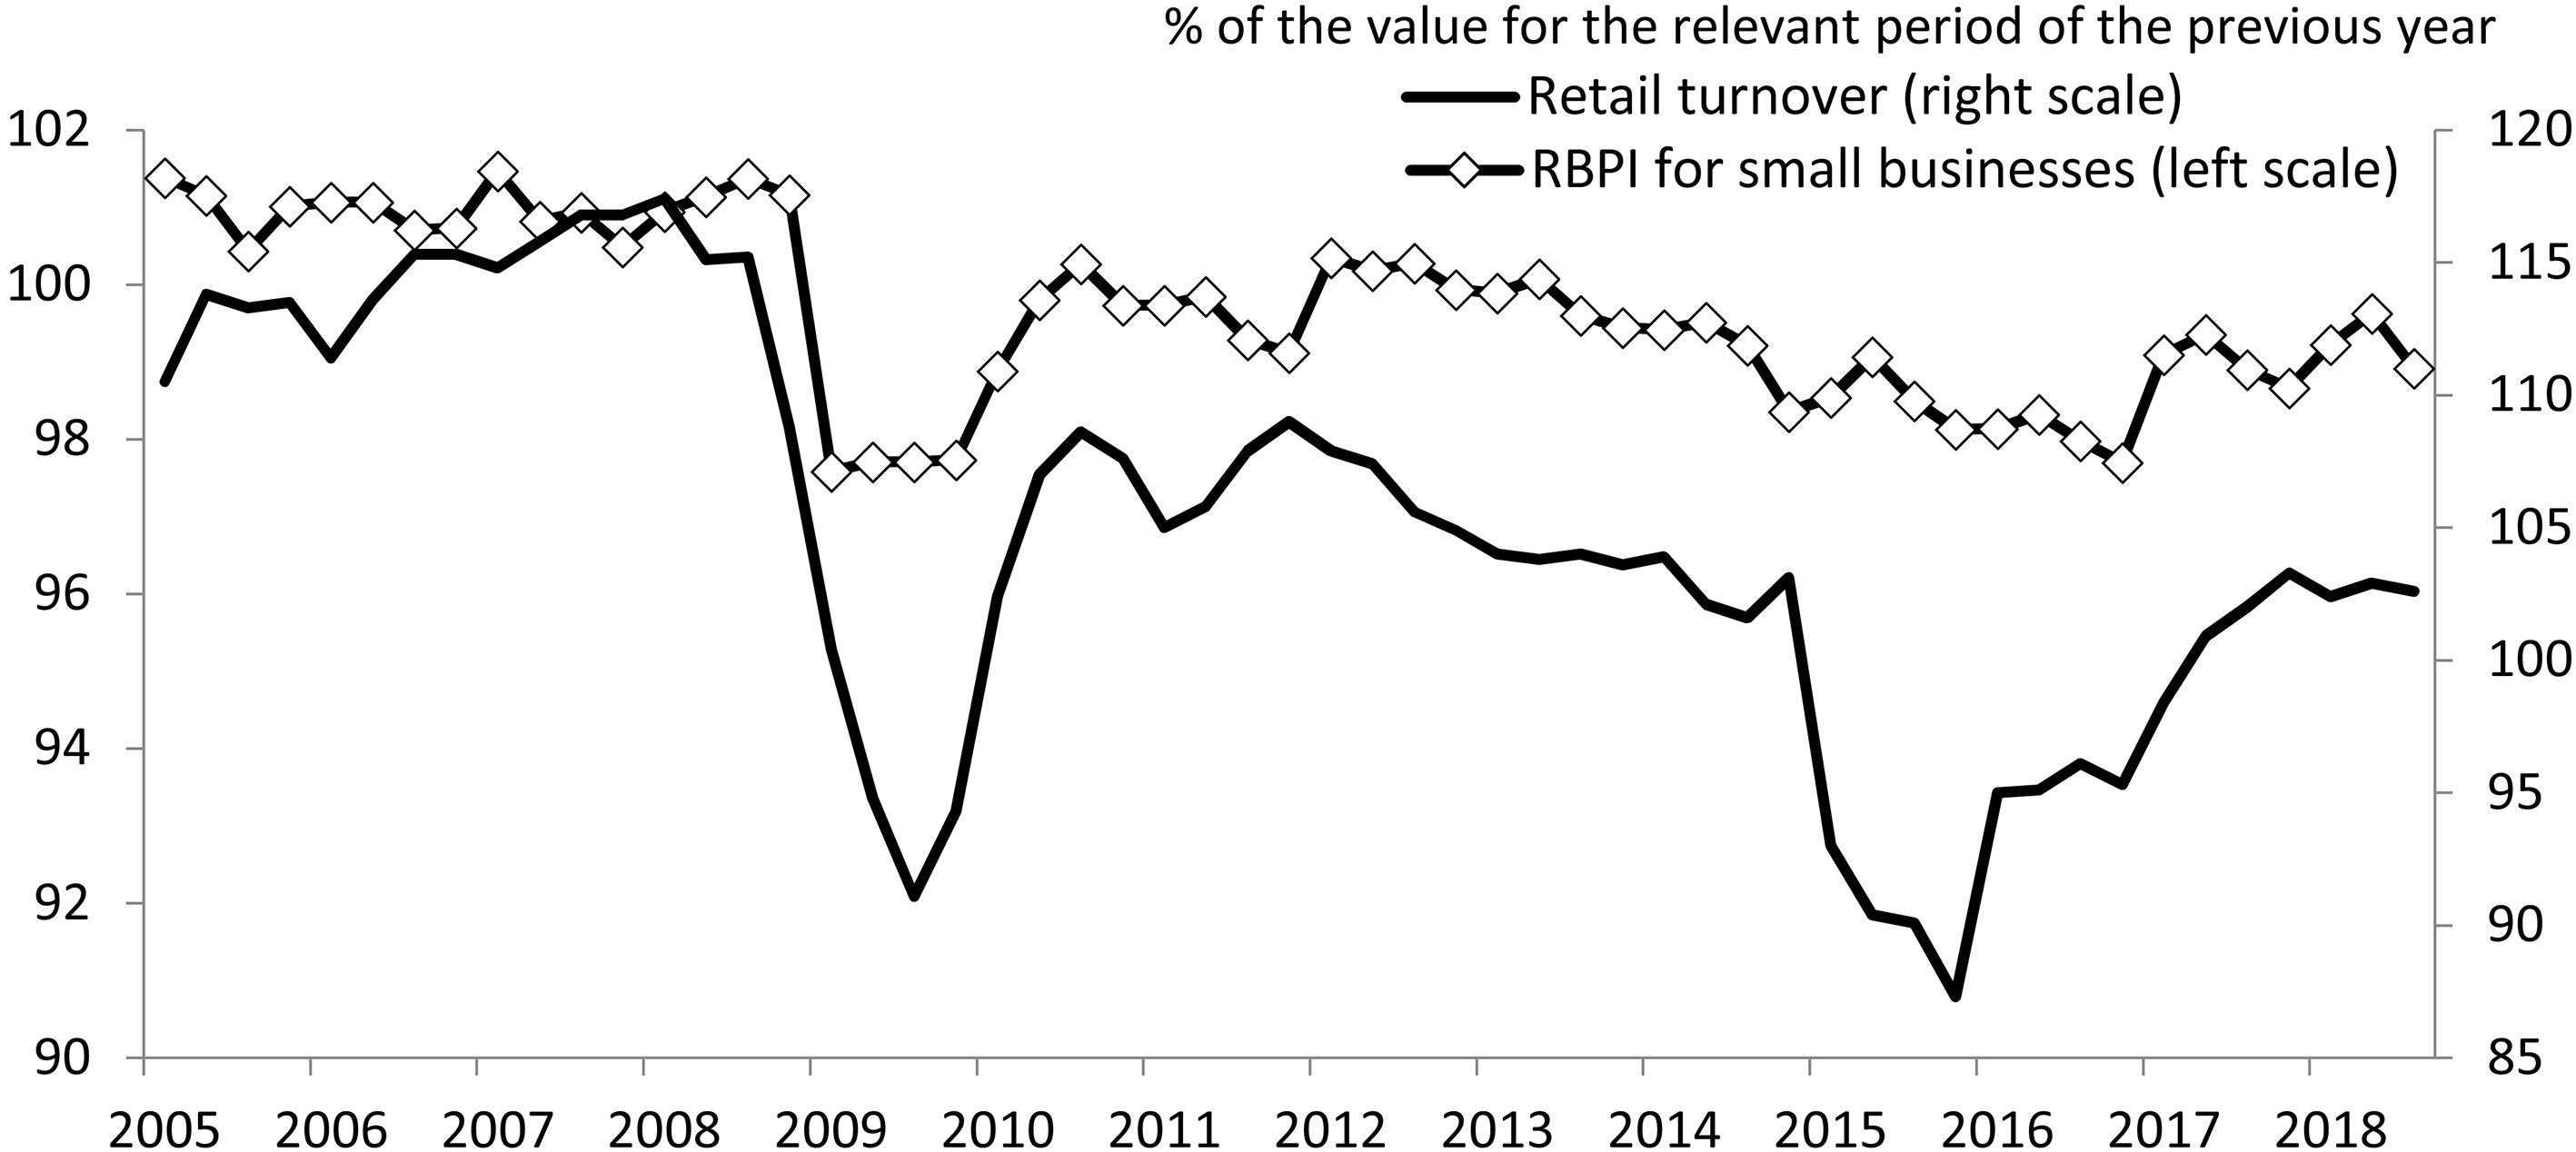
Visualization of the movement of a tracer of short-term cycles of RMI rather accurately reflects the development of branch tendencies, focusing attention on all phase nuances of business conditions during any period of functioning of the organizations. In particular, the greatest interest causes the cyclic development of RMI during the periods of the brightest business enterprise cycles covering crisis of 2009, the subsequent to it the post-crisis period of 2010–2012 and all course of the stagnatory and crisis scenario of 2013–2018.
Only since 2
Several reasons determined the need to design a business potential indicator (RBPI) with relevant measurement scope and characteristics. The most obvious of them was to extend analytical application of business conditions survey results for the retail sector, to more objectively assess its market situation. However, there is another equally important reason, which prompted development of the RBPI. It is the need to apply in the national statistical system an indicator capable of highly accurately measuring small retail companies’ potential by integrating a number of specific metrics, which would reflect not just actual current changes, but also expected trends. In the context of measurement, “potential” means the segment’s hidden modes that, even if they remain latent, are capable of producing new drivers for, and promoting further growth of small retail companies. Such measuring capability was achieved for the CI by its fine adjustment through careful selection of its components, and due to unique prognostic potential of business conditions surveys, which in turn was due to the latter producing, among other results, short-term entrepreneurial predictive estimates (the survey questionnaire allows company managers to report expected performance indicator values for one quarter ahead).11
As business conditions monitoring practice shows, an important aspect of such surveys is application of forward-oriented indicators, due to entrepreneurs’ highly perceptive reaction to possible changes in relevant industries, e.g. the respondents’ predictive estimates have accurately forecasted the changes in small businesses’ performance indicators in 2014 and early 2015. Thus application of such indicator as an additional tool to analyse and measure small retail companies’ potential allows to more precisely visualise business landscape, and help make timely administrative decisions to strengthen small companies’ positions.
Taking into account specific features and economic principles affecting emergence of factors, which influence retail businesses’ operations, the range of candidate qualitative indicators was limited both conceptually, and in line with the results of calculations previously performed for the RMI indicator described above, to establish cross-correlation with the referent metric (retail turnover) (see Fig. 7 above). Accordingly, the selection process was based on economic considerations (maximising the potential index components’ information content), and on the available already processed data array. It is suggested to consider groups of indicators measuring business development potential using the following characteristics:
expected dynamics of product orders; existing and expected sales potential; financial and economic situation; existing investment opportunities; expected market competition.
In the end, performance indicators of small retail companies presented in Table 4 were selected for inclusion in the CI.
Small retail companies’ performance indicators selected for calculation of the RBPI
Small retail companies’ performance indicators selected for calculation of the RBPI
Source: composed by the author.
The next stage of statistical processing of the time series – potential RBPI components – included their seasonal adjustment. During the subsequent iteration, cross-correlational analysis of the candidate indicators and the quantitative statistical macro-aggregate Retail Turnover VI was conducted. The testing revealed a strong stable correlation between all such variables and retail turnover dynamics (Table 5). Cross-correlation coefficients between each of the preliminary selected indicators and the reference indicator were in excess of 0.65, which confirmed the expert-based metrics selection results and allowed to include these components in the CI. The konkur_ot variable was based on forward-oriented characteristics: with (
Results of testing indicators for their potential inclusion in the RBPI using cross-correlational function
Source: composed and calculated by the author.
Total dispersion of principal components (RBPI)
Source: composed and calculated by the author.
Therefore, it was decided to include the following 6 indicators in the RBPI:
expected changes of product orders; expected changes of their companies’ competitiveness; actual and expected changes in product range; actual changes of investments; availability of own financial resources.
This set of variables allows assessing small retail companies’ growth potential as accurately as possible. Each selected component to a certain extent describes their financial and economic capabilities and the scale of their strategic plans for the next quarter.
At the final stage, the abovementioned indicators were aggregated using the principal components analysis technique. Table 6 presents the sensitivity threshold and the cumulative percentage of data interpretation by principal components.
Results of graphic and cross-correlational comparison of the RBPI and the quantitative macroeconomic indicator (Retail Turnover VI) dynamics reveal a stable statistical relationship between these indicators, with a meaningful synchronous correlation (0.77), a one quarter lead, and a high cross-correlation coefficient (0.69).
RBPI medium-term cycle (MTC) and short-term unsmoothed amplitude cycle (STUC).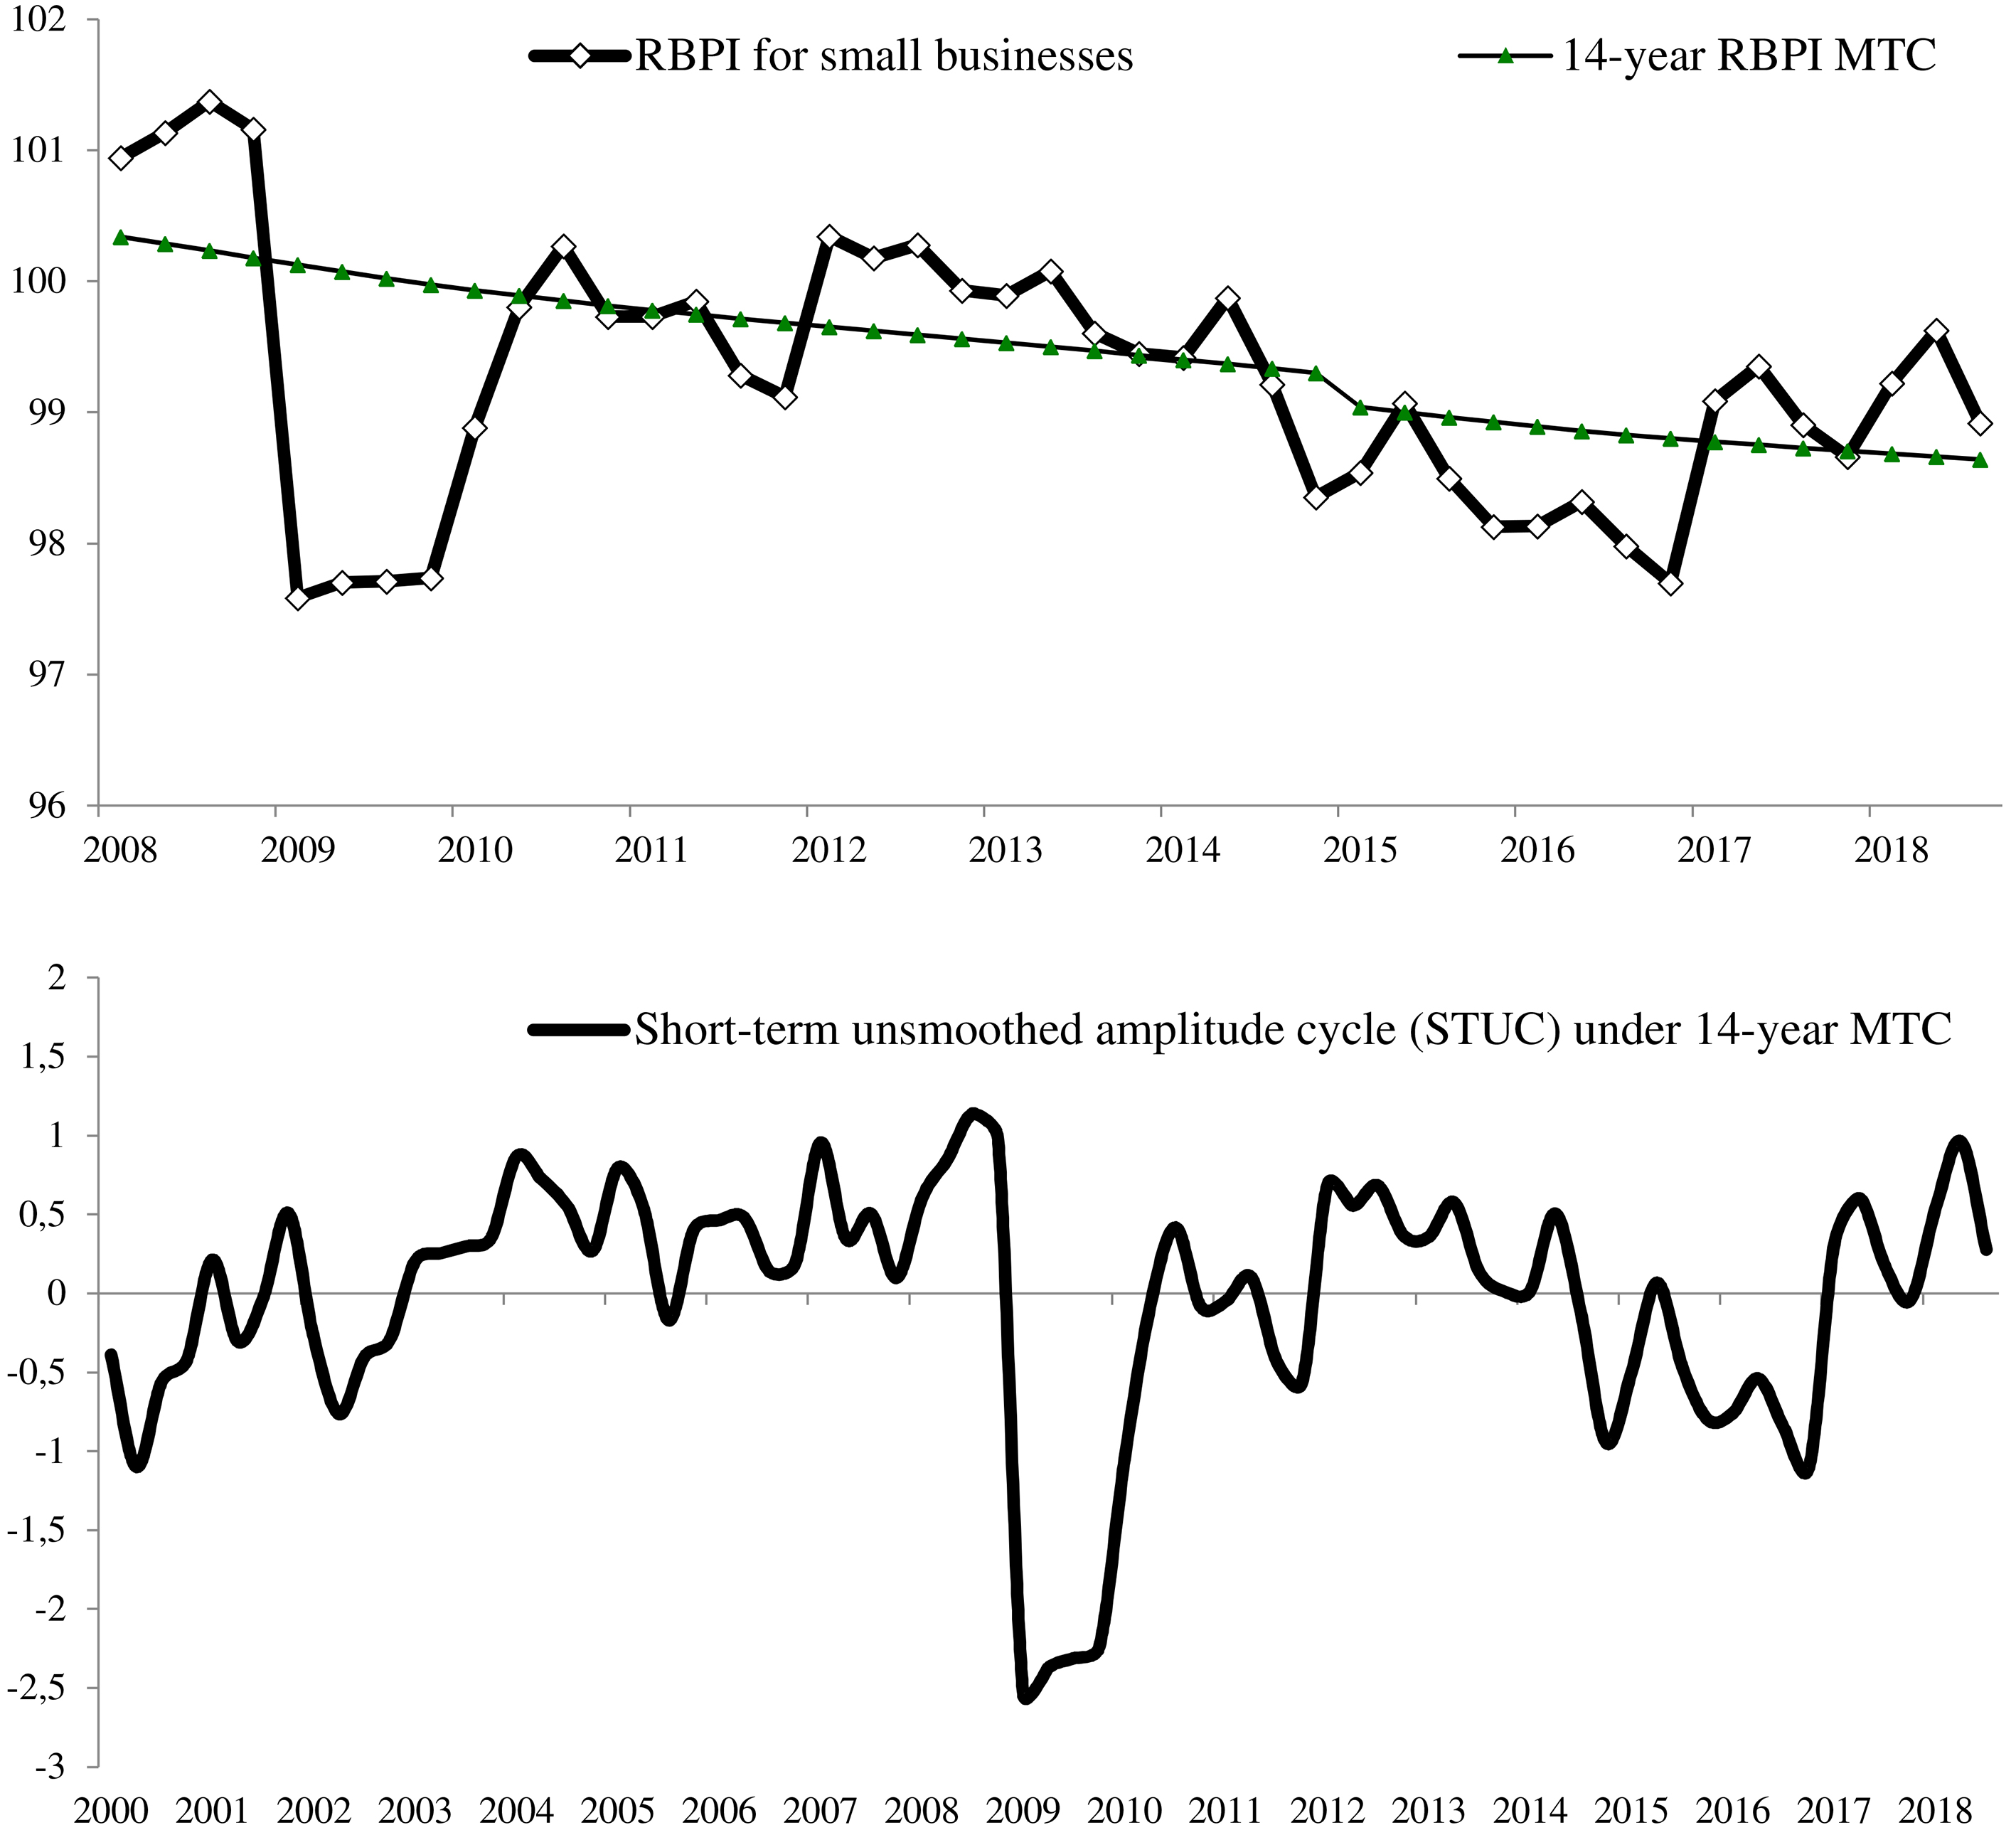
RBPI short-term smoothed amplitude cycles (STSC).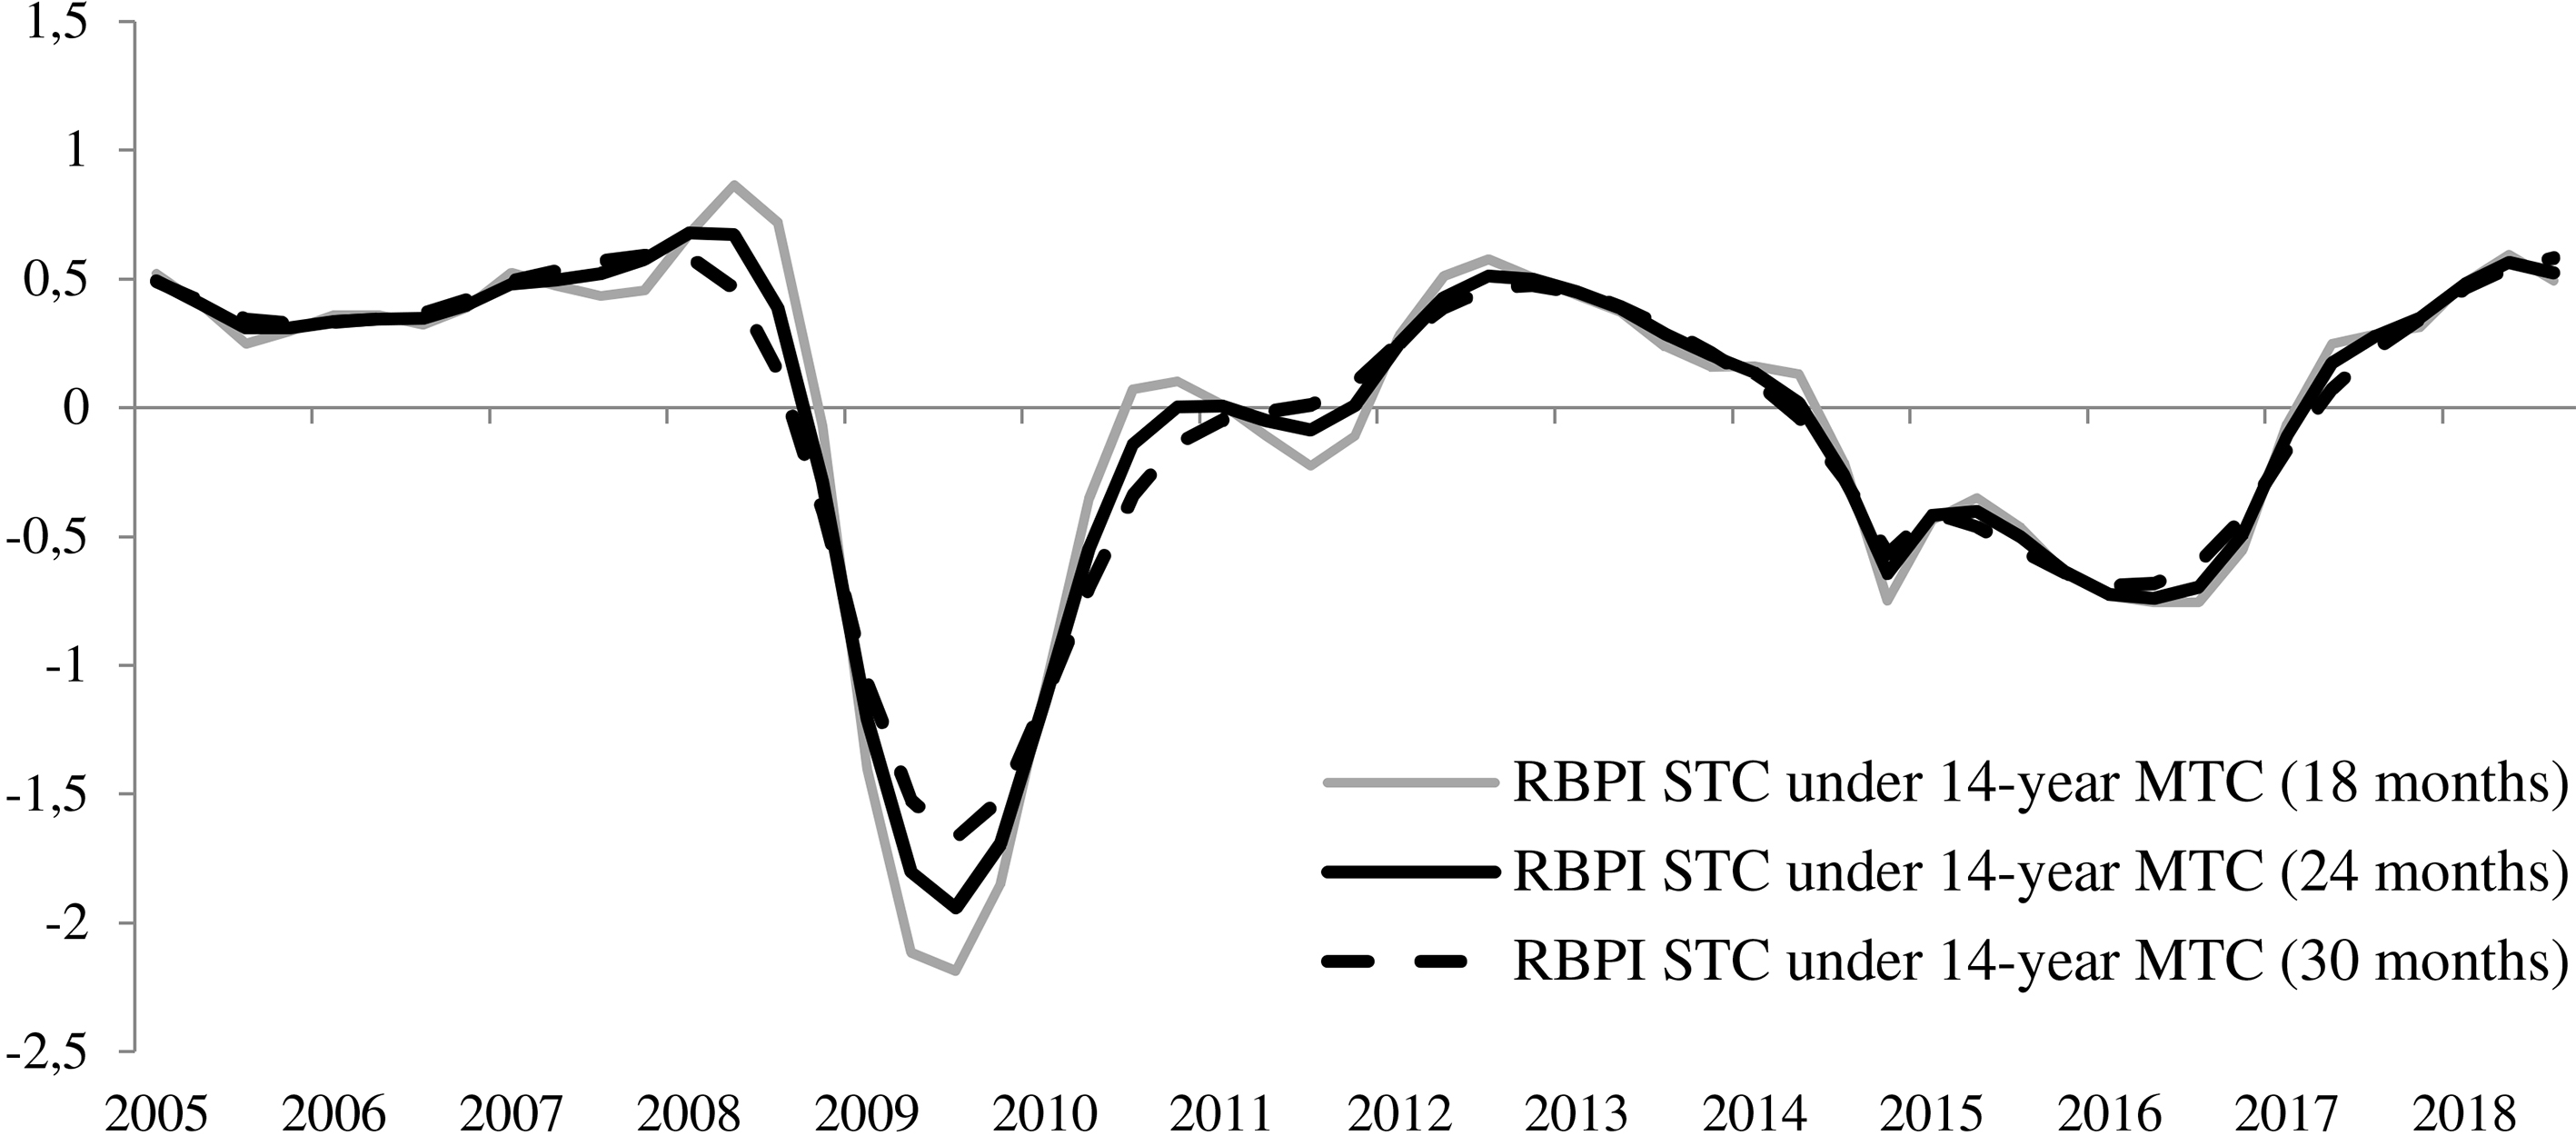
RBPI Smoothed short-term cycle (STSC) under 14-year STC (18 months).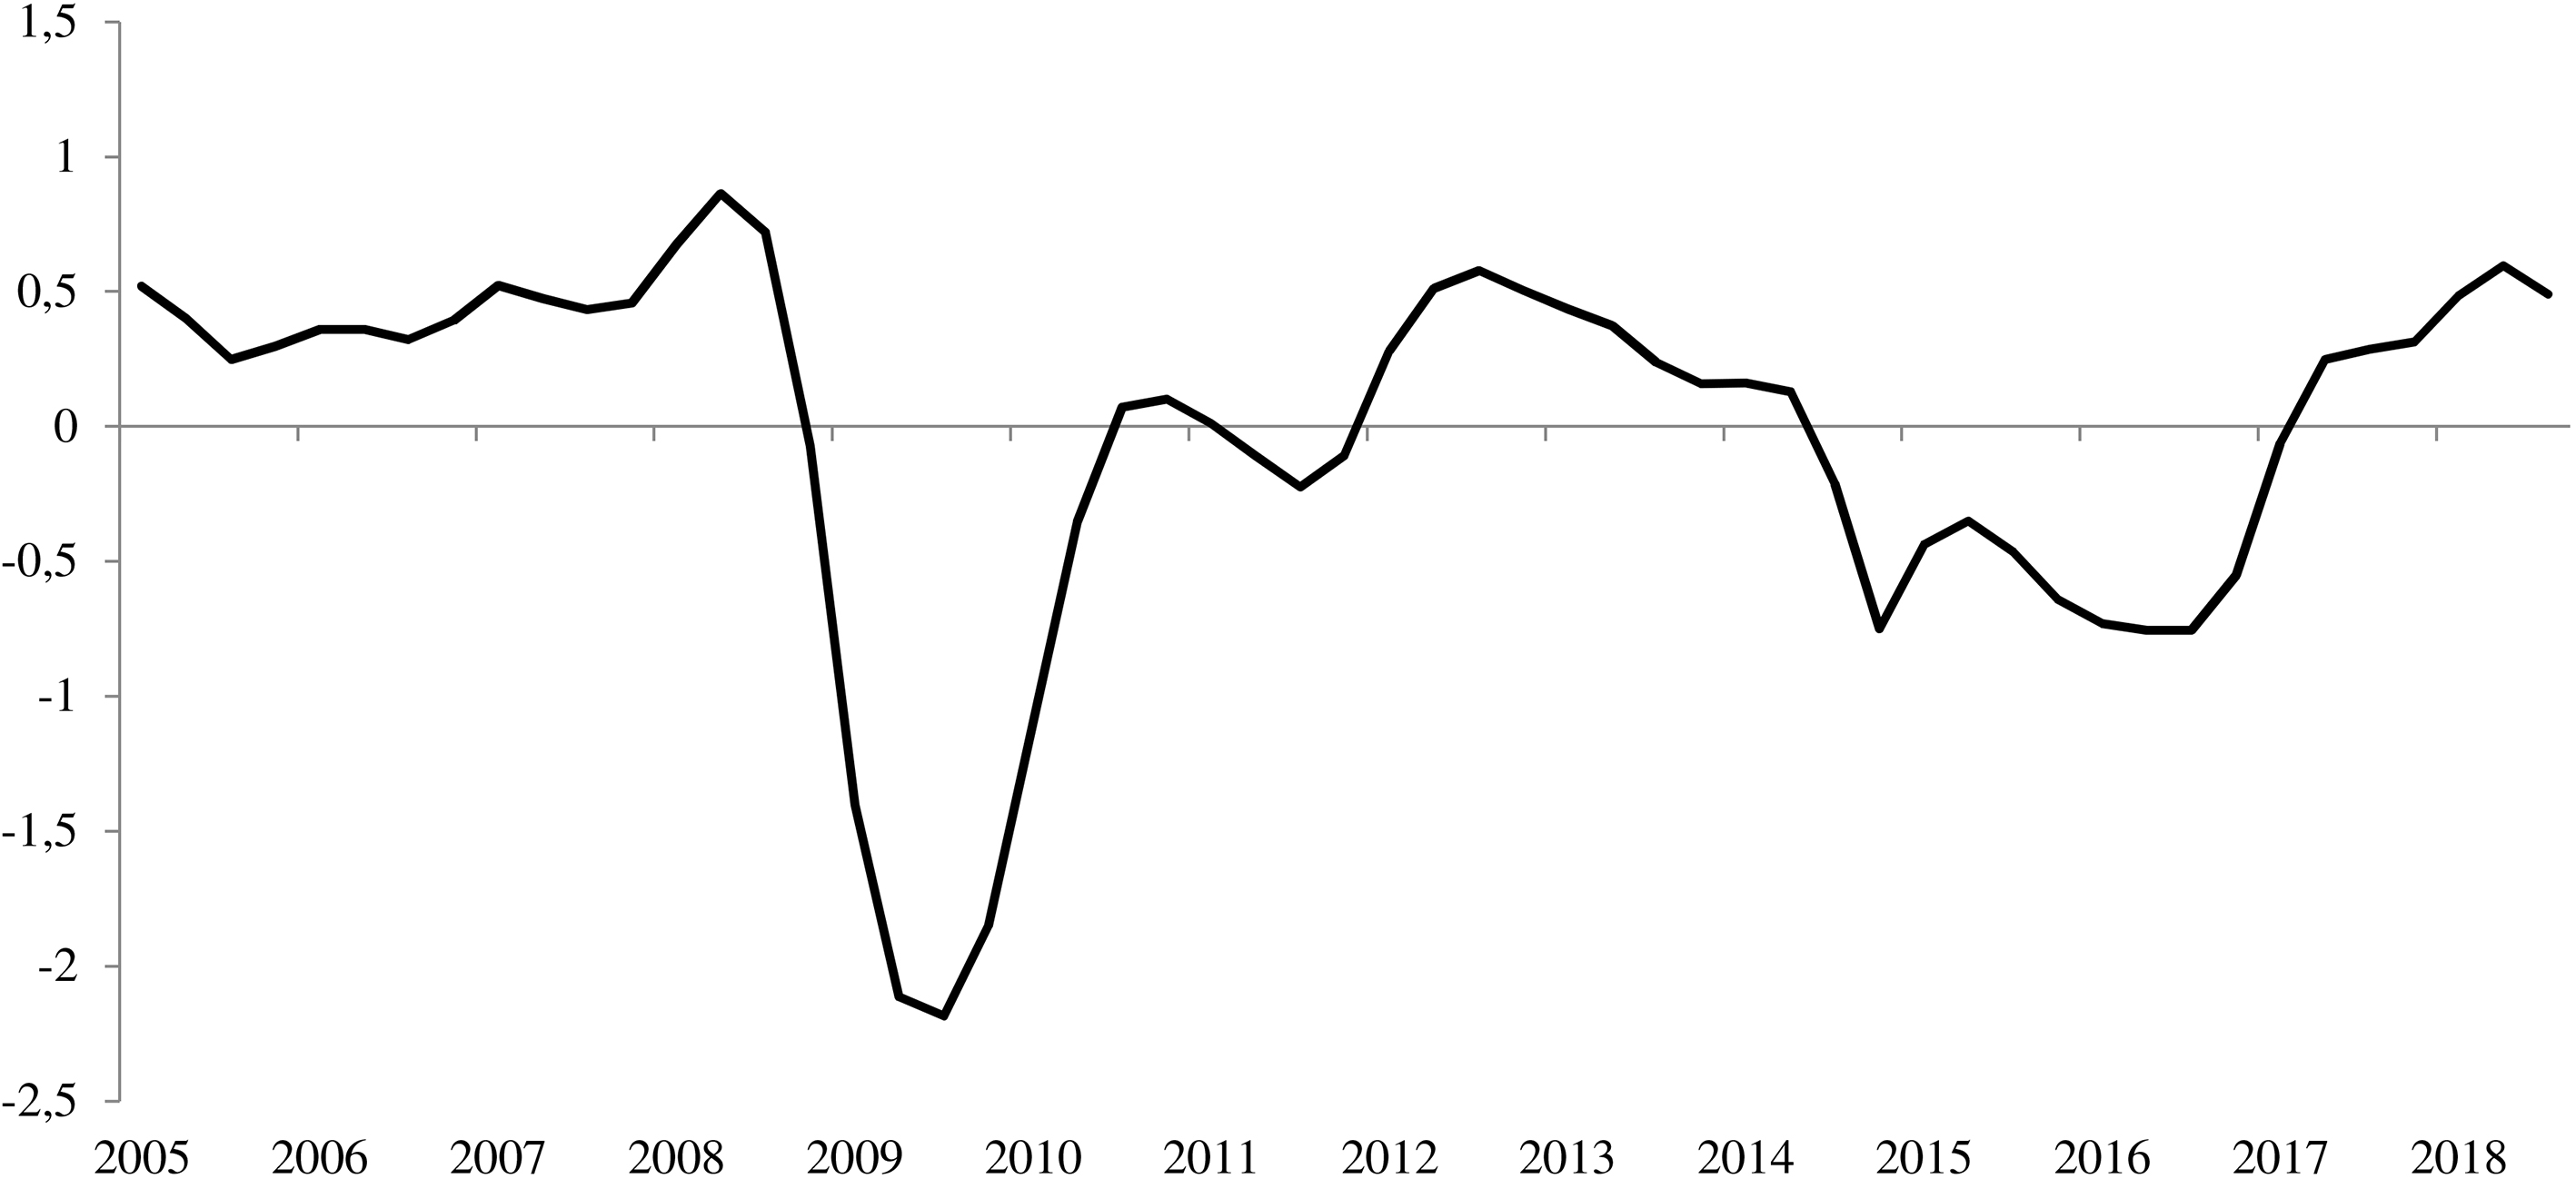
RBPI cyclicity tracer.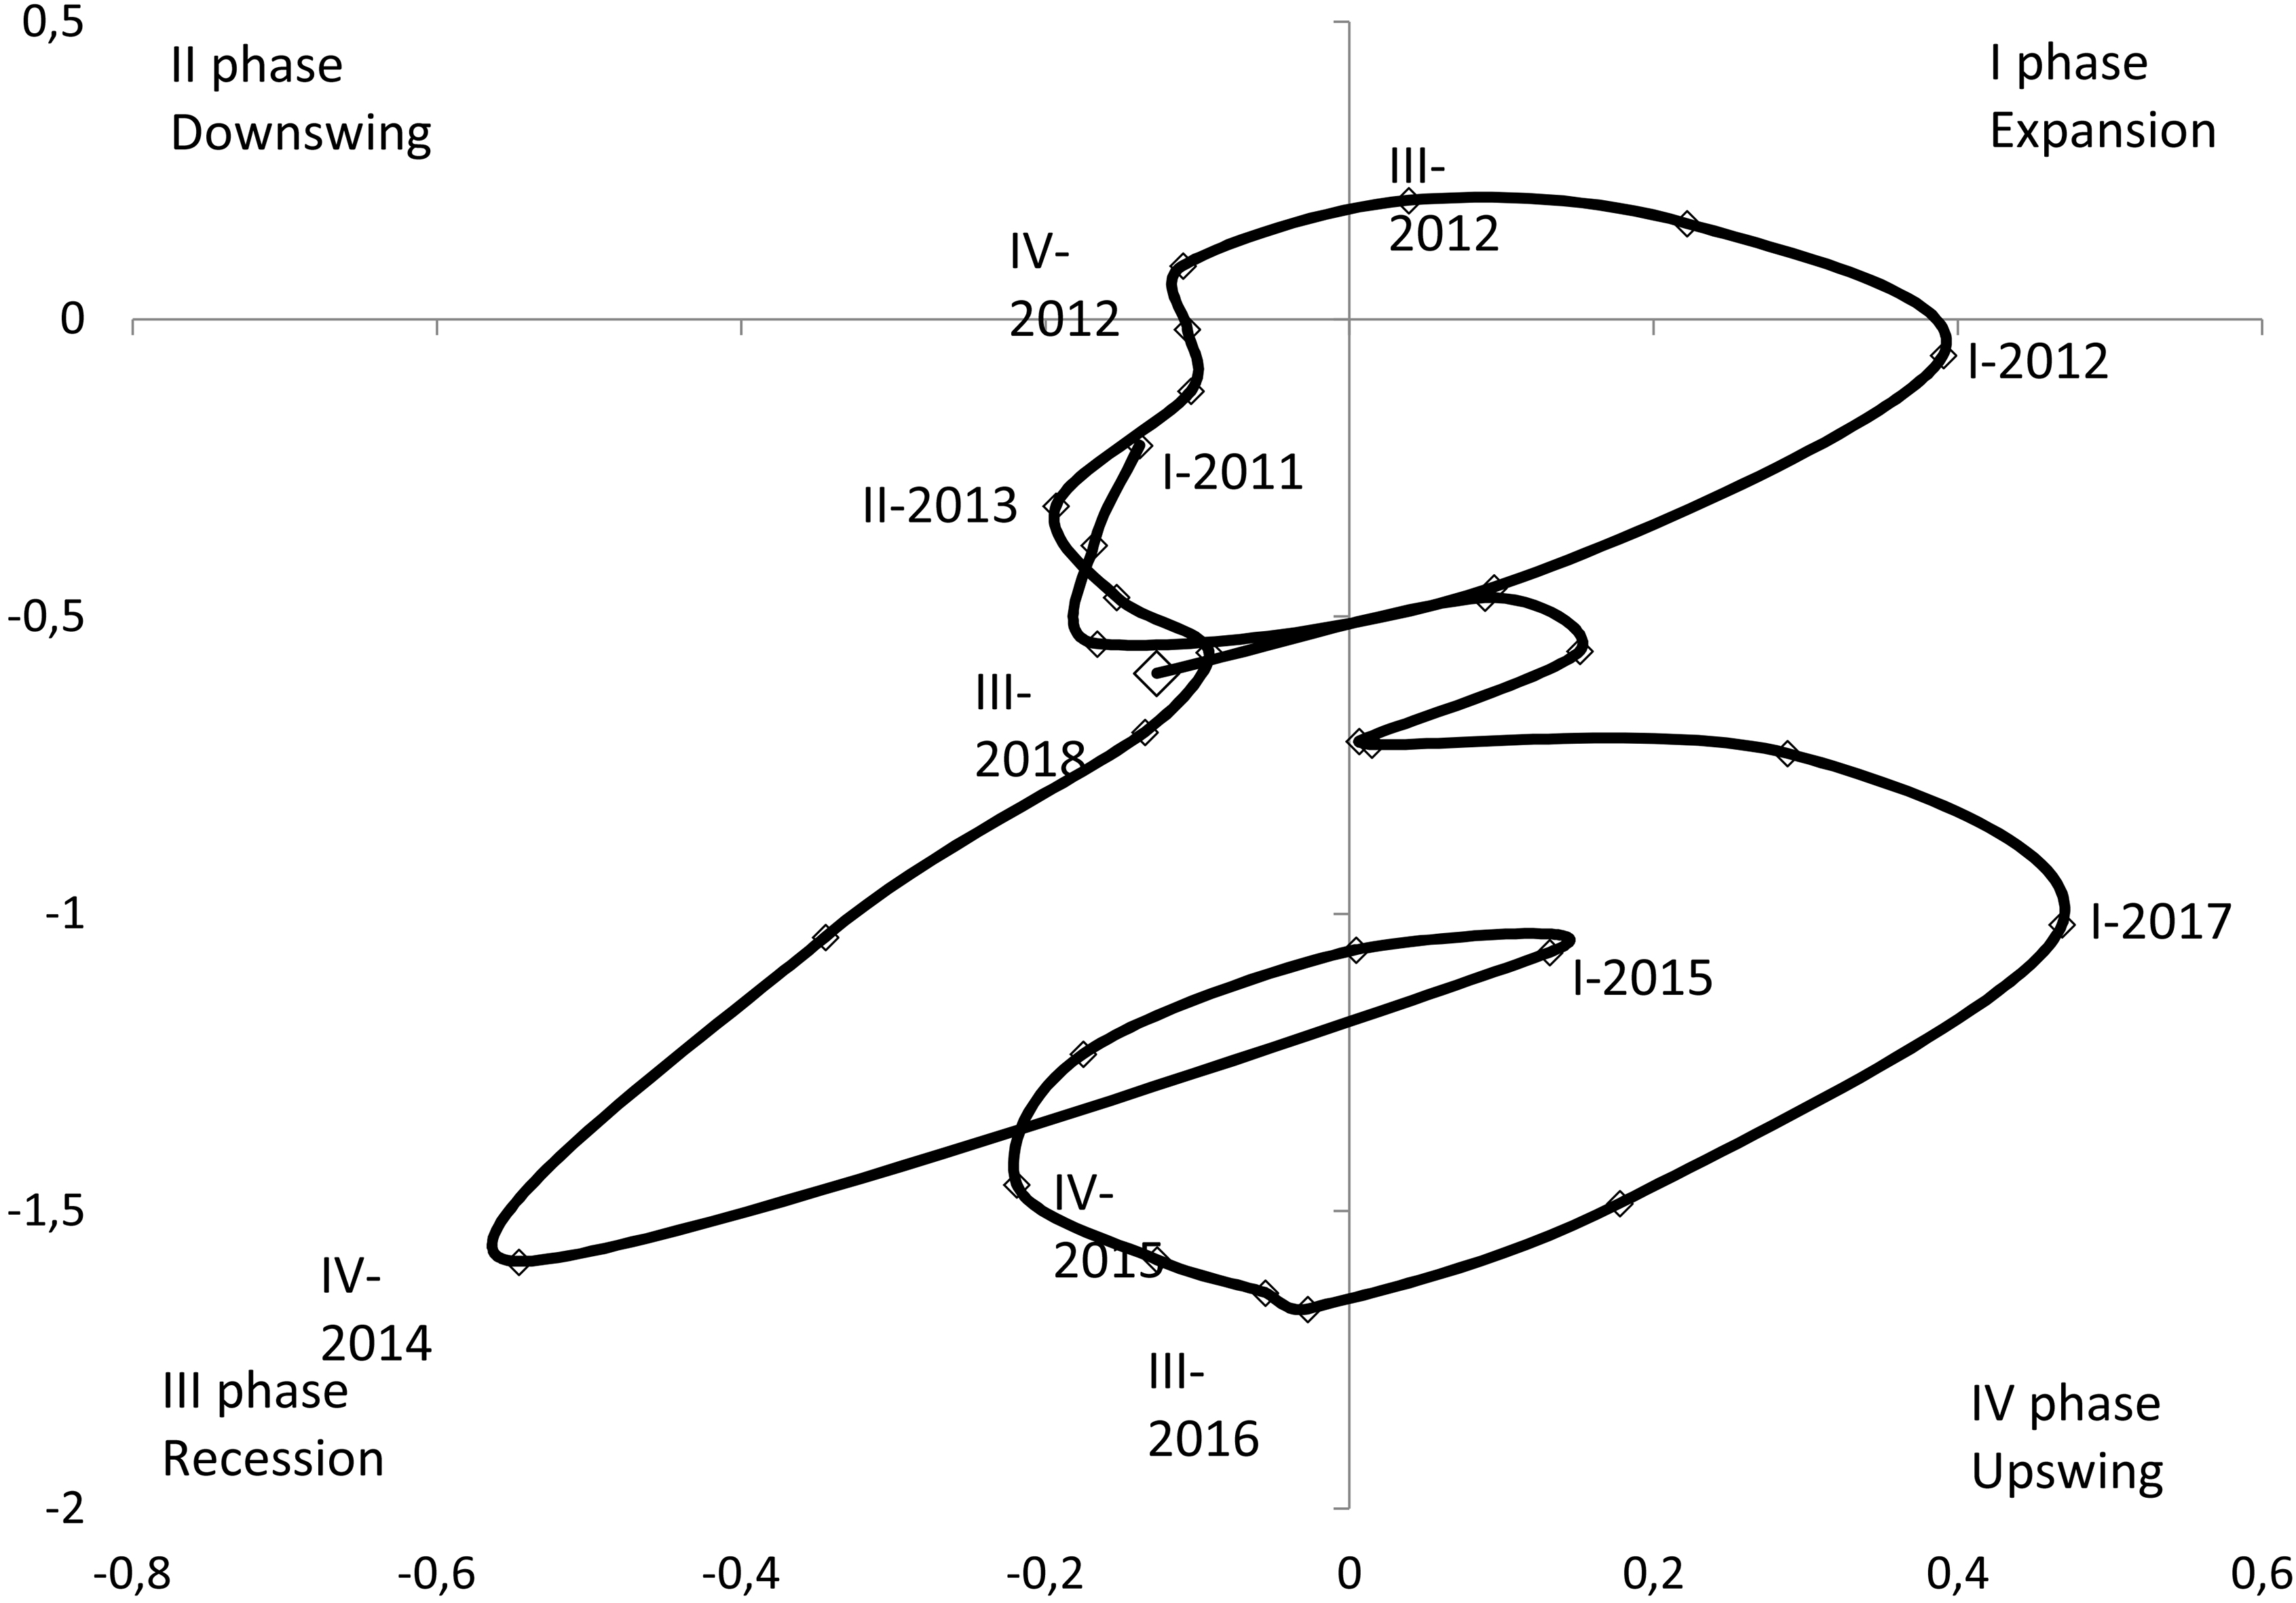
Next iteration involved analysis of small companies’ RBPI cyclic profile. Taking into account specific features and periodisation of the available results of business conditions surveys of small retail companies, the RBPI’s cyclic component was analysed by identifying a 14-year medium-term cycle (MTC) and selecting between 18, 24, and 30-month short-term cycles (STC).14
Decomposing RBPI by applying the HP filter with
Subsequent cyclic indication amounted to selecting short-term cycles with excluded 18-, 24-, and 30-month cycles. Accordingly, the second application of the filter with
Combined cross-correlational analysis with initial dynamics revealed a statistically significant and persistent short-term cycle. E.g. between the 1st quarter of 2000 and the 4th quarter of 2014 the 1.5-year cyclic interval became the most obvious, if the effect of the 14-year cycle was eliminated (see Fig. 10).
This is due to the prevailing cross-correlation result between RBPI STSC 18 months, with excluded 14-year cycle (0.88). Correlation coefficients smoothed with 24- and 30-month amplitudes amounted to 0.86 and 0.83, respectively. Graphic representation as a cyclicity tracer (see Fig. 11) with levelled impact of the medium-tern trend (14 years) and smoothed 18-month amplitude (filter frequency
Graphic representation of the RBPI cyclic component illustrates the nature of business trends affecting small retail companies’ potential in various market development phases.
Enterprise potential which entrepreneurs in 2018 have, does not allow hoping for fast recovery. The movement of a tracer after the first quarter of 2017 demonstrates the gradual immersion of retail firms in a condition of stagnation. During 2018, cyclic development of RBPI happened in a recession quadrant. Besides, the direction of the movement of a tracer in the III quarter of 2018 accurately indicates its removal from rise border.
Considering high sensitivity of the indicator to the current and future business conditions changes, forward compensation restoration in branch should not be expected in the next and at least the first half of 2019.
The paper presents a tested methodology, which extends the existing statistical practices’ potential for studying industry-level small entrepreneurship tendencies through business surveys. Increased attention to this knowledge area is an important condition of successful development of national economies, as demonstrated by numerous relevant studies conducted in a wide range of countries. The structured review conducted in the scope of the study revealed a quickly growing interest to studying entrepreneurship, both conceptually and empirically.
Specifically, the following business conditions indicators were developed and tested: Retail Market Indicator (RMI) and Retail Business Potential Indicator (RBPI). The proposed indicators are aimed at quickly identifying current tendencies in the retail business, which, together with the quantitative parameters of the market, increase the scale of representation of the actual and expected phase of economic development of trade and the associated consumer market. The technique was successfully tested to measure the business conditions of Russian organizations in the retail business, over the period 2005–2018.
During particularly bright cyclic episodes, shaping anti-crisis policies, making political decisions aimed at stabilising the situation and promoting economic growth in an acutely unstable business environment requires a more thorough interpretation of statistical data. All of the proposed CIs were proved to accurately reflect retrospective and current dynamics of the major economic macro-aggregate indicator, the retail turnover volume index (VI). This allows considering the CIs as relevant and reliable empirical data sources.
The paper also addresses the issue of obtaining a more detailed picture of economic development based on the use of tracers, which allow clearly visualising cyclic profiles of the proposed CIs. The empirical results confirm that the proposed indicators are highly informative, and illustrate suitability of these statistical tools for in-depth industry-level analysis.
Still, further research is required. In particular, given the wide scope and numerous aspects of retail industry as a multifaceted economic phenomenon, measuring business climate using just one, or even several indicators cannot reflect the full range and specific features of industry-level trends accurately enough. Multiple and close ties between various components of retail processes require to design more CIs in addition to the ones presented in the paper, e.g. to measure and interpret such important aspects of countries’ economic systems as competitiveness, investment and innovation activities. Obtaining relevant estimates would help to identify important extensive and intensive factors affecting organisations’ growth, and provide reference points for making legal or political decisions aimed at supporting and optimising entrepreneurial activities.
For example, designing, and implementing in the statistical practices an indicator of small retail companies’ competitiveness (IRCC) based on the proposed methodology would help to extend analytical visualisation of the segment, by measuring the following aspects:
efficiency of retail processes, and entrepreneurs’ adaptability to various business conditions; current and potential growth based on adopting new development strategies; willingness to apply new technologies and innovations; organisations’ ability to compete with similar products/services, taking into account the immediate impact of external and internal business environment factors; economic agents’ adaptability to external shocks.
At the same time factors such as companies’ investment activities (and as a consequence, their innovation and technological potentials) were traditionally viewed through the prism of increasing competitiveness. Upgrading their resource basis and acquiring relevant assets (which amounts to making multifaceted investments) are among major issues for small companies, and they remain relevant at all stages of their development. Given the current stage of the Russian market economy, investments provide an additional boost for economic growth, and strengthen companies’ potential and competitiveness. In particular, investing covers a number of growth points important for the retail industry:
application of innovations and technologies; development of new marketing models; market positioning; increased opportunities for companies to stand out among competitors; extending target market segments and customer groups; diversification into new markets with new products and new sales formats; job creation, development of human potential; reduced costs.
Prospects for further research in this area include extending the proposed methodology for measuring business conditions over other small entrepreneurship segments not covered by this study. The results can be applied in the course of technology transfer in the scope of the international research communications system, to contribute to applied research and further studies of small entrepreneurship development tendencies based on using non-quantitative statistical data, and for designing various industry-specific CIs.
Footnotes
Companies employing 16–100 people are considered small enterprises.
About 5 thousand respondents participate in online surveys. Regardless of their economic activity, the index includes the following basic components: employment, revenues, and entrepreneurs’ trust.
US, Canada, Germany, Austria, Sweden, France, Ireland, Spain, Portugal, Poland, Malaysia, Singpore, Brazil, Australia, Marocco, and Tunisia.
The indicator is calculated by the Markit Economics company jointly with the ADACI association (Associazione Italiana Acquisti e Supply Management).
Developed in the scope of research by the China International Cooperation Association of Small and Medium Enterprises; the sample includes more than 20,000 companies.
The GEM project is currently the largest entrepreneurship study in terms of the number of observations: 197,000 respondents and 3,800 experts on entrepreneurship participated in the survey in 2013. Russia is represented by the St. Petersburg State University Higher School of Management and the National Research University Higher School of Economics (Moscow) teams.
The balance of opinions as the difference between positive and negative answering options measured as percentage points of total answers.
The parameter
Metrics for inclusion in this indicator were selected based on the national statistical observation form N1-business conditions “Survey of business conditions and business activities in the retail sector”.
Results of small businesses’ sampling observations in the study are presented as time series dynamics for the period between 2005–2018, which did not allow identifying a classic long-term cycle.
Acknowledgments
The article was prepared within the framework of the Basic Research Program at the National Research University Higher School of Economics (HSE) and supported within the framework of a subsidy by the Russian Academic Excellence Project ‘5–100’.