



Abstract
The National Center for Health Statistics is assessing the usefulness of recruited web panels in multiple research areas. One research area examines the use of close-ended probe questions and split-panel experiments for evaluating question-response patterns. Another research area is the development of statistical methodology to leverage the strength of national survey data to evaluate, and possibly improve, health estimates from recruited panels. Recruited web panels, with their lower cost and faster production cycle, in combination with established population health surveys, may be useful for some purposes for statistical agencies. Our initial results indicate that web survey data from a recruited panel can be used for question evaluation studies without affecting other survey content. However, the success of these data to provide estimates that align with those from large national surveys will depend on many factors, including further understanding of design features of the recruited panel (e.g. coverage and mode effects), the statistical methods and covariates used to obtain the original and adjusted weights, and the health outcomes of interest.
Introduction
The National Center for Health Statistics (NCHS) is the principal health statistics agency for the United States, providing nationally representative information to guide policies and for conducting health research. In addition to data obtained through establishment surveys and the National Vital Statistics System, NCHS collects data through its population health surveys, such as the National Health Interview Survey (NHIS), the National Health and Nutrition Examination Survey (NHANES), and the National Survey of Family Growth (NSFG). These population health surveys are enhanced through record linkage to the National Death Index and other administrative data.
In 2015, the Research and Development Survey (RANDS), using recruited web-based panel surveys, was introduced. The purpose and use of RANDS at NCHS is to understand how this data source could be used as a tool for evaluating survey content and by investigating and developing methods for integrating external data with NCHS surveys. To date, four rounds of RANDS have been completed and additional rounds are planned [1]. Data from a round of RANDS specifically developed for the coronavirus pandemic, RANDS during COVID 19, were released in August 2020 and a second round is planned for the autumn of 2020 [2].
Although the use of recruited panels, which are created using the framework of probability sampling, has increased in recent years, a better understanding of how various panels operate in terms of frame construction, mode-effects, coverage, selection bias and other operational issues is still needed when considering their use by federal statistical agencies [3, 4, 5, 6, 7]. At the same time, maintaining and continuously improving the high quality of large national household interview surveys is expensive and necessary production decisions can affect the sample size, survey length and timeliness. The lower costs and ability for quick turnaround suggest that recruited web panels could offer a new and useful solution for statistical agencies for some purposes, particularly if their limitations can be sufficiently understood and their data placed within an appropriate context. Thus, while traditional sampling methods remain essential in the production of official statistics, it is possible that recruited web panels may be able to provide a platform for conducting methodological research that would ultimately advance the collection and use of government survey data and for collecting content not available on a national survey, or when survey operations are suspended and information is needed quickly, as during the Covid 19 pandemic.
To gain a better understanding of the properties of recruited web panels, specific objectives of the RANDS study are twofold: 1) to explore recruited web panels’ usefulness for conducting meta-research within the field of survey methodology and 2) to assess the comparability of estimates from recruited web panels with traditional interviewer-administered large national population surveys. For the first objective, NCHS seeks to assess the utility of web panels as a way of augmenting its primarily qualitative question evaluation research program with quantitative methodologies, specifically, the use of embedded, close-ended probe questions. The quantitative data coupled with the larger sample sizes (in contrast to traditional cognitive interviewing studies) allows for comparing the performance of alternate questions as well as their performance across respondent subgroups. If found successful, web panels could become a platform for investigating question response as a socio-cultural process as well as conceptualizing error quantitatively – significant advancements in the area of survey measurement.
For the second objective, NCHS seeks to evaluate health estimates from recruited panels and develop statistical methods for leveraging the strength of large national health surveys to align these estimates. RANDS data are designed to include health variables that can be directly compared to those from NCHS surveys and that can be used for development and evaluation of statistical adjustments for alignment of the sources.
The RANDS study provides common ground for these two methodological goals – which are traditionally seen as distinct, with different areas of concentration and epistemological tendencies – and creates a unique opportunity to explore relationships between them, particularly as they are conceptually situated within a paradigm of Total Survey Error [8].
This paper describes the first two rounds of RANDS, RANDS 1 and RANDS 2, obtained using similar methods from the Gallup panel, and presents progress toward both objectives using the data from RANDS 2. For clarity, only RANDS 2 data are used for illustration of the results, as this round included multiple variables from the NHIS for the purpose of direct comparison and embedded probes for question response evaluation. The focus and data collection of later rounds differ markedly from those of the first two rounds and information and results using those data are not included here.
In Section 2, we describe RANDS 1 and RANDS 2 data: how the samples were drawn as well as characteristics of the samples and topics covered in the questionnaires. In Section 3, we describe the investigation of measurement and question response, in particular, the development and use of embedded, close-ended probe questions to quantify error and patterns of interpretation. RANDS 2 is used to illustrate these results. Section 4 compares health estimates and illustrates the use of propensity score adjusted weights as one approach for integrating the recruited web panel data using RANDS 2 with corresponding data from the fourth quarter of the 2016 NHIS. We conclude in Section 5 with initial observations and describe the ongoing work.
Data description
Web panels
Over the past decade, numerous businesses and organizations have begun to recruit and maintain data collection panels (and associated survey software platforms) with, arguably, a range in sample quality. These collections of online respondents are known colloquially as “web panels,” and in general can be split into two major classes based on how they are constructed: non-probability and probability [7].
Non-probability, or opt-in, panels are developed without a traditional sampling frame, and instead rely on respondents either chancing upon the panel provider’s website or advertisements. These opt-in panels tend to be among the largest web panels and are the least expensive to conduct. However, since internet access is not universal and because opt-in panel development is not statistically designed, this type of web panel can have substantial coverage issues and lower quality data. Furthermore, since the universe of potential panelists is unknown, sampling probabilities cannot be assigned to panel members and, as a result, survey data cannot be accurately weighted using standard statistical survey methods. Thus, statistics from opt-in panels do not claim to be “representative” of any population.
On the other hand, some survey and market research organizations have developed higher-quality web panels based on principles of statistical sampling. These “recruited” panels rely on the panel provider actively recruiting specific people or households to become members. These providers use a variety of national frames to produce dual-frame random digit dial (RDD), address-based sample (ABS), or some combination of RDD and ABS samples for recruitment into the panel. Since the sampling frames are known, probabilities of selection can be assigned to members of the population, and typical statistical survey methods can be used to measure the quality of the final survey sample and produce estimates. While recruited web panels can suffer from the same coverage issues that were noted above for opt-in panels, most of the organizations who run these panels have incorporated methods for correcting this error – such as providing an opportunity for non-internet responders to be surveyed using a different mode (such as telephone or mail) or by providing non-internet-connected panelists with internet-connected devices such as laptops or tablets. However, using both the internet and non-internet panel members for a survey affects its cost and timeliness, and may have residual mode-effects.
NCHS uses recruited panels for RANDS because such panels provide data using more representative samples and can better meet the requirements of both research objectives than data from opt-in panels.
RANDS
Since its initiation, four separate rounds of RANDS data have been collected and more are being planned. The first two used a recruited web panel developed and maintained by Gallup [9], referred to as RANDS 1 and RANDS 2. RANDS 1 and RANDS 2 questionnaires were designed for comparison with corresponding data from the NHIS and included variables common to both sources. RANDS 2 included additional probes for evaluating question response patterns. Additional rounds of RANDS have been conducted using NORC’s Amerispeak panel [10] and are, and will be, designed to answer specific research questions through additional question sources and embedded experiments.
The Gallup Panel used for the first two rounds of RANDS is a recruited panel based primarily on a dual frame (landline and cell phone) RDD survey with some address-based sampling recruitment [9]. Although the Gallup panel includes panelists with and without web access, RANDS 1 and RANDS 2 were self-administered web surveys and no attempt was made to include respondents without web access. Invitations to participate in RANDS were sent to a stratified random sample of the Gallup panel, where sampling strata were formed to NCHS specifications by age, educational attainment, and race/Hispanic origin of the panelists.
RANDS 1 was fielded in late 2015 and had 2,304 completed responses. RANDS 2, fielded in spring 2016, included 2,480 completed respondents. Conditional response rates (American Association for Public Opinion Research (AAPOR) response rate 2 [11]) were 24.7% and 31.9% and completion rates were 23.5% and 30.1% for 2015 and 2016, respectively.
In addition to the responses for the questions collected on RANDS 1 and RANDS 2 and panelist information (e.g. age and race/Hispanic origin), Gallup provided sample weights for estimation calibrated to U.S. population totals for age group, race and Hispanic origin, sex, and educational attainment, referred to as RANDS weights. Although only panel members with internet access were included in RANDS 1 and RANDS 2, the population totals Gallup used to calculate the sample weights were not adjusted for internet use.
The RANDS 1 and RANDS 2 questionnaires fielded in the Gallup panel were drawn primarily from the items on the 2015 and 2016 NHIS questionnaire, from the family and sample adult core. Additional questions, or ‘web probes’, were added to the 2016 panel to study response patterns. RANDS 1 included 72 survey questions and the RANDS 2 included 73 survey questions and 21 probes. Health topics are selected for each round of RANDS to meet a variety of goals. While some health topics selected for RANDS 1 and RANDS 2 were among the key health measures in the NHIS Early Release Program (e.g. diabetes, smoking, asthma, health insurance, general health status) [12], other topics for these rounds were chosen specifically for studying measurement error (e.g. food security) or to inform inferences (e.g. web usage).
Unless otherwise specified, this paper uses the Gallup-supplied RANDS weights for calculating summary statistics. Variance estimates were calculating under the assumption of sampling with replacement. All estimates shown meet the NCHS Presentation Standards for Proportions [13].
Results are illustrated for RANDS 2. RANDS 2 included the embedded probe questions used for question evaluations. To simplify the results, the RANDS 2 data were also used to for the assessment of estimation methods. Comparisons of RANDS 2 estimates between subgroups and with corresponding estimates from the fourth quarter of the 2016 NHIS were assessed for statistical significance using survey-adjusted (Rao-Scott) chi-square tests [14] and differences are identified as statistically significant with
Question evaluation and measurement
In terms of measuring question response patterns, the RANDS study is being used to assess how recruited web-based platforms might augment the NCHS question evaluation program, which primarily uses cognitive interviewing methodology and qualitative analysis. Importantly, the purpose of investigating the use of recruited web panels is not to simply “add another tool to the question evaluation toolbox”. Rather, the objective is to assess how cognitive interviewing methodology and recruited web panel data collection might be strategically integrated to advance the field of question evaluation methodology.
This approach is consistent with increasing calls from within the field of question evaluation for mixed-method design [15]. Strictly quantitative methods of question evaluation, which use metrics such as item non-response and missing rates, only signal the potential of response error and cannot explain source or cause. Other more sophisticated quantitative methods (e.g. item response theory, latent class analysis, and multi-trait multi-method analysis) assess measurement quality by examining relationships between variables [16], but do not explicitly identify the phenomena captured by a single question, relying instead on the theoretical concept of latency. Cognitive interviewing studies, on the other hand, can distinguish the specific phenomena captured by a question, though results are not quantifiable. That is, while able to identify patterns of interpretation as well as reasoning as to why those patterns exist, cognitive interviewing studies cannot determine the extent to which those patterns are likely to occur within a population or within the various population subgroups. Thus, a primary aim of RANDS is to develop a measurement component for cognitive interviewing studies that could address the following questions: How much error or specific patterns of interpretation (as they are identified through cognitive interviewing) occur within a population? And, importantly, are there specific population subgroups who are more likely to produce error?
Development of embedded construct probes
Although traditionally understood as a pre-test method used to spot problems prior to fielding, cognitive interviewing methodology (as it is implemented at NCHS) [17] can be more succinctly understood as a validity study in that it reveals the processes and considerations used by respondents to form answers; it reveals the actual phenomena that respondents consider in their answer and, ultimately, what is represented by the statistic.
For each cognitive interviewing study, NCHS staff conduct in-depth interviews with respondents from a purposive sample, typically ranging between 40 and 100 respondents. Samples are theoretically defined and based on criteria typically related to the subject matter or specific demographic groups. Resulting interview data consist of textual narratives detailing the experiences or circumstances that respondents considered as they went about calculating or weighing those experiences to arrive at a single answer. When analyzed, the narratives reveal how questions perform and can indicate whether they pose potential response error. For a detailed description, see Miller et al. [17].
For clarity, Fig. 1 illustrates findings from a cognitive interviewing study examining constructs captured by the general health question, In general, would you say your health is excellent, very good, good, fair or poor? [18, 19]. The figure represents the myriad of concepts – as identified through cognitive interviewing within a cognitive interviewing sample – that are included in the respondents’ answers.
Visual representation of cognitive interviewing study findings for the self-rated general health question.
Embedded construct probe for the RANDS 2 general health question.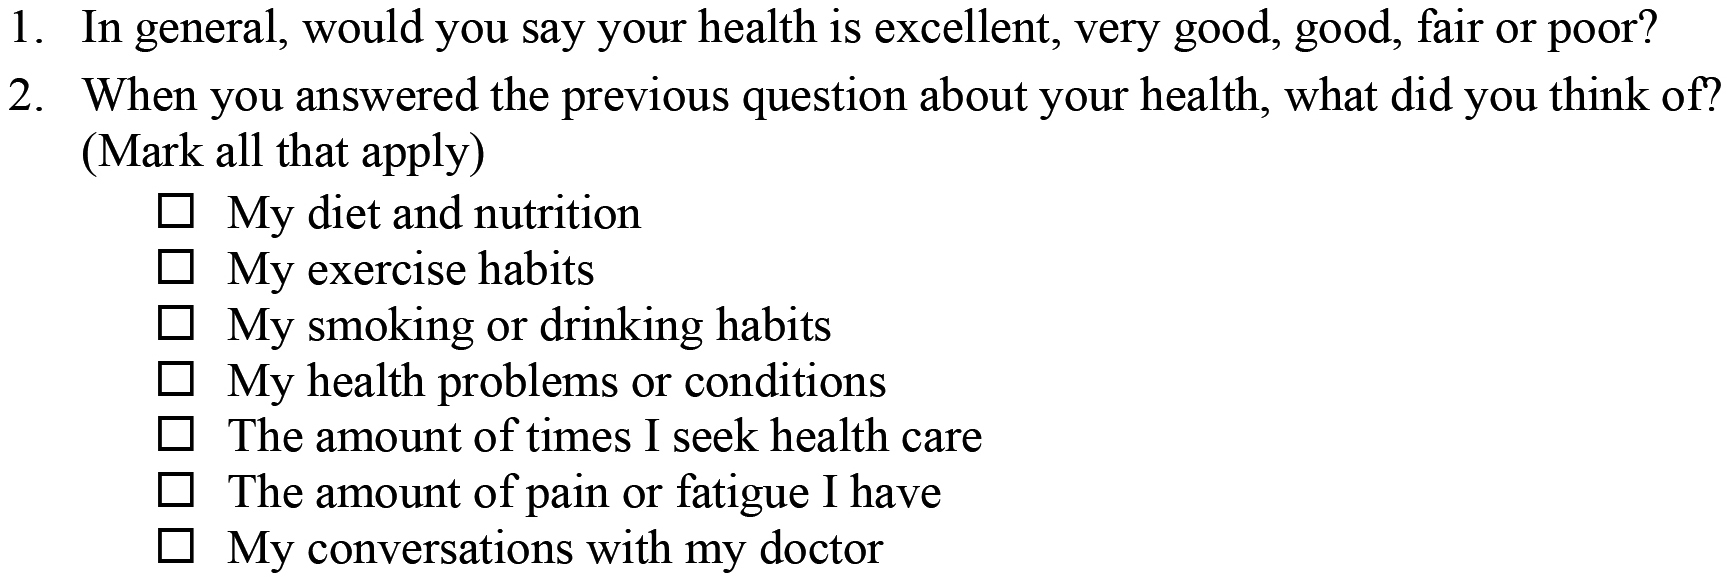
As illustrated in Fig. 1, when forming their answer, the cognitive interview respondents considered two overarching themes: 1) their actual health status, and 2) the behavior that (they believe) informs their health. For the theme of health status, the cognitive interview respondents reflected upon their actual state of health, thinking of illnesses and chronic conditions such as heart disease and diabetes that were discussed with their doctor, as well as how those conditions impact their daily lives: their ability to participate in activities, restrictions caused by pain, and dependence on medication. Those respondents who had been diagnosed with a condition and felt limited, in some way, by their health were inclined to report having poorer health than those with no condition and feeling no limitation. For the theme of health behavior, respondents reflected on their personal habits and daily practices, specifically, the healthiness of their meals, the regularity of their exercise, use of alcohol and tobacco products, and how these activities might impact their health. Cognitive interview respondents who saw themselves as engaging in healthy behavior were inclined to see themselves as being healthy, as opposed to those who saw their lifestyle as unhealthy. Importantly, in contrast to the previous theme, these were not assessments of actual health, but rather were activities that might inform actual health.
To understand how these themes would operate in a realistic survey sample, a close-ended construct probe was embedded within the RANDS 2 questionnaire specifically asking the web survey respondents to report what they considered when answering the general health question. The embedded item (Fig. 2) was developed from the cognitive interview findings and included aspects of their actual health as well as contributing health behaviors. The first three items in the embedded probe, specifically, diet, exercise and smoking/drinking, constitute the behavioral factors contributing to health; the remaining four items pertain to actual health: respondents’ health conditions, their need for care, their level of pain or fatigue, as well as conversations with their doctor. By asking web survey respondents to indicate which items they considered when formulating their answer, the construct probe attempts to quantify the specific themes accounting for respondents’ answers, that is, the actual construct measured.
Figure 3 presents estimates for responses from RANDS 2 web survey respondents (
Weighted percent estimates for patterns of interpretation used when answering self-rated health question, based on probe responses, by educational attainment (bachelor’s degree or higher compared to less than a bachelor’s degree): RANDS 2, 2016.
While there appears to be little difference in consideration of aspects pertaining to actual health, those with a college degree or higher were more likely than those without a degree to incorporate health behaviors in the assessment of their health status. That is, out of those with higher education, 67.2% considered diet, whereas only 49.4% of those with low education reported consideration of diet. Similarly, out of those with higher education, 63.3% considered exercise and 31.4% considered smoking/drinking, compared to 46.1% of those with no degree who considered exercise and 19% who considered smoking/drinking. Thus, the general health question appears to be performing somewhat differently for those with higher education in that they are more likely to consider risk factors that impact health.
In addition to a platform for question evaluation, RANDS is being used to compare estimates from recruited web panels with corresponding estimates from nationally representative surveys, either on their own or after statistical adjustments. The available resources and design features of the NHIS and other similar, nationally representative complex probability surveys are believed to contribute to a higher-quality content compared to web-based surveys. The NHIS, for example, emphasizes sample design features that improve coverage and statistical efficiency and operational procedures to improve response. While data from recruited web panels are designed to be representative, the internet-only portion of the recruited panel – the timeliest and most cost-effective data collection option – remains subject to coverage bias for national estimates. Additionally, the impacts of mode effects, differential response propensities, and other differences between large population health surveys and recruited web panels on survey estimation are not fully understood. RANDS provides an opportunity for these evaluations through fielding identical survey questions for direct comparison to NCHS surveys as well as including additional variables that could be useful for aligning health estimates.
To address the potential coverage bias, differences in response propensities, and any additional data quality issues in RANDS relative to the NHIS, propensity score adjustment (PSA) and PSA in combination with additional calibration, are being investigated as approaches for integrating RANDS with the NHIS for adjusting RANDS estimates. These methods follow from approaches used for inference from non-probability samples and methods for combining reference survey data with other data [20, 21, 22, 23]. In PSA, the likelihood of response to the external data relative to the reference survey is estimated from a regression model, typically logistic regression, and resulting response propensities are used to adjust the estimates for the external data. In the context of an opt-in web survey, Lee and Valliant recommended combining this method with additional calibration to known population totals for reducing bias [22].
National health interview survey
The NHIS is a nationally representative household-based survey that has provided health information for the United States to inform policy and research since 1957 [24]. The NHIS sample design and questionnaire have changed several times since the NHIS was first fielded in 1957. The NHIS sample design is updated after each decennial census. The questionnaire is updated less frequently. The most recent redesign of the NHIS questionnaire was implemented at the beginning of 2019. Data used in this report were obtained from the questionnaire in use from 1997–2018.
For estimation, variance units and sample weights are developed for the NHIS and are used to obtain nationally representative estimates and variances that account for the clustering and stratification in the sample design. NHIS sample weights are based on the inverse probability of selection into the NHIS and are adjusted for non-response and agreement with Census provided age, sex and race/Hispanic origin control totals of the civilian non-institutionalized population each year.
The 2016 NHIS was used for the PSA and calibration of the RANDS 2 data as well as for comparing the original RANDS 2 data. As RANDS data collection takes place over a period of weeks, not a year, data from the corresponding quarter of NHIS were used when making comparisons between the NHIS and RANDS and when illustrating the adjustment methods for this report, rather than full year data. In 2016, 40,220 households and 33,028 sample adults were included in the NHIS with response rates of 67.9% and 54.3%, respectively. Of these, 8,256 sample adults were in the second quarter (NHIS_Q2), corresponding to the RANDS 2 data collection period.
NHIS_Q2 estimates and percent distributions were calculated using the corresponding NHIS quarter weights adjusted for annual estimates. Standard errors for the NHIS were calculated accounting for the complex design using the Taylor series linearization method [25].
Variables
Several demographic variables available from both sources were used in the PSA analysis and calibration: age group (18–24 years, 25–44 years, 45–64 years, and 65 years and over), race/Hispanic origin (non-Hispanic black, non-Hispanic white, Hispanic, all other non-Hispanic race groups), sex, education (bachelor’s degree or less, more than a bachelor’s degree), region of residence (Northeast, Midwest, South, West), marital status (currently married, not married) and family income (
Although multiple health variables were collected in RANDS 2, four health variables were chosen as potentially useful covariates for the PSA and are compared here without additional adjustments: reported general health status (fair/poor versus excellent, very good, good), body mass index (BMI
Comparison of estimates using RANDS weights and from NHIS
Estimates from RANDS 2 using the Gallup-provided RANDS weights were similar to those from the NHIS_Q2 for age group, sex, region, and annual family income but differed for race/Hispanic origin (Table 1). The large differences observed for variables used for benchmarking both the RANDS and NHIS sample weights, such as race/Hispanic origin, is indicative of the different control totals, variable categories, and methods used for creating sample weights. For example, while both surveys post-stratify to race and Hispanic origin groups, the estimate of the percentage non-Hispanic white adults is 73% from RANDS 2, over 10% higher than the estimate of 65% using NHIS_Q2.
Selected demographic variables (unweighted sample size, weighted percentages, standard errors (SE, %)) from the NCHS Research and Development Survey 2016 (RANDS 2) compared to second quarter estimates from the second quarter of the 2016 National Health Interview Survey (NHIS_Q2), by data source
Selected demographic variables (unweighted sample size, weighted percentages, standard errors (SE, %)) from the NCHS Research and Development Survey 2016 (RANDS 2) compared to second quarter estimates from the second quarter of the 2016 National Health Interview Survey (NHIS_Q2), by data source
RANDS 2 estimates differed from those of NHIS_Q2 for percent distribution of BMI and percent uninsured but not for reported fair/poor health status or current smoking (Table 1). For example, the estimate of adults with BMI of 30 or higher was about 20% higher in RANDS 2 compared to NHIS_Q2 (37.2% and 30.6%, respectively). Estimates of uninsured were lower from RANDS 2 (7.34%) compared to NHIS_Q2 (10.2%). The estimates of percent fair or poor health and current smoking from RANDS 2 were within two percentage points of the corresponding estimates from NHIS_Q2.
As mentioned above, PSA methods with and without additional calibration are being investigated for adjusting the RANDS sample weights provided by Gallup (see Section 2.2) to align RANDS estimates with national population health survey estimates.
There are different ways to implement PSA. For this paper, propensities were obtained using a logistic model with the demographic, internet use and health covariates shown in Table 1: region, sex, age group, education, race and Hispanic origin, income category, marital status, use of internet for health information, reported health status, BMI category, health insurance status and current smoking. Missing categories for the covariates with item non-response were used in the logistic models to retain the whole sample for each analysis. Four PSA models were fit with different combinations of these variables.
The RANDS weights and NHIS weights were used in fitting the logistic model. As the RANDS weights provided by Gallup were scaled to the RANDS sample size, we scaled the NHIS weights to the NHIS sample size for comparability. The propensity-adjusted weights were calculated by multiplying the RANDS sample weight provided by Gallup by the odds of being in the NHIS_Q2 sample. Additional weights, referred to as calibrated propensity weights, were calculated by further calibrating the propensity weights to population control totals for age group, sex, and race/Hispanic origin categories.
In the results that follow, standard error estimates for RANDS 2 estimates calculated using the propensity weights and calibrated propensity weights did not account for possible additional variability from the PSA model used to estimate the weights and may be too small. Similarly, statistical tests of differences for propensity-adjusted and calibrated propensity-adjusted RANDS 2 estimates and NHIS_Q2 estimates are based on the assumption that the covariance between sources is zero [20].
Statistical tests between the adjusted RANDS 2 estimates and their corresponding NHIS estimates were made for each of the different PSA adjustment scenarios. Comparisons among RANDS 2 estimates under different adjustment scenarios were by inspection and not statistically tested.
The results of the PSA adjustment and calibration are illustrated here using asthma-related variables collected on the NHIS: ever diagnosed with asthma, current asthma, and asthma attack. Ever diagnosed with asthma, referred to herein as ‘ever asthma’, is defined as a positive response to the question Have you ever been told by a doctor or health professional that you have asthma? Current asthma is defined as a positive response to the question Do you still have asthma? Among those who report ever asthma, asthma attack is defined as a positive response to the question During the past 12 months, have you had an episode of asthma or an asthma attack? Missing responses for the asthma variables were dropped from the PSA analyses; covariate distributions for the samples with asthma information were similar to the those for the complete samples in Table 1 (not shown.).
Asthma related variables were chosen for illustration, as asthma affects adults of all ages and its prevalence is correlated with factors often used in statistical adjustments, such as demographic variables and socioeconomic status, making it useful for comparisons between data sources. In addition, several variables are available for asthma, allowing for illustration of different types of information (e.g. prevalence, adverse event) for one health topic. For context, over 19 million adults currently have asthma [26].
Table 2 shows estimates and standard errors for the asthma related variables for RANDS 2 using the Gallup-provided RANDS weights and for NHIS_Q2. The estimate for ever asthma was over one-third higher and the estimate for current asthma was nearly 30% higher for RANDS compared to NHIS_Q2. The estimate for asthma attack in the last 12 months was nearly 20% higher but the difference between the estimates from the two sources was not statistically significant.
Asthma related variables (sample size, weighted percentages, standard errors (SE, %)) from the 2016 Research and Development Survey (RANDS 2) and 2016 National Health Interview Survey (NHIS_Q2), by data source
Asthma related variables (sample size, weighted percentages, standard errors (SE, %)) from the 2016 Research and Development Survey (RANDS 2) and 2016 National Health Interview Survey (NHIS_Q2), by data source
Asthma related variables (weighted percentages, standard errors (SE)) from the 2016 Research and Development Survey (RANDS 2) using propensity adjusted weights with and without calibration
Notes: Propensity weights calculated using logistic regression with the covariates listed in Table 1: demographic (age, sex, race/Hispanic origin, education, family income, region, marital status); internet use (use of internet for health information); health (reported health status, current smoker, body mass index, health insurance). Propensity/Calibrated weights additionally calibrated to population estimates from the 2016 NHIS by age group, sex, and race/Hispanic origin.
Table 3 shows estimates and standard errors for the asthma related variables for RANDS 2 with RANDS weights adjusted using four PSA models, with and without additional calibration.
PSA model included demographic, internet use, and health variables (all covariates); PSA model included demographic and internet use variables (demographic and internet use); PSA model included demographic and health variables (demographic and health); PSA model included demographic variables (demographic only).
Estimates for ever asthma, current asthma and asthma attack all remained higher in RANDS 2 after adjustment and calibration, though the results varied among the models and outcomes (Table 3). Subsequent calibration to population totals for age, race and Hispanic origin, and sex had minimal impact on estimates after PSA.
RANDS 2 estimates for ever asthma decreased from 19.1% using the RANDS weights to 16.7% and 17.1% using the all covariates and demographic and internet use PSA adjustments, respectively, making these estimates closer to that from NHIS_Q2 (13.9%). However, the demographic only and demographic and health PSA models increased the difference between RANDS 2 and NHIS_Q2 estimates slightly. Using the demographics and health PSA and the demographic only PSA, RANDS 2 estimates for ever asthma increased to 20.0% and 20.4%, respectively.
All PSA adjustments had a smaller effect on the current asthma estimate. RANDS 2 estimates with the all covariates (10.2%) and demographic and internet use (10.58%) PSA adjustments were within one percentage point of the RANDS 2 estimate using RANDS weights (10.9%). As with ever asthma, demographic only and demographic and health PSA models slightly increased the difference between RANDS 2 and NHIS_Q2 estimates for current asthma. Using the demographics and health PSA and the demographic only PSA, RANDS 2 estimates for current asthma increased to 11.3% and 11.8%, respectively.
In contrast, the original RANDS 2 estimate for asthma attack (34.2%, Table 2) became farther from the NHIS_Q2 estimate (28.5%) with all PSA adjustments: all covariates (40.3%) and demographic and internet use (41.8) PSA adjustments, demographic only (38.4) and demographic and health (36.3).
Our initial investigations with RANDS indicate that the information obtained from web panels will be useful for decisions about question construction, placement, and interpretation and will provide information for question evaluations not easily available in other ways. However, given known issues with coverage when using data from internet users only for national estimates and with the empirical results showing differences between the NHIS and RANDS estimates here, NCHS continues to investigate methods for aligning estimates from RANDS with those from NCHS surveys. These goals are connected. Insights into question performance can inform estimation methods, while advances in estimation methods will lead to better inference when using web panel data for question evaluation.
RANDS has demonstrated its utility for fielding surveys using web panels for question evaluation as shown here and in prior reports [18, 19]. While cognitive interviews provide key insight into question-response patterns, the larger size, lower costs, and timeliness of web data collections from recruited panels have the potential to advance the science of question evaluation in multiple ways. First, the larger sample and the ability to target specific subgroups allow for assessment of the applicability of conclusions from cognitive interviews to diverse populations. Second, experiments can be built into data collection that allow for direct comparisons between alternative questions, question placement, and response categories without affecting questions on other topics. Finally, it may be possible to generate quantitative estimates of measurement error that could be used to inform estimation and analysis for some health outcomes.
In terms of estimation, some of the health estimates reported here from RANDS 2 using the RANDS weights provided by Gallup were similar to their NHIS_Q2 counterparts (e.g. fair/poor health status, current smoking) and others were not (e.g. uninsured, BMI), despite coverage limitations and other differences between sources (e.g. mode effects, recruitment methods, response rates, etc). In our example of asthma outcomes, after re-weighting the RANDS 2 sample using PSA and additional calibration, some RANDS 2 estimates became closer to and some moved slightly farther from the corresponding NHIS_Q2 estimates. The choice of covariates had an impact on the PSA results. For the variable ever asthma, the inclusion of the internet use variable in the PSA model had a larger effect on reducing differences between RANDS 2 and NHIS_Q2 than the inclusion of the health variables. However, all adjustments increased the difference between the data sources for estimates of asthma attack. As here, potential asthma-related reasons for similarities or differences were not investigated in this report.
The empirical estimation results shown here are not generalizable to the variety of health outcomes of interest or the range of variables that could be used as inputs for PSA and other adjustment methods. However, they can inform directions for additional methodological research. Further, although we applied one approach for PSA, other implementations are possible. Chen and colleagues, for example, provide a theoretical justification for an approach for non-probability samples that does not adjust the sample weights for the reference survey [27]. Other research directions might address questions such as: what are the implications of applying a single PSA model for multiple health endpoints, what are the properties of the most useful covariates in a propensity model, are there key interactions among covariates that would affect patterns of interpretation, and can alternative approaches – such as statistical matching or imputation – better align sources? Adjusting for differences in the health of respondents to large national surveys and respondents to RANDS may better align estimates between the sources. However, health covariates included in weight adjustments cannot be used as endpoints to evaluate the success of such adjustments. The choice of particular health variables for each purpose and the best designs for such evaluations are not yet clear.
A key strength of the panels is their ability to leverage the internet and conduct surveys faster and with lower costs, however, this leads to coverage errors. Successful adjustments to the sample weights, either by the vendors, or for RANDS by NCHS, depend heavily on ability to weight internet-only samples up to the full population given differences observed between these groups [28]. Examination of other traditional sample survey issues, such as mode effects, and results from question evaluation experiments may uncover factors that can be used to develop better adjustment methods.
Less attention has been given to research questions about the properties of the large national surveys – for example, how large should they be and what types of information is needed to support adjustment and calibration efforts for recruited web panel data and other external sources. A recent study using RANDS 2 compared the usefulness of using annual data and quarter-specific data for adjustments, asking both whether the size of the reference sample and the temporal alignment affected the results [29]. In that analysis by Irimata and colleagues, adjusted health estimates overall varied little when using the quarterly or yearly data, indicating flexibility in selecting the reference NHIS dataset. Since data from recruited web panels can often be produced faster than data from large annual surveys, the implication that prior year data or part-year data can be used as a reference source for such analyses is promising. However, the generalizability of the Irimata et al. results to other references sources may depend on the design of the reference source, the outcomes of interest, the available information for adjustment and other factors.
The Covid 19 pandemic created a need for statistics and information that could be obtained and disseminated quickly. RANDS, although developed as a research program, was considered as a source for fulfilling some data needs when regular survey operations were interrupted or altered. The results shown here and other ongoing RANDS research activities informed two rounds of RANDS data collection in the spring and summer of 2020, RANDS during COVID 19 [2]. While web panels are not intended to replace population health surveys for key estimates, RANDS during COVID 19 is providing some experimental estimates for telemedicine access and use, reduced access to various types of health care, and loss of work due to personal or family illness with coronavirus, where the experimental estimates are raked to align with the NHIS on a variety of demographic and health variables. RANDS during COVID 19 is also being used to evaluate pandemic-related survey questions.
RANDS is a scientific resource for advancing research in the use of recruited web panel data for improving national health estimates and making its data available to external researchers [1]. Understanding the usefulness of information from recruited web panels is often hindered by the lack of a source by which to assess bias and evaluate quality. RANDS’ design allows for direct comparisons between its estimates and those of the NHIS, a large, high quality, nationally representative survey. Further, size and flexibility of the data collected in the RANDS program have provided information about question design and construction otherwise unavailable from cognitive interviewing. Initial findings of the RANDS support the use of recruited web panel surveys to inform question evaluation studies. However, findings shown here suggest that there is likely not a ‘one size fits all’ approach to aligning recruited web panel data with large national surveys.