
Abstract
The quality of metadata is a crucial determinant of usability/interpretability of data. This paper draws attention to the poor quality of India’s government statistics and the paucity of metadata necessary to understand data quality problems. The paper suggests that there has been a decline in India both in terms of the availability and quality of metadata for key government sources of information including maps, decennial population censuses and National Sample Surveys amidst growing sophistication in the understanding of metadata. The poor quality of metadata impairs cross-sectional as well as inter-temporal comparisons and policymaking apart from concealing biases and lapses of government statisticians. The paper draws on the experience of three states – erstwhile Jammu and Kashmir, Manipur and Nagaland – where government statistics have been affected by serious errors that are not well-understood due to the lack of adequate metadata.
Keywords
Introduction
The discursive component of India’s census reports has been decreasing since the late colonial period. KS Singh, former Director General of the Anthropological Survey of India, points out that “The census report of 1931 was easily the most comprehensive of all such reports complete with maps, statistics, ethnographic accounts and provinces’ reports together with a three-volume all-India report” [76, p. 141]. The 1921 Census, though, seems to have marked the beginning in India of the “gradual end to the discursive general report in Volume I of the census” [78, p. 116]. This local development was linked to two “world-wide trends” namely, the growing acceptance of “the notion that statistics could speak for themselves” and the growing attention to economic issues [78, p. 116]. In post-colonial India, the marginalisation of commentaries and qualitative data in statistical reports hastened after the first few censuses.2 The 2011 Census perhaps marks the culmination of this long term trend.3 Most data of the 2011 Census were released in the form of barely annotated Microsoft Excel tables. Statistical information is increasingly being treated as complete in itself, not requiring any explanation because usability/interpretability of data seem self-evident in the age of easy to handle digital databases and cheap statistical software.4
Discussions on the quality of data mostly focus on accuracy. Other dimensions of data quality that are important for policymaking and public debate such as usability/interpretability, accessibility and timeliness are largely ignored.5 In most developing countries the quality of government data is lacking along the aforesaid dimensions as the focus is on somehow making data available.6 This also holds good for countries like India where the state has immense experience of collecting data. Assessment of the quality of, say, Indian census has been mostly limited to accuracy from the perspective of coverage (errors in the overall headcount)7 and content (errors in the sub-classification of headcount)8 errors. Other dimensions of quality such as the timeliness of the release of census have received scant attention [6]. There is a similar dearth of analyses in case of maps and sample surveys.9
The quality of metadata is a crucial determinant of usability/interpretability because, as the draft of India’s National Policy on Official Statistics notes, “easily accessible metadata …facilitate better understanding of data” [53, p. 21]. This paper examines government statistics from the perspective of usability/ interpretability, which is a widely neglected dimension of data quality in the Indian context. The paper suggests that there has been a decline in India both in terms of the availability and quality of metadata for major sources of information including government maps, decennial population censuses and National Sample Surveys. It argues that the poor quality of metadata affects cross-sectional as well as inter-temporal comparisons and policymaking. The paper first discusses the evolving understanding of metadata in Indian government laws and policies (Section 2). This is followed by an evaluation of metadata on maps (Section 3), censuses (Section 4) and National Sample Surveys (Section 5). Three states – Nagaland, Manipur and the erstwhile Jammu and Kashmir10 (Fig. 1) – where various government statistics have been affected by serious errors are chosen to illustrate the deficiencies in metadata. Section 6 concludes with a discussion on the implications of poor quality of metadata.
Jammu and Kashmir, Nagaland and Manipur (2011). Notes: (i) Prepared by the author using a map template available at 
Metadata are data about data and provide information about how the data were collected, processed and prepared for wider dissemination. This information is essential for understanding and using data. The boundary between data and metadata is not fixed though because data become metadata when they are used as such in a given context.11 A few recent laws and policy documents throw light on the evolving official understanding of metadata in India over the last decade.
The Collection of Statistics Rules 2011 (Rule 5, Sub-rule 5) stipulates that every notification under the Collection of Statistics Act, 2008 shall contain the following information: subject and purpose for collection of statistics; geographical area for collection of statistics; method of data collection; nature of informants; period of collection of statistics; reference period; nature of information to be collected; language in which information is to be furnished by informants; obligations of informants; nature of records that may be inspected; and the manner of inspection. Interestingly, the Collection of Statistics Rules do not call for the release of all these details along with the data.
India’s National Data Sharing and Accessibility Policy, 2012 released a year after the Collection of Statistics Rules defines metadata as the “information that describes the data source and the time, place, and conditions under which the data were created. Metadata informs the user of who, when, what, where, why, and how data were generated. Metadata allows the data to be traced to a known origin and know[n] quality” [45, p. 2.7]. It adds that datasets should provide “information including methods, structure, semantics, and quality control/assurance” [45, p. 12 (i)].
The draft of the National Policy on Official Statistics offers a more nuanced understanding. Several points are notable in its treatment of metadata. First, it makes explicit the category of “‘Discovery metadata’, i.e., information enabling users to identify and access data” in the official discourse [53, p. 49]. Second, it shows awareness of how data processing technologies shape data and, therefore, includes in metadata “information about the software used to arrange and process the resource …to ensure that the data can continue to be understood, manipulated and accessed over time” [53, p. 49]. Third, its notion of metadata covers ethical and other aspects not included in earlier documents:
a description of the data collection arrangements including sample design, questionnaires, coding instructions and classifications, editing, validation procedures including auto-corrections if any made in the data, methodologies, and method of data collection, quality of data, confidentiality and anonymisation procedures and any other relevant materials [53, p. 49]
Fourth, its understanding of metadata is informed by almost the entire lifecycle of data including their use. It views metadata as essential for “users to make informed and full use of data” and minimising “the likelihood of misuse” of data [53, p. 48].
A few comparative observations will help to clarify the scope of these rules and policies. First, they cover only a part of the government statistical system. None of them applies to key sources of information such as maps, population censuses or national sample surveys. In fact, the Collection of Statistics Act explicitly notes that it does not apply to “human population census” (Art 32). So, the emerging understanding of metadata does not formally apply to the most important sources of government statistics. Second, the official understanding of metadata does not yet cover all the steps in data production. It does not cover under metadata information about the legal-administrative framework within which data have been collected.12 The Collection of Statistics Rules can, however, be seen as referring to the legal aspect under the category “Obligations of informant” and “Restrictions on the use of personal information”. Likewise, the draft of the National Policy on Official Statistics too touches upon the legal aspect when it discusses issues related to confidentiality and anonymisation procedures. The discussion on legal aspects in these documents is, however, not as extensive in scope as the earlier census reports that offered detailed notes on the legal dimension of data collection [24: 32, 39, 25: 8, 26: 2, 5, 33: 38, for instance]. Third, the official understanding has not yet recognised the importance of good quality metadata to users who have to deal with several revisions in data. We will discuss below an instance of the release of multiple mutually inconsistent “corrections” to census data presented in isolation from the originally published figures that left both government and academic users confused. More generally, the census does not provide a comprehensive discussion on the relationship of provisional totals, final totals corrected/adjusted/estimated figures and the results of Post Enumeration Survey. Fourth, none of the aforesaid policies and rules mandate detailed descriptive reports that used to be published earlier. For instance, the National Data Sharing and Accessibility Policy limits its attention to metadata “in standardized formats …which enables data discovery and access through departmental portals.” Fifth, following OECD [71, p. 658] the constituents of metadata can be classified into three broad categories: conceptual (what and why), methodological (how) and quality (Table 1). The richly annotated reports of the earlier censuses and surveys supplied ample information for all three dimensions of metadata but the conceptual and quality dimensions of metadata remain underemphasised in the emerging minimalist official understanding of metadata that is focused narrowly on the methodological dimension.
Evolving understanding of Metadata in India
Evolving understanding of Metadata in India
Sources: Compiled by the author using Collection of Statistics Rules, 2011, [43, 51].
While the rules and policies discussed in this section do not explicitly apply to maps, census data and National Sample Survey data, they can nevertheless be used as statements of the official perspective on the desirable scope of metadata and can in principle help assess the quality of metadata supplied with the sources of information of interest to us.
The Census of India and the Survey of India are among the most important sources of cartographic information for India.13 Both of them are deficient vis-à-vis metadata in terms of completeness as well as uniformity of information shared for comparable administrative units. We will discuss this at three levels – international, inter-state and intra-state.
There is an inconsistency between the representation of parts of Jammu and Kashmir that are under the occupation of Pakistan and China. The state’s population density is calculated after excluding “the entire area and population of those portions of Jammu and Kashmir which are under illegal occupation of Pakistan and China” [40, p. x]. Both the areas under the occupation of China and Pakistan have never been covered by census and surveys in independent India but census maps shade only the latter in grey colour that indicates “Data Not Available” [41, p. 13], while census choropleths cover the territory under Chinese occupation [47]. Moreover, the source of information used to draw these two stretches of international border that have not yet been surveyed is not mentioned either. In other words, government maps are deficient in methodological, let alone quality, metadata vis-à-vis international borders and, as discussed below, this holds good for maps dealing with intra-national borders as well.
Internal borders of Nagaland (2011). Note: Peren’s border shifted northward into Dimapur despite the net transfer of territory from Peren to Dimapur. Source: [2].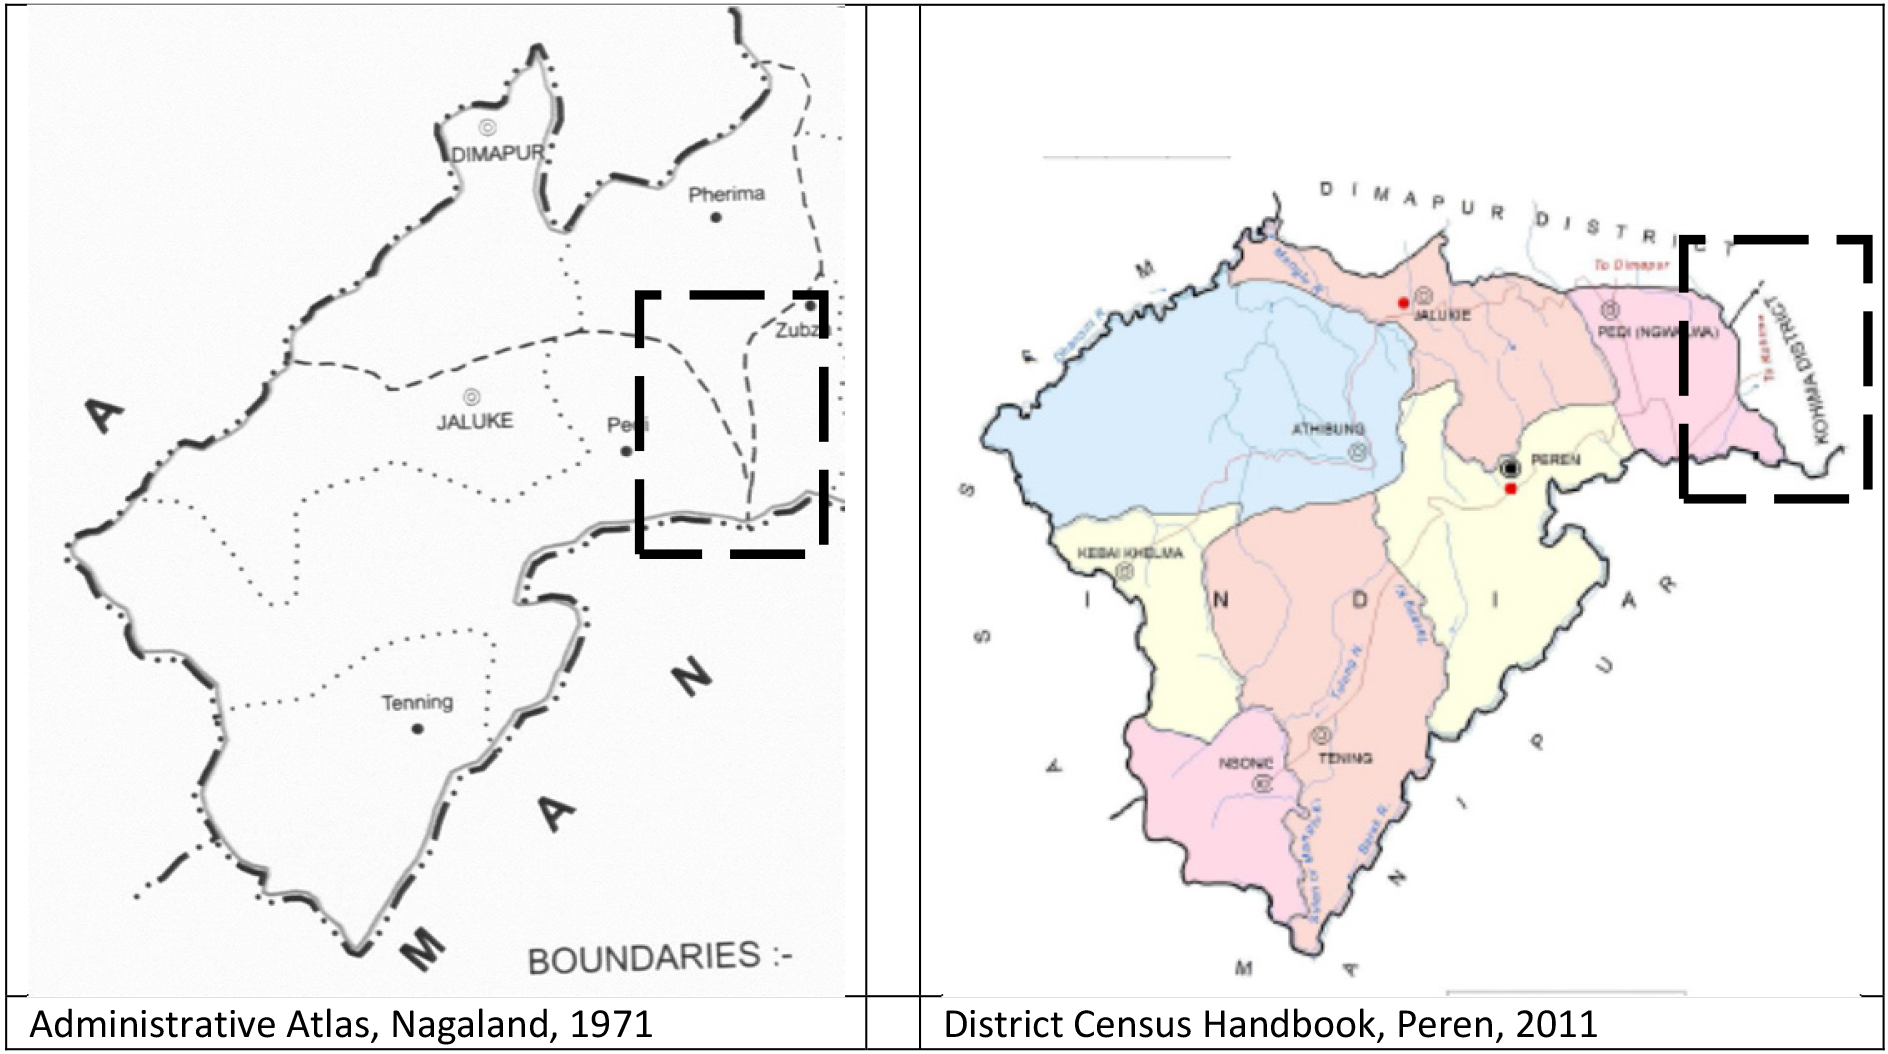
Border disputes of different states are treated differently. Nagaland has border disputes with Assam and Manipur, neither of which are acknowledged in census maps despite implications for the understanding of anomalies in population statistics [5]. While Assam has border disputes with all its successor states, only its disputes with Meghalaya and Arunachal Pradesh are noted in maps. Assam’s dispute with Nagaland, which is the most serious of all its border disputes, is not noted in maps. Elsewhere in the country disputes are clearly acknowledged along with an estimate of the area of the disputed territory [37, p. 169]. In some cases, even inter-state dispute over single villages are noted in great details [[40]: General Notes]. The unsettled nature of Nagaland’s border can only be guessed from cryptic notes in census maps on technical difficulties faced in drawing the borders of newly formed circles (i.e., sub-district administrative units) along the Assam border [41, p. 39]. Disclaimers added to irredentist maps prepared by the Nagaland GIS & Remote Sensing Centre for the state government14 though, throw some light on the disputed borders: ‘The boundaries of Nagaland as shown on this map are subject to revision as provided in the 1960 Delhi Agreement,’ ‘This map is without prejudice to the claims of Nagaland for re-drawing the Assam-Nagaland boundary on the basis of historical and traditional factor [sic]’ and ‘Not Legal’ [5, p. 121]. As discussed later, Nagaland squeezes within its constitutionally recognised borders the newly created circles that lie in the disputed area. This has disturbed the borders of adjoining circles. Even otherwise, Nagaland’s internal borders have often changed without any transfer of territory. In fact, in some cases the shift in border and transfer of territory have happened in opposite directions, e.g., Peren-Dimapur border (see Fig. 2, also [5, p. 68]), whereas in other cases the border has shifted without any transfer of territory, e.g., Tseminyu-Dimapur border [5, p. 70].15 However, maps of Nagaland do not carry information about the source of information about the location of borders. The Survey of India maps of some of the other states clearly identify borders that it has directly verified and those for which it depends on other departments [see, for instance, [44, 50]]. The Survey of India does not make a similar distinction in case of Nagaland even though it has not surveyed the entire state.
In addition, the method of estimation of area is not clear either. In the absence of field verification of inter-state borders, estimates of area could be inaccurate. Census reports do not explain the changes in estimates of the overall area of Nagaland. The change between 1961 and 1971 was attributed to changes in “computational techniques” [31: 23, 40], while the change in the following decade was attributed “to adoption of different technique” [32, p. 13]. It is not clear “if earlier census publications included only the reporting area for land utilisation under geographical area” [[5, p. 109], emphasis in original].
Over the past three decades, census operations have been affected by extraneous political factors in the states of Nagaland, Manipur and erstwhile Jammu and Kashmir (Fig. 1). Metadata would have been very helpful in assessing the quality of census data and their usability in each of these cases. This section shows that just as in case of maps India’s census reports are deficient in both methodological and quality metadata for these states and discusses the implications of this deficiency.
The Census of India used to publish a whole range of informative and insightful commentaries including Administrative Reports, which offered a detailed insider’s view of how the census was conducted, and General Population Tables, which offered a wealth of qualitative information. Together these reports were the most important sources of metadata on census.16
While the census still maintains that “it would be proper …[to] provide a methodological and administrative report” [21], the steady decline in the share of commentaries in census publications continues. Administrative Reports are not available for the censuses conducted after 1981. The General Population Tables were not released for Nagaland in 2001, while those of Manipur and Jammu and Kashmir provide only bare minimum information. Further, the General Population Tables do not seem to have been released for any state in 2011. In fact, most tables for the 2011 Census were released in the form of Microsoft Excel files that do not even mention the date of release without which an assessment of timeliness is not possible [61].
In absence of the aforesaid reports for the 2011 Census, researchers and policymakers have to rely upon the training manuals for enumerators, the bare minimum metadata released by the Office of the Registrar General & Census Commissioner, India (ORGI) that includes the tabulation plan, formats of tables and a brief description of variables [22, 23], and the slender prefaces and introductions of Provisional Population Totals that are released about a month after enumeration [[6]: Table 1].
Nagaland
Maps are used to plan census operations and display processed census data while area statistics are used to calculate population density. As mentioned earlier, Nagaland has a longstanding border dispute with the neighbouring state of Assam. Nagaland has gradually expanded its footprint in the disputed area along the Assam border and changed the status quo by extending its administration in that area even though the dispute is under judicial consideration. The Government of Nagaland “ostensibly maintains status quo by publishing a set of maps that do not show any administrative presence in the disputed area. In these maps, four circles – Niuland, Nihoku, Kuhoboto and Aquqhnaqua – are arbitrarily squeezed into the northeastern part of Dimapur [district of Nagland], even though perhaps only the first two lie partly within the state’s officially recognised border” [5, p. 70].
The General Population Tables for Assam [34, p. 22][38, p. 22] and India [37, p. 24] tersely note the border dispute and mention the number of villages of Assam under the administration of Nagaland. However, the General Population Tables for Nagaland are silent in this regard. The census reports on Nagaland indirectly hint at the anomaly by noting that the borders of “newly created” circles in the disputed area – Aquqhnaqua (Dimapur) and Merangmen (Mokokchung) – “could not be drawn due to technical difficulty” [41, p. 39]. While the disputed territory is not included in census maps, the population of parts of that territory is added to Nagaland’s population because Naga settlers in Assam refuse to cooperate with Assam’s enumerators. This inflates the population density of Nagaland. The 2011 population density of Dimapur will drop by 27.66 per cent if this fact is considered [5, p. 74]. Moreover, the erroneous treatment of the disputed territory distorts the borders of several other circles within Nagaland such as Tseminyu whose maps change between censuses, often without any transfer of territory [5, p. 70]. The absence of necessary metadata on the geographical accounting of population has meant that government statisticians, policy-makers and researchers routinely overestimate population density [5, p. 74], the population of the disputed area is most likely double counted in the national population [5, p. 107] and the National Sample Survey Office’s sampling frames for Nagaland and Assam potentially overlap in this area [5, p. 107].
Decadal population growth rates (in per cent), Nagaland and India, 1951–2011. Notes: (i) 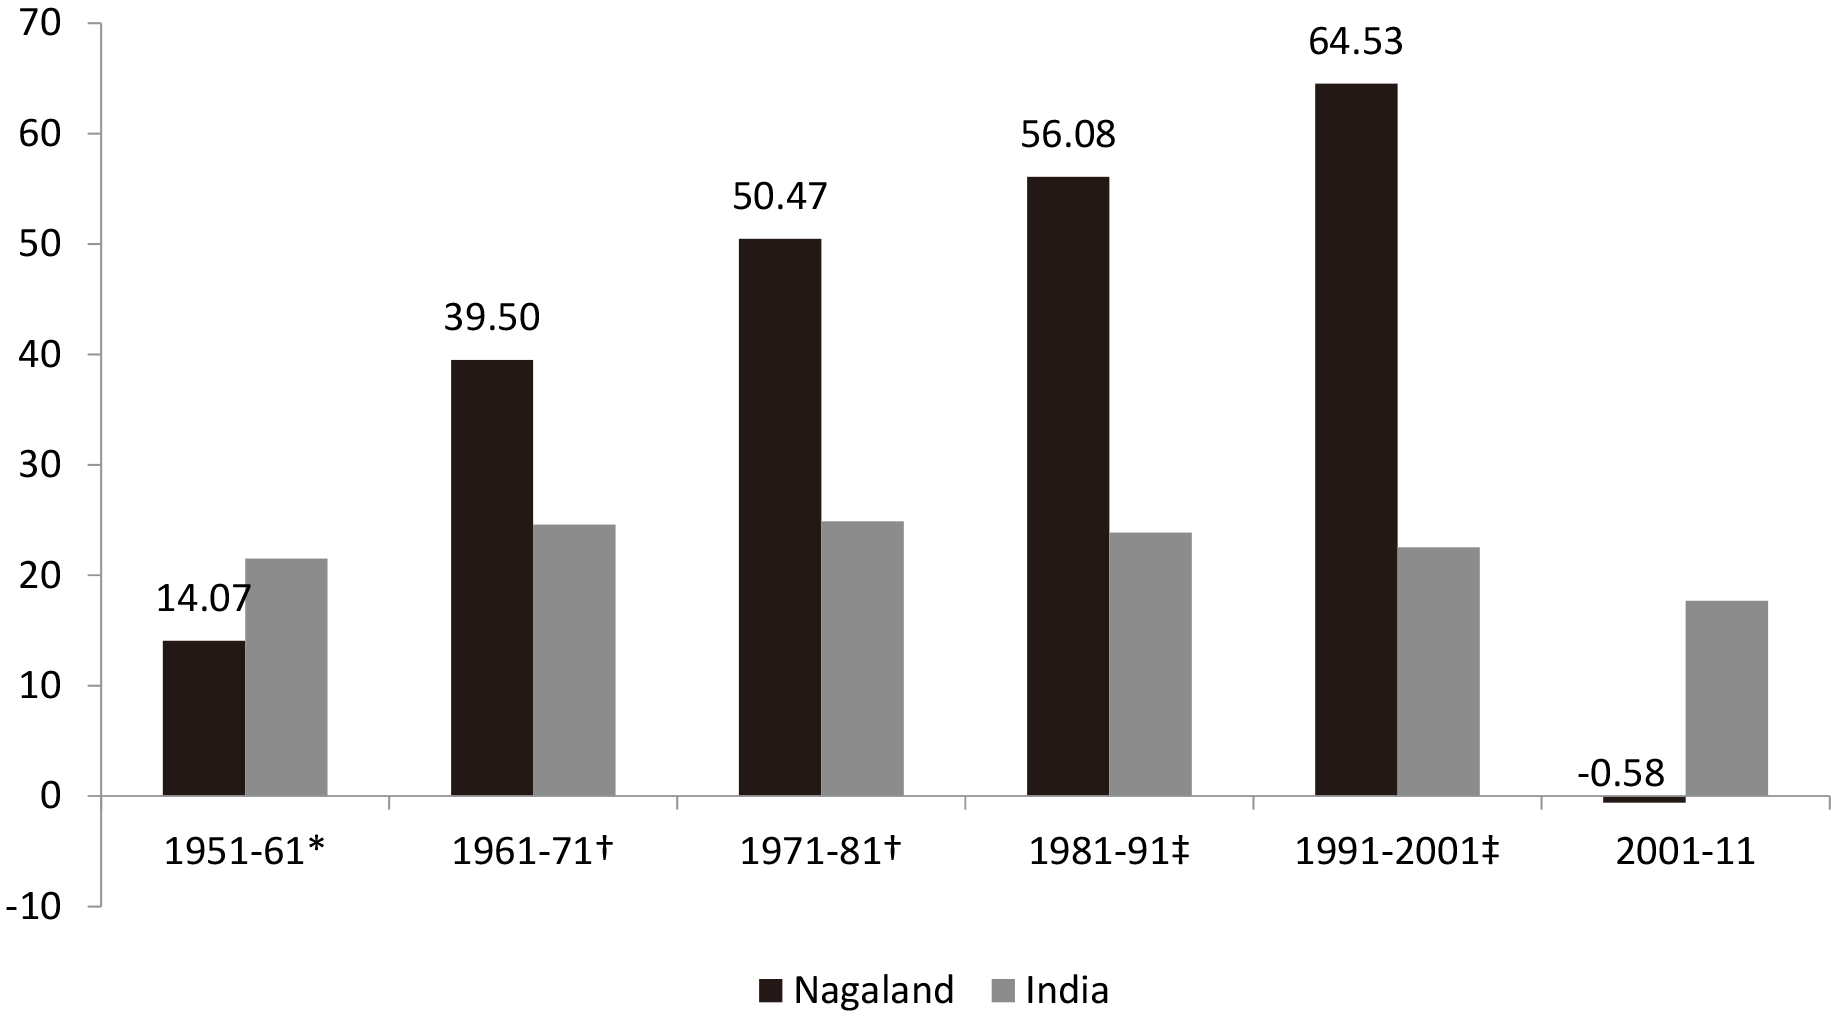
Another problem at the interface of area and population relates to the estimates of Nagaland’s population growth rate between 1951 and 1961. Inadequate accounting of the change in Tuensang’s area covered under census has spawned confusion. Nagaland’s population grew by 14.07 per cent according to [74, p. 77][18, p. 91]. Other sources suggest a growth rate of 79.29 per cent (calculated using [16, p. 18]). In fact, even a census report suggested that the decadal population growth rate was 73.35 per cent [40, p. 165]. However, the adjusted decadal population growth rate was only 14.07 per cent, after excluding Tuensang in both the terminal years as it was not completely covered in 1951. However, even this correction fails to account for the complex territorial exchange between Tuensang and Mokokchung [5, p. 109].
Further note that after two decades of unusually high population growth that peaked in 2001, Nagaland reported a sudden “contraction” of population in 2011 in the absence of epidemical disease, famine, natural calamity, war and any major change in its political status and socio-economic conditions (Fig. 3). A combination of political and economic factors explains grassroots manipulation that resulted in large, systematic and growing coverage and content errors [5]. The ORGI, however, did not formally acknowledge the erroneous nature of data despite being party to a long running court case that successfully challenged the delimitation of constituencies on the basis of 2001 Census.17 The only statement on behalf of census authorities appears in the preface and introduction of the Provisional Population Totals published by the Director of Census Operations after the 2011 Census [42: viii, 2]. Provisional Population Totals, though, have limited shelf lives as they are eventually superseded by Final Population Totals and Primary Census Abstracts, which are the documents referred to by most users later.
Population growth rates (in per cent), Manipur, 1991–2011. Notes: (i) The growth rate is the percentage change in population between 1991 and 2011. (ii) Mao-Maram, Paomata and Purul are sub-divisions of Senapati district of Manipur. (iii) 
Nagaland government’s statistical bureaucracy as well as union government’s committees and commissions used the inflated population figures even after it was widely accepted that the data were anomalous, and the courts even prohibited their use in the delimitation of electoral constituencies. In the absence of adequate metadata, government officials [e.g., [68]] and academics [e.g., [69, p. 41]] misinterpreted Nagaland’s high and rising population growth rates as evidence of heavy rural-urban and international migration, respectively. Later when the reported population of Nagaland contracted the official statisticians of the union government (e.g., NSS Report No. 564: Appendix C) interpreted it as a contraction of the actual population, when it had, in fact, grown in absolute terms.
The range of government bodies that used the flawed census statistics without even adding a caveat is revealing: the Directorate of Economics & Statistics of the Nagaland government (GoN 2004), the Committee on Optimum Sample Sizes for North Eastern States [39], the Committee for Evolving a Composite Development Index of States [46, pp. 26–27], the High Level Committee on Socio-economic, Health and Educational Status of Tribal Communities [49, p. 240] and the Fourteenth Finance Commission [52, p. 95]. The Fourteenth Finance Commission’s use of flawed statistics translated into an additional devolution of INR 3.33 billion, which is substantial insofar as Nagaland’s own tax revenue was INR 4.27 billion during 2015–16 [5, pp. 295–296]. The Finance Commission perfunctorily mentions the ‘Central Statistics Office’ as the source of population projections, let alone discuss the quality of census data and its implication for devolution [5, p. 321].
Three sub-divisions of Senapati district of Manipur – Mao-Maram, Paomata and Purul (henceforth, the three sub-divisions) – that are located close to the state’s border with Nagaland reported unusually high population growth rates over two decades (1991–2011) that doubled their population shares in the state (Fig. 4). The share of child population and child sex ratio (i.e., the number of females per 1000 males in the age group 0–6 year) also changed abnormally in these sub-divisions [7, p. 10]. The abnormalities were linked to political-economic factors, which, however, did not find mention in the reports issued by the ORGI. In fact, as discussed below the ORGI issued a series of mutually inconsistent reports and notes both after 2001 and 2011 censuses that confused even official statisticians.18
After the 2001 Census, the ORGI first released the Provisional Population Totals including data for the three sub-divisions as per actual enumeration. These figures suggested that the population growth rate of the three sub-divisions of Senapati exceeded 120 per cent [7]. When objections against abnormal population figures grew, the ORGI excluded the three sub-divisions from its reports [35]. The ORGI noted that it rejected the enumerated data “due to administrative and technical reasons although the [2001] population census was carried out in the sub-divisions as per schedule” [19]. The exact reasons were never spelled out though. Later, the ORGI again included the three sub-divisions but instead of the enumerated population it used estimated figures according to which all three sub-divisions grew at the rate of 39 per cent [36]. So, three different estimates of Manipur’s population were released without clarifying their inter-relationship let alone the reasons for releasing multiple estimates. The methodological notes about the estimation procedure were not released either, which is problematic because the procedure is not self-evident and cannot be inferred unless the researcher is familiar with the local political contestations around the census [7].
The three sub-divisions reported very high populations in the 2011 Census as well. This time the ORGI withheld the enumerated figures due to “administrative reasons” and straightaway released estimated figures that suggested a growth rate of 23.8 per cent [40]. Later the ORGI released the enumerated figures as “finalized” figures that suggested a growth rate of more than 100 per cent [48]. Once again the ORGI explained neither the administrative reasons, nor the estimation procedure. Moreover, the relationship between the multiple figures for 2011 as well as their relationship with the multiple figures for 2001 were left unexplained even though different combinations of figures yield widely different growth rates [[7]: Table1]. Unsurprisingly, even census officials find it difficult to navigate through the web of mutually inconsistent figures. As per the 2011 District Census Handbook, the population growth rate of Senapati was 206.1 per cent [51, p. 34]. This abnormal estimate is explained by the fact that the handbook used the 2001 population of Senapati excluding the three sub-divisions and the 2011 population including these sub-divisions [7, p. 1].
Jammu and Kashmir
In erstwhile Jammu and Kashmir, the third state under consideration, a major problem relates to the lack of background information about the political and weather conditions prevailing at the time of the census. Three points are noteworthy in this regard. First, the state has large areas that remain under heavy snow during the household phase of census in February. So, in such areas, the Household census is usually conducted in the preceding September immediately after the Houselisting and Housing census. Recent census reports do not provide adequate information about enumeration in snow bound areas that are covered non-synchronously. The population share of non-synchronous areas is, for instance, not known and is difficult to calculate for recent censuses in the absence of the General Population Tables and Administrative Reports. Moreover, census reports do not clarify how figures from synchronous and non-synchronous areas are added to arrive at state and national level aggregates. Earlier census reports discussed snow bound areas at length. For instance, census reports for the 1961 Census provided information on the population of the snowbound areas as of 01 October 1960 [30, p. 39] as well as the adjusted population of these areas as 01 March 1961, i.e., the standard reference date for the synchronous census [27, p. vii].19
Second, post-1981 there is lack of information about the accounting of those who have been counted in non-synchronous areas before snowfall but migrate to non-snow bound areas by the time household census is held there. Once again earlier census reports carried detailed notes in this regard.
Third, given the uncertainties of weather and political disturbance the actual and declared reference dates can vary enormously between Kashmir and snowbound areas of Jammu, on the one hand, and the plains of Jammu and the rest of the country, on the other. A change in reference date impacts population distribution due to the seasonal migration of the large grazing communities between hills and plains and the shift of the state capital between Jammu and Srinagar (Kashmir) that entails en masse relocation of sections of the bureaucracy, the political class and private contractors and service providers related to the government.
These gaps in metadata have serious implications for the politically surcharged debate on population in Jammu and Kashmir because shifting reference date, weather, and intensity of political disturbance results in changes in population distribution in the state across censuses that are unrelated to demographic factors. This aggravates zero sum contests over the allocation of legislative assembly seats and state resources between almost entirely Muslim Kashmir Valley and largely Hindu Jammu.
Decline in child sex ratio, Jammu and Kashmir (2001–11). Notes: (i) ‘J&K’ stands for the erstwhile Jammu and Kashmir. ‘Jammu’, ‘Kashmir’ and ‘Ladakh’ refer to the three divisions of the erstwhile Jammu and Kashmir. (ii) ‘max’ and ‘min’ refer to district extrema within respective regions. (iii) ‘Child sex ratio’ is the number of females per 1000 males in the age group 0–6 year. (iv) ‘Decline in child sex ratio’ is the drop in 2011 with respect to 2001. Source: Various census reports.
As a result of this competition, which precipitated the manipulation of census in Kashmir, the child sex ratio of Jammu and Kashmir dropped far below the national average and it reported the lowest child sex ratio in the entire country (Fig. 5). In the preceding decades the state had reported child sex ratios that were consistently better than the national average. Guilmoto and Rajan rule out undercount in earlier decades and increase in fertility as factors that could explain the anomalous changes in the state’s population [55]. They argue that overreporting in Kashmir mostly took the form of reporting non-existent children as fewer columns have to be filled for lower age groups, which explains the unexpected increase in the share of child population. Given the patriarchal nature of the society, more non-existent boys than girls were reported, which skewed the child sex ratio.20 The ORGI did not comment on this phenomenon even after researchers drew attention to the anomalous nature of statistics on child sex ratio. The overreporting of male children in Kashmir is not an isolated phenomenon. During fieldwork in the state of Manipur, the author learnt from government officials that they had detected similar overreporting of non-existent male children in certain hill districts.
National Sample Surveys are the most widely used source of household-level socio-economic statistics for India. These surveys use the decennial census as the sampling frame. The NSS reports do not provide adequate metadata for understanding the sampling frame. The frame and sample non-coverage (i.e., percentage of population not covered by survey)21 have changed quite a bit across survey rounds in peripheral states of India, where difficult terrain, uncertain weather conditions and political turmoil are important determinants of access to the field sites (Fig. 6). In the absence of information on these changes, inter-temporal comparisons are not reliable. Examples from each of the three states under consideration will help understand the nature and implications of the deficiency in metadata.
Non-coverage in National Sample Surveys. Sources: Prepared using [[3]: Table 1]. Notes: (i) The degree of non-coverage is expressed in percentage on the vertical axis and captures the fraction of population not covered in survey. (ii) The terminal points of the graphs vary depending on the onset of insurgency and the availability of data.
Some of the recent rounds of the National Sample Survey have excluded three subdivisions of Senapati district from Manipur’s sampling frame. This crucial fact was not mentioned in the relevant reports. Other NSSO documents that note this fact do not specify the reasons behind the exclusion.22 This affects intertemporal comparisons because depending on the census used as the sampling frame the excluded areas accounted for nearly 5 to 10 per cent of Manipur’s reported population and 17 to 24 per cent of the state’s reported tribal population [7].
In case of Jammu and Kashmir, users of the data seldom note that only one of the four NSS regions of the state was fully covered regularly since the 1980s because the NSSO does not clearly identify the omissions and the changes across survey rounds in this regard. The reason for high levels of non-coverage since the 45th round (1989–90) is tersely described as “unfavourable field conditions” (NSS Report Nos. 407: 2; 436: 1; 476: 1; 481: 2), “unavoidable circumstances” (NSS Report No 407: 18), “unfavourable field conditions” (NSS Report Nos. 442: 1; 448: 2; 453: 1), “disturbed conditions” (NSS Report No. 505: 7) and “[sample units fell in] disturbed areas” (NSS Report Nos. 490: 4; 505: 7; 508: 3). In reality, sustained and high levels of armed insurgency not only disturbed the field conditions, but also forced the survey staff to migrate from Kashmir to Jammu. It also bears emphasising that the NSSO reports do not discuss how the snow bound areas of Jammu and Kashmir that remain inaccessible for more than four months are covered.
The NSSO reports are deficient vis-a-vis metadata for Nagaland in several ways. First, the NSSO uses the census as the sampling frame without critical scrutiny and ends up misunderstanding it. As discussed above the 2001 Census of Nagaland was deeply flawed, a fact that is not even noted in passing in the NSS reports let alone examined for the implications of uneven changes in content and coverage errors for survey design and findings. The lack of attention to census qua sampling frame shows up in the NSSO’s misunderstanding of the absolute decline in Nagaland’s reported population in 2011, when the accumulated errors from past census were partly corrected. The NSSO misunderstood the anomalous changes in the reported population as the onset of contraction in population and extrapolated the rural population accordingly (NSS Report No. 564: Appendix C).
Second, a longer term deficiency in NSSO metadata for Nagaland relates to opacity in the definition of sampling frame. NSSO operations in rural Nagaland were initially restricted to within 5 kilometres of bus routes. The NSSO justified this restriction until recently on ground of “inaccessible conditions” without clarifying why similar restrictions did not apply to other equally inaccessible states. In all likelihood, “inaccessible” is a euphemism for armed insurgency. Further, NSSO reports do not identify the source of information on bus routes and distance of villages from those routes without which it is difficult to explain why despite an expanding bus transport network the number of villages in the sampling frame for Nagaland remained unchanged for nearly a decade and a half leading up to 2004 [5, pp. 255–257].
Third, the difference between the census and the NSSO in terms of the population share of Scheduled Tribes remains unexplained in NSSO reports [5, pp. 255–257]. Fourth, the NSSO does not provide the estimates of the population share of areas excluded from the sampling frame, which impedes assessment of the reliability of data.
The lack of metadata has meant that policymakers do not have any caveat in front of them when they use the data. Various expert groups on poverty used the flawed data on Nagaland and arrived at erroneous estimates of the incidence of poverty. These estimates suggest that insurgency hit and remote Nagaland had the lowest incidence of poverty in the country despite having the highest poverty line. The estimates also suggest that the incidence of poverty increased after the insurgency subsided, which is contrary to expectations because of the increase in economic activity after ceasefire between the government and insurgent groups. This did not attract the attention of either expert groups or policymakers. The incidence of poverty increased because the poorer regions of Nagaland that were not surveyed earlier were gradually included in the sample [5, pp. 269–273]. Similarly, poverty estimates for Jammu and Kashmir are erroneous.
The paper began with a comparative discussion on the understanding of metadata in some of the recent government policy documents before examining the quality of metadata for three key government sources of information including maps, censuses and National Sample Surveys. The discussion revealed that the growing sophistication in the understanding of metadata is unexpectedly accompanied by a marked decline in the availability as well as the quality of metadata.23 The usability and interpretability of the key government sources of data discussed in the paper is limited due to the lack of adequate metadata not only on conceptual and quality aspects but surprisingly also on methodological aspects including the geographical scope and method of estimation of missing values or correction of collected data.
The growing marginalisation of commentaries and qualitative data which used to be major sources of metadata in statistical reports has several consequences. First, in the absence of explicit recognition of the importance of metadata, the necessary information for any census or survey is scattered across different reports. Since most users do not have access to all the reports or even if they have access they do not know that the information is found in bits and pieces in different places, they fail to account for all the available metadata in their analyses.24
Second, metadata from earlier rounds are often not compiled in the latest reports despite implications for inter-temporal comparisons. While calculating the growth rate of various religious groups between 1991 and 2001, the ORGI forgot to account for the fact that Jammu and Kashmir, where the majority of the population is Muslim, was not covered in the previous census and ended up overestimating the growth rate of Muslims [11, p. 370].
Third, “[u]nannotated data conceal theoretical, ideological and departmental biases and lapses as well as the larger context in which data are located” [5, p. 291]. However, given the growing delays in the release of census data [6], the declining supply of metadata has meant that independent field verification is becoming increasingly difficult. For instance, the 2011 data on language were released seven years after enumeration [6]. Researchers found it difficult to verify sharp changes in speakers of language in the field because the population distribution had changed over the years due to migration. Qualitative observations that would have illuminated the conditions prevailing at the time of enumeration, say, linguistic activism around the time of census, were not available either. This was not the case earlier. For instance, the Administrative report for the 1961 Census informed the users that in Jammu and Kashmir the partisans of the Dogri language were active from around the time of houselisting phase of the census and so were caste activists [26, p. 27]. The 1961 General Report for Manipur discussed at some length the difficulty people faced in understanding the language and religion questions [28, pp. 136,147,159].
Fourth, the census authorities do not provide any discussion on the implications of the information contained in the barebones metadata. As a result of this, users, including official statisticians, often end up missing or misunderstanding the metadata. Official statisticians wrongly estimated the population growth of Nagaland during 1951–61 [40, p. 165] and Manipur’s Senapati district during 2001–11 [51, p. 34]. Most researchers overlook the change of reference date in 1971 and end up overestimating the 1961–71 growth rate.25
Fifth, as pointed out above the poor quality of metadata impairs cross-sectional and inter-temporal comparisons. The case of Manipur’s census highlights the importance of coherence and comparability of data which in its case were severely impaired due to inconsistent methods of estimating the headcount of the administrative units where field operations were hindered [7].26 Likewise, the National Sample Surveys conducted in Jammu and Kashmir and Nagaland using flawed sampling frames result in abnormal fluctuations in their rankings among states according to poverty rates [5, p. 272]. The NSSO ought to devise standards for the quality of its frame and supply metadata that will help ascertain the quality particularly from the perspective of comparability in states where sampling frame changes over time.27
Sixth, where statistical agencies are caught between governments or government departments that have conflicting statistical preferences and objectives, they should have the autonomy28 to arrive at estimates without the interference of either party and provide metadata that would let the users understand the context. At present, in cases like Assam-Nagaland border conflict the Directorates of Census Operations follow the borders recognised by the respective state governments, which causes double counting apart from distorting population density estimates and sub-state borders [5, pp. 71–76]. In other cases, however, the census presents counts as per the borders claimed by the two sides and explains the differences between the estimates [5, p. 69]. The lack of uniformity of metadata released for different states often in the same round is problematic [5, pp. 67–68].
Seventh, the deficiency in metadata for key sources of data such as census and National Sample Survey affects the entire government statistical system including the national accounts29 and this eventually affects policymaking. The deficiencies in metadata for National Sample Survey result in errors in the estimates of consumption expenditure and poverty line, which in turn affect estimates of poverty rate used extensively by policymakers. Published data are often uncritically used without any correction as either policymakers are constitutionally or legally bound to do so or they fear delays in case data quality is questioned.30 The Finance Commission is, for instance, bound to use census data and projections based on that data. Policymakers can at least, add cautionary notes to alert users further downstream, but that would potentially open them to political attacks and lawsuits. It seems concerns about data quality are best handled in the metadata section of official reports as it was done in the past. Critical notes in official statistical reports will allow policymakers to build alternative scenarios and suggest a range of options to lawmakers.
Eighth, our discussion suggests that, on the one hand, developing countries including India are adopting global standards promoting data quality but, on the other hand, there has been a steady decline in the institutional processes governing data quality (see also Footnote 23). In other words, a mechanical convergence of standards without attention to statistical institutions creates an illusion of progress amidst decline. In several developing countries, there is a big gap between stated commitment to global standards and grassroots where implementation is difficult due to a variety of social, political and economic reasons. Guilmoto and Irudaya Rajan draw attention to the “volatile confrontation …between enumerators equipped with tools that are presumed all-terrain and context-free, and myriads of agents actively promoting their local social and political agenda through this encounter” [55, p. 69]. This tension manifests itself in the poor quality of metadata as the statistical agencies find it difficult to climb down from the lofty standards they aspire to. While it is true that merely highlighting the difficulties in data collection and processing through metadata will not automatically address the root cause of the problem, brushing aside the problem forestalls reforms. Revealing the problem through metadata and qualitative reports will hopefully trigger debate in an open society and build consensus for reforms.
Footnotes
For the wide range of qualitative reports released by the Census of India in the first two decades after independence see [66, ![]() ].
].
The number of questions in the household schedule of census doubled between 1951 and 2011 [20], while the tables generated doubled between 1961 and 1991 [63, p. 180]. In other words, the quantitative component of reports expanded even as the space for commentaries reduced. The long term trend of the marginalisation of commentaries can perhaps be traced back to the formative period of modern statistics [see, for instance, [73, pp. 35–37]]. The practice of international agencies to receive unannotated data electronically from national authorities reflects this trend. In his study on national accounts of Sub-Saharan countries, Jerven [58, p. 23] points out that “It is not clear from the World Bank database whether or when these data are official, official preliminary data, projections based on previous country performance, projections based on performance of neighboring countries, or conjectures based on “expert” advice.” This information should have been readily available in country specific background notes. But the World Bank admitted that it received unannotated national account data in the form of “electronic files either from the Country offices or from the IMF [International Monetary Fund]” [58, p. 98]. The IMF, in turn, admitted that it received data “electronically” from country authorities and that it does not keep “statistical bulletins or any national source publications” [58, p. 98]. See [65] for a similar discussion about the treatment of data in the reports published by the Food and Agricultural Organisation (FAO). Special Data Dissemination Standard (SDDS) Plus introduced by the IMF in 2012 has addressed some of the aforesaid problems by stressing the importance of good quality metadata and specifying standards for the same [![]() ].
].
The terminology used for describing different dimensions of data quality is borrowed from Biemer [![]() , p. 819], who presents a framework to assess the quality of survey data. He identifies accuracy, precision, credibility, comparability, usability/interpretability, relevance, accessibility, timeliness and completeness as important dimensions of data quality.
, p. 819], who presents a framework to assess the quality of survey data. He identifies accuracy, precision, credibility, comparability, usability/interpretability, relevance, accessibility, timeliness and completeness as important dimensions of data quality.
Discussions on the quality of National Sample Surveys have mostly focussed on accuracy and comparability [3, 15, 59, 64, 77, 79, 80], with lesser attention being given to other dimensions such as usability/interpretability. There are very few studies on the quality of India’s cartographic data from the perspective of usability/ interpretability [![]() ].
].
On 5 August 2019, the former state of Jammu and Kashmir was bifurcated into the union territories of Jammu and Kashmir and Ladakh. Since the analysis is restricted to the pre-2019 period we will work with data for the undivided state.
It is difficult “to identify metadata just by looking at it because a user would not know when data is metadata or just data” [43, pp. 40–41]. According to OECD [![]() , p. 480], “data become metadata when they are used in this way. This happens under particular circumstances and for particular purposes, as no data are always metadata. The set of circumstances and purposes (or perspective) for which some data are used as metadata is called the context. So, metadata are data about data in some context.”
, p. 480], “data become metadata when they are used in this way. This happens under particular circumstances and for particular purposes, as no data are always metadata. The set of circumstances and purposes (or perspective) for which some data are used as metadata is called the context. So, metadata are data about data in some context.”
Draft proposals circulated among statistical agencies do, however, include information about the legal-administrative dimension under metadata. For the proposed Common Minimum Metadata Indicators (CMMI) along the lines of the Data Quality Assurance Framework (DQAF) of the IMF, see Agenda for the 26th Conference of Central and State Statistical organisations during 15–16 November, 2018 available at
Note that the Indian constitution assigns ‘census’ to the union list that makes the union government responsible for conducting the decennial exercise (Constitution of India, Schedule VII, Item No. 69; also Census Act, 1948, Section 3). So, maps included in census reports depict the position of the union government. The Nagaland GIS & Remote Sensing Centre is under the state government and reflects its position. The multiplicity of conflicting maps issued by different tiers of the governments has been explained as a manifestation of the scalar competition within the union [2, ![]() ].
].
This anomalous situation is explained by ethno-territorial conflicts within Nagaland as well as inter-state territorial conflict between Assam and Nagaland. The latter has an impact because Nagaland has encroached upon the territory of Assam but shows new administrative units created in the disputed territory within its constitutionally accepted borders to avoid censure in court. This results in a reduction of the size of administrative units that actually lie within the constitutionally accepted borders to accommodate those that lie outside [![]() ].
].
Administrative reports covering enumeration and tabulation used to be released by the Directorates of Census Operation of each state after every decennial census. These reports offered a detailed account of the actual administrative process of conducting the census covering the period since the appointment of the director. The details offered include official correspondence, government circulars/notices, budget, field tours, meetings with union level census officials, awareness programs, experience of enumerators, difficulties faced and suggestions for future censuses, political mobilisations around the census, peculiar cases recorded during census, etc. General Population Tables were also released after every census and offered a wealth of qualitative information including about the spatial aspects such as inter-censal territorial realignments, changes in the classification of rural and urban areas and interstate border disputes. Other helpful publications that used to be made available earlier include the proceedings of the Conferences of Directors of Census Operations that helped understand the administrative difficulties and inter-state differences in this regard. In absence of descriptive reports, researchers who want to go behind the census numbers must locate officers who conducted the census. This is cumbersome, particularly, because of the growing delays in the release of census reports [![]() ].
].
Chakhesang Public Organization and Others vs. Union of India and Others). 2006. WP (PIL) No. 67 of 2006. Gauhati High Court.
At least, one correction after the 2001 and 2011 Censuses can be attributed to political interference. The confusion arising out of multiple conflicting reports can possibly be mitigated if the census followed a pre-decided release calendar without political interference. Provisional targets for the publication of main reports were set in advance in some of the earlier censuses [see, for instance, [82, p. 206] for the 1971 Census]. The standards have deteriorated enormously since then with most data for the 2011 Census being released after enormous and unjustified delays that too as Microsoft Excel files without any mention of the official date of release [6, p. 219]. The proposed National Policy on Official Statistics, though, recognises the importance of “pre-announced calendar, free from Government influence” [![]() , p. 5.1.7].
, p. 5.1.7].
The procedure followed for adjusting the 01 October 1960 population to 01 March 1961 is not mentioned in the relevant census reports though.
Guilmoto and Rajan argue that “the apparent surplus in demographic growth and fertility rates could have proceeded instead from a deliberate over-reporting of children in Jammu and Kashmir. The fear of a census conspiracy to inflate Jammu’s population could have induced people in the rest of the state, especially in the Kashmir Valley, to overstate their own household population by adding non-existent children. In this hypothesis, many people in the Kashmir region would have resorted to a systematic exaggeration of their household population in order to boost the overall share of this region within Jammu and Kashmir. Adding nonexistent children to one’s family is probably the easiest procedure to inflate a population total during the census, since there are far less columns to fill up in the questionnaire …Incidentally, sex ratio levels suggest that in trying to inflate their child population, many households seem to have invented boys rather than girls – as if reporting non-existent boys was easier or more spontaneous” [![]() , p. 63].
, p. 63].
See ‘Note on Sample Design and Estimation Procedure’ for the 63
There has been another similarly counterintuitive development in case of India’s government statistics. Data delays have grown in India amidst significant improvements in data processing technologies [6]. For improvements in data processing technologies used in census see [8, 14] and for maps see [![]() ].
].
The draft of the National Policy on Official Statistics, in fact, notes that “Some of the users use compiled/aggregate statistics on a daily basis, some use disaggregated and micro data, and some use occasionally without looking at metadata.” [[![]() , p. 20], emphasis added]. Under such circumstances, scattering the metadata will result in their disuse.
, p. 20], emphasis added]. Under such circumstances, scattering the metadata will result in their disuse.
In the post-independence period, the reference date for census has been changed twice. First, in 1971 the reference date had to be shifted from the 1st March to 1st April “to avoid clash with mid-term Parliamentary Election [in March]” [20, p. 5]. Later censuses reverted to the usual reference date. Second, the reference date was changed from Sunrise of 1 March to 00.00 hours of 1 March in 2001. Only the first change will significantly affect inter-temporal comparisons as there were 121 months between the 1961 and 1971 censuses and only 119 months between 1971 and 1981 censuses. This fact is widely ignored. For instance, according to Panandiker and Umashankar India’s population growth rate was 2.25 per cent per annum during 1961–71 [![]() , p. 89], whereas the actual growth rate was 2.22 per cent.
, p. 89], whereas the actual growth rate was 2.22 per cent.
The proposed Common Minimum Metadata Indicators (CMMI) stresses the importance of “Ensuring temporal and cross sectional consistency” (5.6) and “Comparison with alternative data” (5.7) (see Footnote 12 for further details).
For recent debates in India on the autonomy of statistical agencies see [4, ![]() ].
].