
Abstract
This paper proposes three robust estimators (M-estimation, S-estimation, and MM-estimation) for handling the problem of outlier values in seemingly unrelated regression equations (SURE) models. The SURE model is one of regression multivariate cases, which have especially assumption, i.e., correlation between errors on the multivariate linear models; by considering multiple regression equations that are linked by contemporaneously correlated disturbances. Moreover, the effects of outliers may permeate through the system of equations; the primary aim of SURE which is to achieve efficiency in estimation, but this is questionable. The goal of robust regression is to develop methods that are resistant to the possibility that one or several unknown outliers may occur anywhere in the data. In this paper, we study and compare the performance of robust estimations with the traditional non-robust (ordinary least squares and Zellner) estimations based on a real dataset of the Egyptian insurance market during the financial year from 1999 to 2018. In our study, we selected the three most important insurance companies in Egypt operating in the same field of insurance activity (personal and property insurance). The effect of some important indicators (exogenous variables) issued by insurance corporations on the net profit has been studied. The results showed that robust estimators greatly improved the efficiency of the SURE estimation, and the best robust estimation is MM-estimation. Moreover, the selected exogenous variables in our study have a significant effect on the net profit in the Egyptian insurance market.
Keywords
Introduction
The Seemingly Unrelated Regressions (SUR) or Seemingly Unrelated Regression Equations (SURE) model is proposed by Zellner [1, 2], where the main assumption of this model that the errors of the model are related by contemporaneous correlation, see [3, 4]. The generalization of the linear regression model that consists of several regression equations, each has its own dependent variable and potentially different sets of exogenous explanatory variables. Each equation is a valid linear regression on its own and could be estimated separately. The SURE model is a special case of simultaneous equations models; where there are no endogenous variables appear as regresses in any of the equations. That is why the system was called seemingly unrelated, although some authors suggested that the seemingly related term would be more appropriate, since the error terms were assumed to be correlated across the equations. Each equation satisfies the assumptions of the classical linear regression model. The SURE model could be viewed as either the simplification of the general linear model where certain coefficients in matrix B were restricted to be equal to zero, or as the generalization of the general linear model where the regressors on the right-hand-side could be different in each equation, see [5, 6].
Many studies in economics, insurance, and finance are based on regression models which contain more than one equation. Unconsidered factors that influence the error term in one equation are also influence the error terms in other equations. Ignoring this dependence structure of the error terms and estimating these equations separately using Ordinary Least Squares (OLS) estimator leads to inefficient estimates. Therefore, the SURE model has been developed which considers the underlying covariance structure of the error terms across equations. The assumption of SURE model is developed in several econometric applications (or models), such as panel data models and related fields, see [7, 8, 9], and many more.
The Zellner’s estimator of the SURE model depends on the data without any outliers, but in some cases this cannot be achieved. If the dataset contains outliers and influential observations, the Zellner’s estimator is not efficient. The robust estimation methods are considered one of the most important approaches to deal with outliers, which allowed the unequal weight for observations. Robust regression analysis provides good alternative estimators for Zellner’s estimator, when the classical assumptions are not fulfilled, see [10]. The robust estimation methods are discussed in many papers for several regression models, such as count regression model [11], semiparametric partially linear model [12], and others.
The insurance sector in Egypt is one of the most important non-banking financial services activities and the most prominent contributor to the Gross Domestic Product (GDP), as it contributes a large percentage to it. Also, it is closely related to the rest of the economic sectors, and it contributes to managing the risks that may be exposed to economic assets. Kelly et al. [13] investigated the impact of automobile insurance regulation on the size of the involuntary insurance market as well as the level and volatility of auto insurance loss ratios in Canada. They also used SURE model to model this endogeneity, they found that rate reduction orders, product reform, and a pricing “Grid” that established maximum premiums increase the size of the involuntary market, while prior approval does not have any significant effect, unlike U.S. studies, they found that prior approval does not significantly impact loss ratio volatility. Also Tan and Floros [14] investigated the inter-temporal relationship between banking profitability, competition and risk of a sample of Chinese commercial banks by employing several profitability and risk indicators, and using SURE model under a panel data framework. The results support the Structure-Conduct-Performance (SCP) theory which states that there is a negative impact of competition on bank profitability.
This paper is organized as follows; Section 2 presents a background about the SURE model, and some non-robust estimation methods of this model. While in Section 3, we review three robust estimation methods of the SURE model. The results of the application have been presented in Section 4. Finally, Section 5 offers the concluding remarks.
SURE model specification and estimations
The SURE model is a system of
The specification of the basic SURE model was proposed by Zellner [1], for the first time as one of his wonderful and successful scientific contribution remains an important option in any modeling exercise using pooled data, under the assumption that the errors of the model are related by contemporaneous correlation. Zellner’s [2] developed the SURE estimator for estimating models with dependent variables that allow for different regressor matrices in each equation, e.g.
This multiple equation can be simply re-written compactly as:
where the
Second, the SURE model can be rewritten as:
where
A1:
where
A2:
A3:
Under A1–A3 assumptions, we can apply the OLS on Eq. (2) to estimate
It is well-known that OLS estimator is consistent, but it does not take into account the correlation structure of the disturbances across equations. Consequently, it is generally less efficient, and may yield inefficient estimators. The Generalized Least Squares (GLS) estimator (also known as Zellner’s estimator) is a modification of least squares that can deal with any type of correlation, including contemporaneous correlation, Zellner’s estimator is efficient and also fulfill the maximum likelihood requirement. Because it given best linear unbiased estimators (BLUEs). For the SURE model, the Zellner’s estimator takes:
The variance-covariance matrix of the Zellner’s estimator is given by
Zellner’s estimator is efficient and fulfill the maximum likelihood requirement. Zellner’s estimator is more efficient than the OLS estimator, but in most situations the covariance
Consequences of outliers in SURE model
In econometrics and statistics, the SURE model has taken an important place. However, since the procedure proposed originally by Zellner is essentially a least squares estimator in a multiple equations model with a particular covariance matrix, it is expected that the estimator is vulnerable to outliers. In practice, data collected in a broad range of applications frequently contains one or more atypical observations called outlier. An exact definition of an outlier often depends on hidden assumptions regarding the data structure and the applied detection method. Yet, some definitions are regarded general enough to cope with various types of data and methods. Hawkins [18] defines an outlier as an observation that deviates so much from other observations as to arouse suspicion that it was generated by a different mechanism. They can occur by chance in a distribution but are mostly indicative of measurement error which one can decide to discard or use statistics that are robust. Moreover, the effects of outliers may permeate through the system of equations; the primary aim of SURE which is to achieve efficiency in estimation is therefore questionable; see [19].
There are two categories of outliers; the first category includes the outliers in Y-dimension (endogenous variable) that are defined as “vertical outlier”, the second category includes the outliers in X-dimension (exogenous variable) these observations are called “leverages points”. Detecting or diagnosing outliers is a very important process in multivariate linear models especially the SURE model which is a special case of these models, and it is statistics that focuses attention on observations having an influence on Zellner’s estimator, which is known to be non-robust, see [20]. Many diagnostic measures have been designed to detect individual case or group of cases that may differ from the bulk of multivariate dataset, such as, graphical analysis, Mahalanobis Distance (MD), studentized residual, Cook’s Squared Distance (D
Robust estimators are tried to seek a model which represents the information in the majority of the dataset. Usually we use the properties of efficiency, the Breakdown Point (BDP), and the influence function, see [22] to measure the performance of robust techniques. BDP is the most common method to measure robustness. The BDP is the largest proportion of the contaminations that the data can contain before the estimate fails. Thus the higher the BDP of an estimator, the more robust is. Intuitively, a BDP cannot exceed 0.5 because if there more than half of the data are outliers, it will be impossible to distinguish between the “good” and “bad” distributions. Therefore, the maximum BDP is 0.5 which is the goal of robust estimation, thus 0
M-estimation method
Koenker and Portnoy [24] introduced the M-estimation method of the multivariate linear models; these weighted M-estimates achieve an asymptotic covariance matrix analogous to that of the SURE estimator. They proposed to apply a regression M-estimator, based on a convex loss function, to each coordinate of the response vector. The M-estimation method is a generalization to ML method in context of location models. That is nearly as efficient as traditional methods such as OLS and Zellner as the objective; M-estimation method principle is minimizing the residual function M-estimation is based on residual scale of Zellner’s estimator, see [25]. It can be introduced the M-estimation method for the context of SURE model.
Where the minimization is over all
Condition 1.
Here the constant
Where
For fixed
where
In fact, the BDP of M-estimates is
We introduce S-estimator to deal with outliers for the SURE model as proposed by Bilodeau and Duchesne [29]; S-estimator has been generalized to multivariate estimation of position and dispersion by Davies [30] and Lopuhai [31]. The aim is then to estimate the multivariate location and the scatter matrix of a
Starting from the initial M-estimates, the S-estimates are calculated easily by iterating these estimating equations until convergence. Hence, S-estimator can attain the maximal BDP of 50%. S-estimator with a smaller value of
MM-estimation method
Peremans and Van Aelst [35] proposed the MM-estimator in the context of SURE model, by combining S-estimation with M-estimation. The initial estimate is a high BDP estimate using S-estimator. The second stage computes an M-estimate of the errors scale from the initial high BDP estimate residuals matrix. Also, they showed that MM-estimator is highly efficient, and not sensitive to leverage points compared to an M-estimator, see [36].
Let
The MM-estimation addresses outliers in both the endogenous and the exogenous variables; MM-estimator inherits the BDP of the initial S-estimator. Hence, they can attain the maximal BDP if initial high-BDP S-estimator is used, see [37]. Recently, Abonazel and Rabie [38] studied the efficiency of some robust estimators with application on the Egyptian economy, and they concluded that the best robust estimator is MM-estimator. These estimates have both a high BDP that is 0.5 and high asymptotic efficiency under Gaussian errors. They proved consistency and asymptotic normality assuming errors with an elliptical distribution. Note that while MM-estimator has maximal BDP, there is some loss of robustness because of the bias as a result of contamination that is generally higher as compared to S-estimator.
Empirical study
The present research aims to an overview of Egyptian insurance market with a real dataset application. The insurance industry started in the second half of the 19
In Egypt, the insurance industry plays a vital role in supporting the economy and growing national investments. It provides financial protection for individuals and projects against different risks through its ability to transfer risk through risk pooling and its overall role in risk management. It frees individuals from dependence on families or communities in case of an adverse event. More importantly, poor families or communities may lack means for “self-insurance.” Insurance thus provides an efficient mechanism to protect people from falling into poverty as a consequence of an adverse event. Besides protecting individuals, by providing essential coverage to businesses. Insurance promotes trade and economic activity. Insurers also contribute to capital formation by collecting Premiums from a large number of policyholders and building capital to back risk. Further, it is a main channel for collecting and using national savings in financing national investments and development plans, making available new job opportunities and alleviating the impacts of inflation. Also, the insurance sector is one of the most important non-bank financial services activities and the most prominent contributor to GDP. It is worth noting that the financial results for the year 2018 indicate that the contribution of the insurance sector to the GDP reached 0.9%. The rate of growth in insurance premiums reached 19% during 2018. The number of corporations operating in this sector reached 40, see [40].
Data
As an empirical application, this paper is concerned with studying the significant impact of the robust estimators above on a real dataset. This data is obtained from the FRA and “Central Agency for Public Mobilization and Statistics” (CAPMAS) in Egypt. Through the annual statistical report on insurance activity during the fiscal yearfrom 1999 to 2018, see [40].
In our study, we have relied on selecting the three largest insurance corporations in Egypt are active in the same field of insurance activity, which is represented by Personal insurance and Property insurance. They are; Misr Insurance Corporation (MINC), Suez Canal Insurance Corporation (SCIC), and Mohandas Insurance Corporation (MOIC). The dataset is limited by the amount of information available for each insurance corporation. One may expect that within the same year the activities of one corporation can affect the others. Hence, the SURE model seems to be appropriate. Unfortunately, the classical and robust estimators of the covariance matrix become singular when all insurance corporations are considered. Therefore, we only focus on the measurements of three insurance corporations and thus their activities can highly influence each other. Since the interest is in modeling dependencies between the corporations within the same year, a SURE model with three blocks is considered. We selected a variety of variables that are the most important indicators issued by insurance corporations; the endogenous variable is the Net Profit for the Year, see, e.g., [41, 42, 43]. While the exogenous variables, in our study, include the Net compensation, the rate of issued reinsurance commissions, the general and administrative expenses rate, commission rate and production costs, and Loss rate.
Our methodology
In our application, we used the SURE model to examine the impact of some selected variables on the net profit in three insurance corporations in Egypt. Since the Zellner’s estimator for the SURE model is based on the classical covariance matrix, and it is well known that outliers in the data can severely influence classical estimators and their modifications are all very sensitive to outliers in the data. Hence, OLS and Zellner estimators are expected to yield non-robust estimates, and then we should use the robust estimators.
After descriptive statistics, and investigate the correlation among variables through correlation matrix for the dataset, we will during in analysis do the following steps:
Using non-robust (OLS and Zellner) estimators to estimate the SURE model. Testing the contemporaneous correlation of the model. Diagnosing (testing) the outliers, normality of the errors, multicollinearity, and heteroscedasticity problems. Using robust (M-estimation, S-estimation, and MM-estimation) methods to estimate the SURE model. In the final step, robust and non-robust estimations will be compared to select the best estimation using some goodness-of-fit criteria, see [44].
Variable names and definitions
Variable names and definitions
Some descriptive statistics
Correlation matrix and VIF values
In our application, R version 3.6.1 (“vglm” and “systemfit” packages) was used to perform the analysis, see [45]. Table 1 displays the description of the selected variables in our study, and some descriptive statistics of these variables have been presented in Table 2. In general, it can note that all variables not have large variation, because the coefficient of variation (C.V) of all variables less than one.
Table 3 presents the pairwise correlation coefficients between all variables associated with two-tailed significant t-test in parentheses. It can note that the correlation between GER and CPC is the higher correlation, while the smallest correlation is between NPY and LOR that’s in MINC. In addition, it can note that the correlation between NPY and NEC is the higher correlation, while the smallest correlation is between RIC and CPC in corporation SCIC. As in MOIC the correlation between NEC and RIC is the higher correlation, while the smallest correlation is between NPY and LOR.
As in overall corporations it is possible to notice that all variables are highly significantly correlated with each other and all less than 0.90. Moreover, the results of Table 3 indicate that the data not have multicollinearity problem1 because all the values of the Variance Inflation Factor (VIF) are less than 10 for all correlation matrices in insurance corporations.
Non-robust estimations
The estimation results using non-robust (OLS and Zellner) estimators have been presented in Table 4 it is present the values of estimated coefficients, the standard errors, and the significance of each variable. These results indicate that Zellner’s estimator have smallest standard errors Moreover, we find that there are some not significant coefficients.
Non-robust estimators results of the SURE model
Non-robust estimators results of the SURE model
Note: The superscripts
In SURE model the errors for different individual equations are contemporaneously correlated, we have seen that in the absence of contemporaneous correlation, applying the OLS method to each equation separately gives the most efficient estimators behind it, and there will be no need to use the Zellner’s estimator. For the above reason, it is important to test that contemporaneous covariance is equal to zero:
The appropriate test statistic for accepting or rejecting a null hypothesis (
Depending on the values of
Since
Based on the results in Table 5, we concluded that Zellner’s estimator is better than OLS estimator. It can note that the Zellner’s estimator has the smallest values of all goodness-of-fit measures, and higher
Goodness-of-fit measures of non-robust estimation methods
Goodness-of-fit measures of non-robust estimation methods
To check the cause of the violation SURE assumptions about normality, we do a multivariate diagnostic plots corresponding to our analysis of the dataset for analyzing the residuals of the SURE model. The method used is the residual graph vs. fitted, normal Q-Q plot, scale location, cook’s distance, MD, and boxplot. Figure 1 shows that the some observations may give you problems with the SURE model, residual vs. fitted, model valid if the dots spread around 0, and the data is not entirely spread around 0, so that the model is not valid. Scale-location, some points had a great residual value, this is indicated with a point away from the line. Normal Q-Q plot shows the residual spread not normally because there is a point not spread around that line some points are most likely an outlier of data. Moreover, the distribution of the residuals is conformed the decision of Shapiro-Wilk test; this indicates that there are outlier values in the residuals.
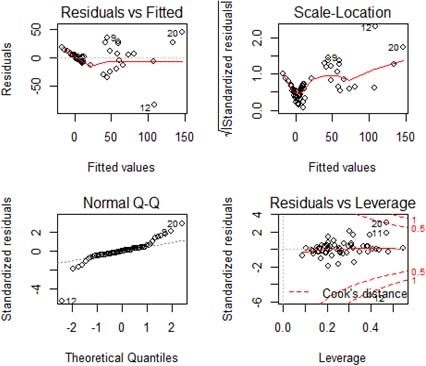
Residuals of OLS results.
In Fig. 2, the values are plotted for identifying outlier points, the outlier points are identified by MD appeared to be same as it was observed in the leverage values (
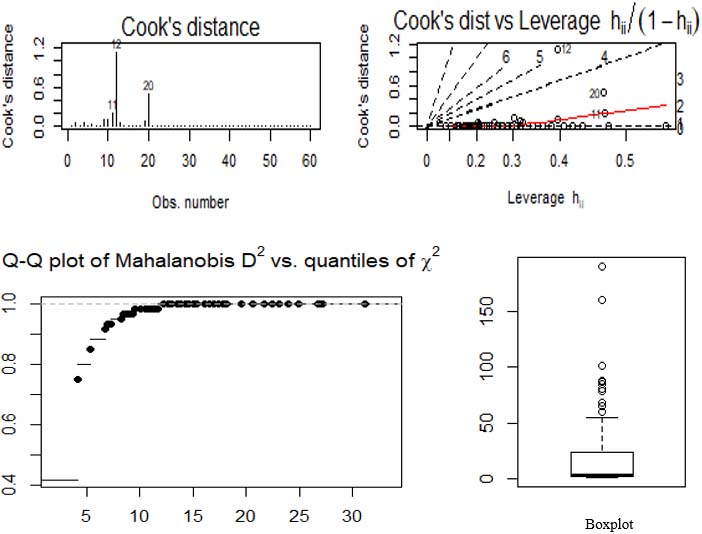
Cooks, Mahalanobis distances, and Boxplot of OLS results.
Robust estimators results of the SURE model
Note: The superscripts
Goodness-of-fit measures of robust SURE estimators
Table 6 shows that, for all robust methods, most exogenous variables are significant because the
Concluding remarks
In this paper, we have discussed some robust estimation methods for the SURE model with an empirical study on the Egyptian insurance market during the fiscal year from 1999 to 2018. The use of the robust estimation methods in the presence of outliers tends to improve the efficiency and reduce the bias compared with the non-robust (OLS and Zellner) estimation methods. The results indicate that the robust estimation methods have the smaller values of MSE, RMSE, and MAE, and higher R-squared than OLS and Zellner methods, although the data contains few outliers. The best estimation for this dataset is obtained by MM-estimation, and the selected exogenous variables in our study have a significant effect on the net profit in the Egyptian insurance market. Therefore, we recommend that non-robust methods residuals be examined, if they have outliers, than a robust estimation method should be used to get an efficient estimation In future work, the Monte Carlo simulation study can be performed to compare the different robust estimation methods for this model in different situations (different samples sizes, different number of exogenous variables, and so on), see [52, 53].
Footnotes
This problem arises when the exogenous variables are highly inter-correlated. Then it becomes difficult to disentangle the separate effects of each of the exogenous variables on the endogenous variables. As a result, the estimated regression parameters may be statistically insignificant and/or have, unexpectedly, different signs. Thus, conducting a meaningful statistical inference would be difficult for the researcher, see e.g. [![]() ] for handling and solving this problem in SURE models.
] for handling and solving this problem in SURE models.