
Abstract
The Statistical Office of the Republic of Slovenia (SURS) has a long tradition of producing and using standardized reference and quality-related metadata. Most of the surveys have to collect, analyse and disseminate this kind of information and a lot of this information is made available to different (internal and external) users. The workload became burdensome and inefficient, since this information was scattered around in different locations and in different forms, which significantly reduced its analytical power. Therefore, SURS started to develop a new, multipurpose application that would enable easier and more effective usage of reference metadata produced through the statistical process and would support the evaluation phase of our statistical business model.
The basic methodological fundaments that we have been building upon are presented in the paper. The paper describes the individual steps in the design of the application, details on the functionalities of the application and points out main challenges that we met during the development.
Introduction
The last indicator of the European Statistics Code of Practice, i.e. Indicator 15.7, states that “Users are kept informed about the quality of the statistical outputs with respect to the quality criteria for European Statistics” [1]. Being the last indicator, by chance or on purpose, it sums up one of the important added values of official statistics – the quality of official statistics matters, it should be measured and monitored, and the users have the right to be informed about it.
In 2009, the Commission Communication Re-engineering the Production Systems of European Statistics: a vision for the next decade was presented, which aimed at improving the efficiency of the statistical production. The communication emphasised the need to reform the production method of European statistics and called to move from traditionally oriented stove-piped processes [2]. The important push to better understand and standardize the statistical processes across statistical domains was the definition of the Generic Statistical Business Process Model (GSBPM) [3]. The metadata were in the first published version of the GSBM defined as an over-arching process. One of the expected results of these activities was the harmonization of the metadata, which would consequently rationalize the statistical business process, as well as enhance the quality of disseminated data within the European Statistical System (ESS) [4].
In the last decades, the Statistical Office of the Republic of Slovenia (SURS) has also put a lot of effort into the modernisation of its statistical business process. The focus has been to build the generic solutions, which could be used for different statistical domains to increase standardization of the business processes and improve efficiency, as for example the generalised solution for the specific parts of the statistical processing [5]. These activities led to the definition and the adoption of SURS’s General Process Model in 2012 [6], which was revised in 2017. SURS’s process model is based on GSBPM. Along with the adoption of the model, exhaustive Guidelines for Quality Assurance have been prepared, which are structured according to the statistical business model [7].
This article outlines the harmonization activities taking place within the European Statistical System for the implementation of the integrated structure for reference metadata. With the successful implementation of the common structure, the long wished streamlining of the European Statistics quality reports would be achieved and the principle “once for all purposes” would be implemented [8]. Success of the harmonisation activities at the conceptual level is supplemented with the development of effective technical tools that support efficient implementation of these concepts into the reality of the statistical production. The basic prerequisite for development of standardised and generalised software solutions is a firm conceptual framework with harmonised and commonly accepted definitions and calculation procedures.
The impact of the international and ESS activities is presented on the concrete example how the implementation of the standards is taken into account at the National Statistical Institute. The article presents efforts made by SURS in the last decades to be fully in line with the indicator mentioned in the first paragraph. After the first publication of the quality reports back in 2006, it became clear that quality reporting should be one of the regular tasks and that the procedures for the calculation of standard quality indicators should be standardized as much as possible [9]. The need for more efficient and automatized preparation of the quality reports was presented already at that time, but it has been just recently implemented and supported with the modern technological solution.
The standardization of metadata and quality structures in the ESS as a means to assure the quality of the official statistics
The need for standardly defined metadata and the importance to manage metadata efficiently increased with the introduction of the information systems. One of the simplest definitions of metadata is “data about data” [10]. Sundgren [11] defined statistical metadata as “data which are needed for proper production and usage of statistical data”; but more in detail, he has also defined one of the first multi-dimensional approaches to the definition of metadata. He named different metadata dimensions as projections: a syntactical projection (representation-oriented), a semantical projection (contents-oriented) and a pragmatic projection (purpose-oriented).
The ESS also uses a multidimensional approach, where the distinction between structural and reference metadata is made. Structural metadata are used to identify the structure of the statistical data (e.g. titles, subtitles, dimension names, variable names, etc.), whereas reference metadata describe statistical concepts and methodologies used for the collection and generation of data, and provide information on data quality [12, 13]. The OECD Glossary of Statistical Terms describes reference metadata as “metadata describing the contents and the quality of the statistical data” [14].
Already Dippo and Sundgreen [10] were in 2000 suggesting that in the official statistics a standard template should be defined to foster the documentation and publication of the standard metadata. The international activities in the framework of the SDMX initiative on common technical and statistical standards for the exchange and sharing of data and metadata finally led in 2009 to the adoption of the Commission Recommendation on reference metadata for the ESS [15]. The Recommendation has officially settled the Euro-SDMX Metadata Structure (ESMS). National statistical authorities were invited to report according to the ESMS structure, which was focused on users and the statistical outputs. The aim of introducing the ESMS was to harmonize reference metadata and facilitate the exchange of metadata within the ESS.
Development of the quality reporting
The modern view of the quality of official data moved from the traditionally narrow focus on the accuracy of the estimates to a broader scope of quality dimensions. A popular and widely used definition of the quality of official data is nowadays simply “fitness for use” [14, 16], where the focus of the data quality is no longer only on the extent to which the statistical data accurately describe the reality, but also on broader, user-oriented focus.
The definitions of statistical data quality dimensions vary slightly between the organizations and have developed over time. The European Statistical Code of Practice, which can be taken as one of the references for the quality dimensions, within the chapter Statistical Output refers to Relevance, Accuracy and Reliability, Timelines and Punctuality, Coherence, Comparability and Accessibility [1].
The first ESS handbook “How to Make a Quality Report” was published already in 2003 and approximately at the same time the standard quality indicators were defined and methodologically described. The need to prepare a standardized reporting structure led to the creation of the ESS Standard for Quality Reports Structure (ESQRS) in 2010 [13]. The ESQRS presented a detailed quality reporting structure, which was mainly oriented for the producers of the statistics.
Quality indicators
Quality indicators are numerical values that aim at measuring and following the quality of the statistical processes and results. These indicators should be understandable in their definition, easy to calculate and sensibly interpretable for the users and producers. If we want to make the quality indicators an efficient tool for monitoring the statistical process, they should be at disposal quickly and in a usable form. The focus of this paper is not on addressing general issues in the field of quality indicators, so we only provide two general considerations that are directly connected to the later discussed practical implementation of the “quality indicators theory” at SURS.
The fact is that the term “quality indicator” is not always limited to the definition of the “quantitative information”, but has in some frameworks a much broader definition. A quality indicator is by this alternative approach considered as any standardised information that describes a certain quality dimension and consequently indicates the degree of achieved quality in this dimension [17, 18]. In some cases, as in the case of the definition of quality indicators within the GSBPM model [3], quantitative indicators are defined whenever possible and when qualitative indicators are suggested instead they are expressed in the “to which extent …” or in the “yes/no” form [19]. In its early conceptual definition of “quality indicator”, SURS followed the practice of the common definition in early developments inside the ESS, where from the very beginning [20] quality indicators were defined in a narrow sense, i.e. as strictly numerical values. This conceptual definition was then retained through all the later revisions of the quality assessment system.
In the current statistical production, there has been a large increase in the amount of metadata and paradata that are produced through the production cycle. Much of this information could be easily considered as quality indicators, since they certainly bring valuable information on the quality of (certain parts of) the statistical process. For instance, all the paradata that are produced during the self-completion web interviewing are certainly important information that can be used in the process of quality assessment of the incoming data. The face-to-face field interviewing can also provide many quality-related metadata, e.g. what is the exact reason for the non-response or why exactly is the unit ineligible. When setting up the list of standard quality indicators that will become a standard tool for quality assessment, we are always faced with a dilemma: how long or how limited should this list be. Where is a sensible trade-off between the comprehensiveness of the information and the manageability and transparency of the system for managing this information? SURS took quite a conservative position and limited the list (covering all quality dimensions) to fewer than 20 standard indicators. These indicators represent a core part of the quality information and are a constitutive part of quality reports. On the other hand, collection and analysis of other quality-related metadata and paradata is also encouraged, but their usage and availability is mostly limited to the internality of the survey in question.
The integration of ESS standards for metadata and quality reporting (creation of SIMS)
As described earlier, two standard structures have been in use for the reference metadata reports within the ESS: the ESMS for more user-oriented reporting and the ESQRS for more producer-oriented reporting. The statistical domains had different requests in which of the formats the NSIs should report, but it had happened also that both of the reports had been prescribed. Because both structures were developed independently, they were overlapping at certain points or were even contradicting. To overcome this state, Eurostat launched the activity to simplify the quality reporting requests. The two existing standards were merged in the newly created Single Integrated Metadata Structure (SIMS), which was published for the first time in 2013. The European Statistical System Committee at its meeting in November 2015 endorsed the revised version of the Single Integrated Metadata Structure (SIMS 2.0) and its underlying reporting structures, the Euro SDMX Metadata Structure (ESMS 2.0) and the ESS Standard for Quality Reports Structure (ESQRS 2.0) [21]. At the same meeting, it endorsed that SIMS will be the standard for quality reporting according to Article 12 of Regulation 223/2009 on European statistics [13]. The main goal behind the preparation and introduction of SIMS was to create a framework for “once for all purposes” reporting, where each concept would be reported just once and would be re-usable [22].
Along with the integration of the theoretical concepts, the IT application that supports such conceptual approach was developed as well. In 2014, the new EU tool was introduced for the national reporting on the reference metadata. The previous National Reference Metadata Editor (NRME) was replaced with more modern ESS Metadata Handler, which now incorporates both structures and is in line with SIMS 2.0.
The creation of the SIMS structure represents a huge step forward in the direction of simplified and streamlined metadata and quality reporting in the ESS and many duplications have been abolished. The preparation of the coherent SIMS guidelines, which have been recently synchronized and included in the comprehensive handbook, has been another achievement that supported clarification and standardization of the reported concepts. SIMS 2.0 has undergone a special procedure and has become one of the ESS’s official standards. A lot has been done in the field of metadata and quality reporting standardization; however, some of the challenges remain.
The implementation of the SIMS 2.0 has taken a stepwise approach, meaning that most of the afterwards introduced metadata reporting demands were in line with SIMS 2.0. The challenge has been the legal status of SIMS 2.0 versus the domain-specific legislation, which has prescribed the exact quality reporting standards. The SIMS 2.0 implementation plan suggested to address this problem and align the inconsistencies when the concrete domain legislation would be discussed and other changes would have been introduced in the legislation. Waiting many years for this moment, unfortunately it seems that it has never came – recently many of the framework regulations have been prepared, alongside with the specific implementing regulations on metadata or quality reporting. Many efforts have been invested that the implementing regulations would refer only to SIMS in general as a standard, so if the standard was changed, the regulation would not become obsolete. However, this has not been achieved. Alternatively, the efforts have been invested that in case the implementing acts specifically spelled out the metadata or quality reporting concepts, they would be word by word exactly the same as in SIMS 2.0. This has been achieved to a limited extent. Many small divergences from SIMS have been introduced in the legislation and thus this relation remains unclear.
The introduction of the modern IT application has brought many efficiency gains. The Metadata Handler allows reusing the concepts and guides survey methodologists through the whole procedure. Nevertheless, some further harmonisation challenges remain to be solved. Due to the reasons described earlier, the standard concepts can still be very differently (not standardly) implemented from domain to domain, if not only in naming the concepts; there are also cases where the guidelines for the specific reported concept are different or the different field is prescribed in the application (i.e. table, multiple choice question or free text). This means that the Metadata Handler is adjusting to the domain specific requirements, instead of being vice versa, the domain requirements being harmonised with the existing standard. These small, unnecessary particularities bring many constraints to further interoperability of the systems, i.e. the automatic retrieval from the national metadata systems to the Metadata Handler.
User-oriented methodological documentation at SURS
Relevant metadata have always been of great importance for SURS. Back in the days when the printed outputs were predominant, the printed publications were accompanied by the relevant methodological content for users to better understand and easier interpret the presented statistics. The content of this methodological part of publications had not been standardized and it was more up to each survey methodologist to decide what is important about the presented statistical data and how to structure the content.
With the preparation of the online statistical releases and the introduction of SURS’s website in 1996, the methodological part of printed publications had been moved to the electronic PDF documents too, which had been gathered under special publication collection called the Methodological explanations [23]. The dissemination of the statistical data online raised the need for the standardization of the published metadata. In the years that followed, a lot of effort has been invested at SURS in improving the structure of these methodological reports, as well as, even more important, in improving the clarity and usability of the content. The structure and the content of the methodological explanations are now standardized and include the following main chapters: purpose, legal basis, unit described by the published data, selection of observation unit, sources and methods of data collection, definitions, explanations, publishing, revision of the data and links to other methodological materials. The internal methodological guidance with examples has been prepared that helps survey methodologists to write and structure this content in a standardized way.
The main advantage of the standardized metadata reports for the users is that after they get used to the structure of the methodological explanation, they know what to expect in this document and where to find it, no matter which statistical domain they are interested in. Each methodological explanation is by default updated once a year, usually along with one of the statistical releases that are linked to the content. The regularly updated metadata improves the clarity of statistical data (one of the components of the quality of statistical data), as well as reduces the possible misinterpretation of the published statistics.
A long tradition of systematic and standardized quality reporting at SURS
Systematic preparation of the extensive and standardized national quality reports has a long tradition at SURS. The first national template and guidance for quality reporting were prepared after the publication of the first EU handbook on this topic in 2003.
Around 2010, SURS came to the state that the quality reports were being regularly prepared for all relevant domains, published both in national and English versions [24]. The (perceived) burden on the survey methodologist was quite high. The reports were prepared based on a standard template in Word format, most of the quality indicators were still calculated with the ad-hoc procedures, designed and implemented only for the particular domain. One of the main drawbacks of that practice was also the fact that the reference metadata and the values of quality indicators were not centrally stored in a common database, which significantly reduced the analytical power of these data.
Quality indicators at SURS
An important step in the standardization activities was the preparation of a national methodological manual on the calculation of standard quality indicators [25]. The methodological manual assured a standardized approach, including harmonised definitions of quality indicators and description of standard procedures for their calculation. This standardisation opened the gate for the implementation of the calculation of these indicators in a wide range of different statistical domains. The list of quality indicators defined and used at SURS was created the following two underlying concepts:
Currently, SURS uses standard quality indicators presented in the Table 1.
SURS’s standard quality indicators
SURS’s standard quality indicators
The list of standard quality indicators defined and used by SURS has from the very beginning to a large extent relied on the definition of standard quality indicators within the ESS. The fact is that the first list of standard quality indicators, defined inside the ESS [20], was designed mostly for classical surveys. The term classical surveys here refer to surveys where data are primarily collected (and later processed) for statistical purposes. Data collection is designed and implemented by statistical organisations. In the following years, there has been a growing number of surveys that use administrative data and other secondary sources as the direct data source. Consequently, a need to define quality indicators for these specific statistical processes emerged [26]. At the ESS level the ESQRS (and later SIMS [22]) structure introduced several indicators that are designed especially for use in surveys that are based on administrative sources. SURS, too, introduced a few of such indicators into its quality assessment framework [24], but the fact is that these indicators were not broadly accepted among survey statisticians and their share in terms of the amount of information produced is still negligible. This issue is certainly a serious challenge for future development.
As described earlier, similar as in the ESS, SURS has also been using two standard structures to describe and report the national reference metadata – the methodological explanations and the quality reports. A central coordination position for the development of standard templates and for providing the guidance for survey methodologist was set up within the unit for general methodology and standards, which assured a harmonized approach within the Office. The system for the production of these reports has been well in place and there has been high awareness among the top management as well as among survey methodologists about the importance of the up-to-date methodological documentation.
Over the years, some of the inefficiencies of the system were popping up and it has been for a long time clear that some of the issues are of methodological nature, but that the main problem is lack of a modern IT solution that would support the system. Some of the main identified problems:
The reports were prepared as Word documents, based on a standard template prepared in Word. The introduction of any changes to the template was burdensome since most survey methodologists updated the latest version of their report and did not copy the concepts into the recent template. Before the mapping of both structures had taken place, some of the basic concepts were presented in both structures, and thus the survey methodologists had to copy the text from one to another. Quality-related information that was collected inside a particular survey process was stored only inside the disseminated word documents, meaning that their usage for analytical purposes was very difficult; hence, the analytical power of this information was very low. For the dissemination purposes, the reports have been transformed to PDF format. There has been a central storage of these documents as such, but the values of the quality indicators and the standard concepts have not been stored in any central database. A comparison of the values of the quality indicators between the domains or even a comparison through time for one particular domain was limited and hard to perform. We were clearly aware that there is still a large untapped analytical potential of these data and a vast number of possible improvements could be introduced to improve the efficiency of the process. The national versions of the quality reports followed and were by their content largely in line with the ESS recommendations, but were at that time not explicitly “concept by concept” mapped to the ESQRS standard. The short survey among survey methodologists in 2010 showed that the direct reusability of the information prepared at the national and ESS levels was very limited [24].
In line with the identified problems and the direction that SURS decided to invest in the creation of generic solutions, the area of production, storage and maintenance of the data related to quality and metadata had for many years been identified as the area where a generic solution would be needed. Technically, it was expressed as a requirement to build an application for central storage of the values of quality indicators and an application that would improve the management of reference metadata [24]. Due to the complexity of its realisation and perhaps also because the requirement did not reach high enough priority, it took a long time to actually start building the application. So, the concrete activities to build up such an application started soon after the adoption of the generic process model in 2012, while its introduction into the regular statistical production began only in 2019.
STATMIK – the new tool to improve the system
Awareness of the described shortages of the quality assessment system and its practical limitations has been present at SURS for many years. There have been many discussions on the possible means to improve the system. As a result of these discussions, we decided to start developing the new application, which should present a general tool for better management and for more efficient use of quality-related information. The conceptual premises that were the main drivers of the development process could be summarised through the following demands:
The following two sets of information should be centrally stored and easily accessed by the users:
Reference metadata for all statistical surveys; these data are predominantly of qualitative nature and should be inserted into the database directly by the survey managers. Quality indicators for all statistical surveys; these data are predominantly of quantitative nature and should be (as much as possible) provided through the automated procedures that are carried out in parallel with the statistical data processing itself. User-friendly graphical interfaces, which will enable easy and quick management of the centrally stored metadata by the end users, should be developed. All the already existing databases containing the relevant metadata information should be linkable to the new database and the needed information should be transferred by the automated procedures. The methodological explanations and quality reports, which are the key outputs of the application, should be generated with an automated procedure. The output of this automated procedure should be as close as possible to the dissemination format.
Based on the identified issues and recognized demands, the modern IT solution started to be developed. The whole development cycle, from writing the basic specifications to the programing of the application, took place in-house, without any external consultancies or development support. At the last stage, the application was named STATMIK (Slovene acronym for Statistical Metadata and Quality Indicators).
The development of the entire application took several years and during the development we were faced with many challenges due to the methodological complexity of the task itself as well as the technical complexity of the sources and processes we linked inside the application. Further on, we summarized the main development challenges, starting with the problem of integration, through the process of calculation and analysis of quality indicators, to the creation of appropriate output documents.
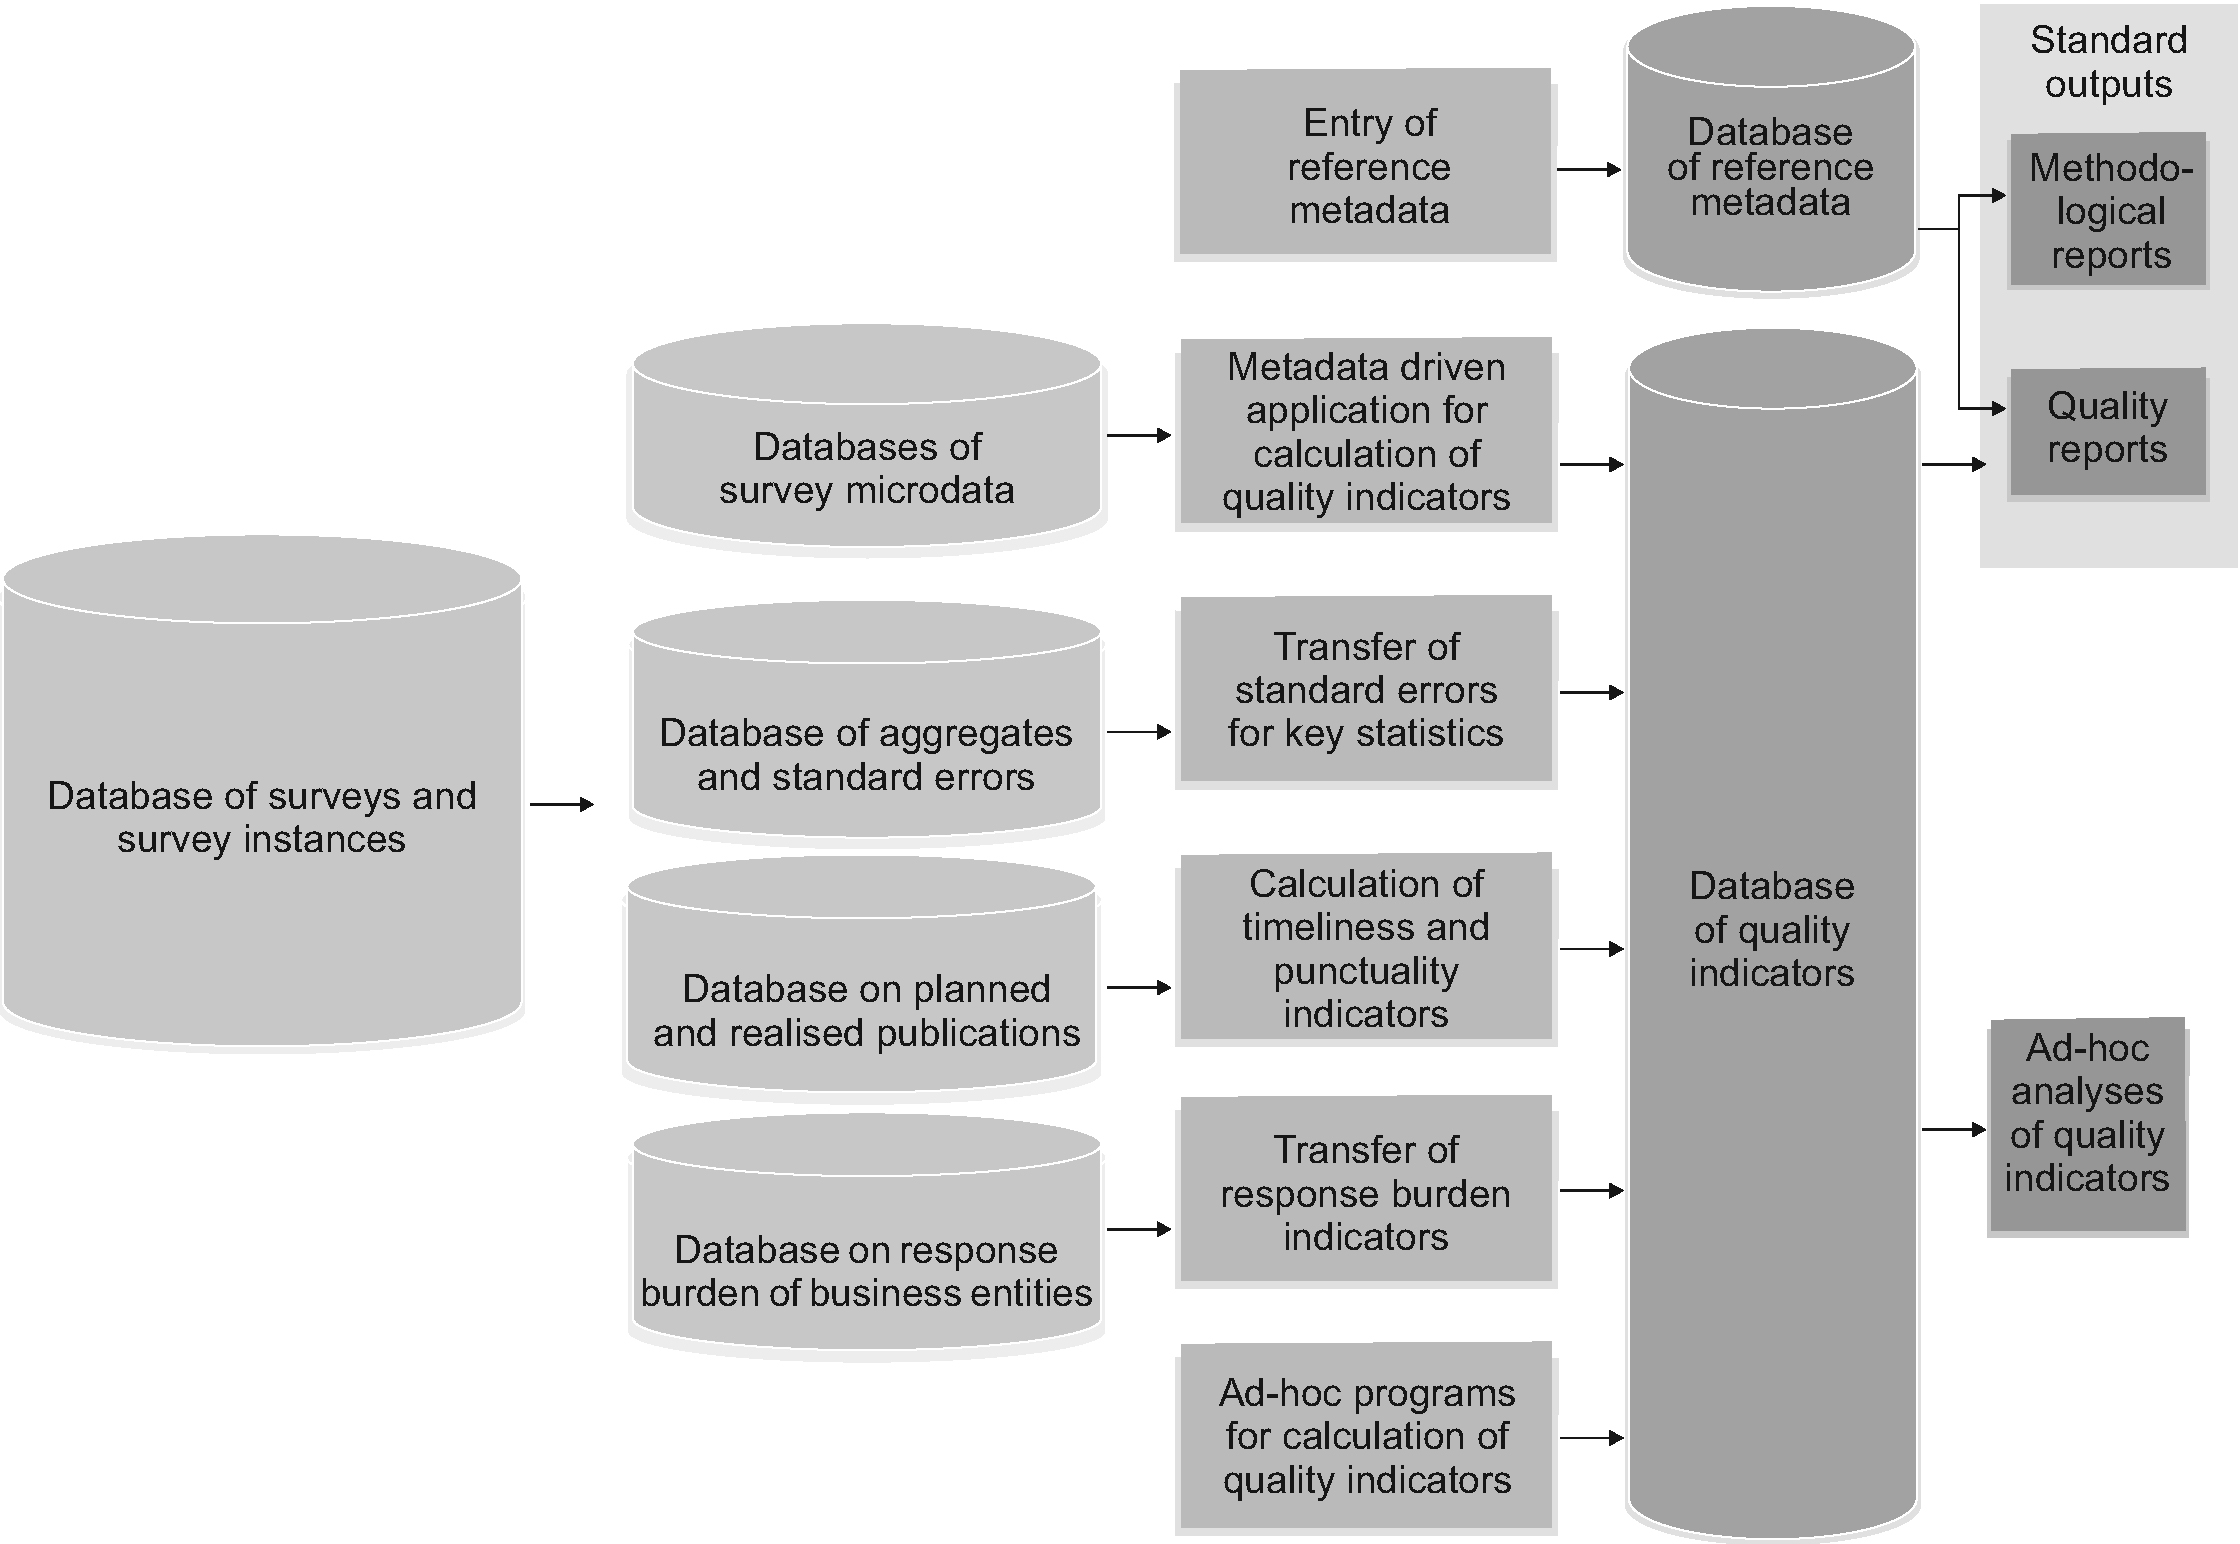
Architecture of the STATMIK database.
There are several data sources that enter the new data-metadata database. The most extensive data source is certainly quality indicators, which derive from the implementation of the statistical processing of particular statistical surveys. We will give some more information about the procedures for calculating these indicators in the next section. In addition to the exhaustive set of quality indicators, there are other data that come from other sources and on the one hand complement the database of quality indicators and on the other hand support the centralised management of the whole system. An example of the former group of the input data is the data that are transferred from the so-called “MOPS database” [27], i.e. database of information on response burden of business entities, which have been at SURS systematically collected from 2015 on. An example of the latter group of data is the data on surveys and their instances that are transferred from the central metadata database, called METIS. The fact is that the whole system of data sources and flows between them is quite complex and sometimes not easy to maintain, so the completion of the application in the sense of smooth realisations and full automation of all the inner processes is still a big challenge for the future development. Rough architecture of the whole system is presented in the Fig. 1.
Procedures for calculation of quality indicators
At SURS, many surveys faced methodological and technical revisions in the recent years. One of the elements of these revisions was also the automation of the calculation of the quality indicators. The goal is that as many of these indicators as possible would be at disposal at the same time as the statistical results. What we achieved so far is automation of the calculation of three sub-sets of indicators:
Standard errors and accompanying indicators (coefficients of variations, limits of confidence intervals). Automated calculation of these indicators is the part of the general metadata driven application for aggregation and tabulation that was in the recent years introduced at SURS. Other quality indicators from the Accuracy dimension (unit and item non-response rate, over-coverage rate, editing rate, imputation rate). Automated calculation of these indicators is the part of the general metadata driven application for data processing. Indicators from the domain Timeliness and Punctuality (Timeliness of first and final release, Punctuality of first release). Automated calculation of these indicators is ensured by the special procedure, carried out once a year, which links data on surveys with data on publications.
There is an essential difference in the implementation of the automated procedure for the former two subsets in comparison with the third subset. In the first case, there is one general program that is used for all the surveys, but the concrete implementation of the procedure is carried out in the framework of the statistical processing of the particular survey and launched by each survey statistician separately. In the second case, the implementation of the procedure is completely centralised and is carried out at the same time for all the surveys. Despite the differences in the implementation, both approaches have one very important common feature: both procedures ensure direct insertion of the calculated values into the common database of quality indicators.
When designing the whole system, we foresaw three main purposes of the central database of quality indicators:
To provide input for the quality reports that are created at SURS To provide input for the ESS quality and metadata structures (ESMS, ESQRS, SIMS) that are incorporated in the application Metadata Handler To provide to the internal users a powerful analytical tool for standard and ad-hoc analyses of quality information
For the first functionality from the list, we can easily claim that it is already fully in power. The tables needed for quality reports are automatically created from the database. The tables are together with relevant reference metadata extracted from the database and the quality reports are ready to be published without any extra changes in the layout.
On the other hand, the other two functionalities are at the moment not really used in practice. For the second functionality, the “guilt” for non-usage is certainly on the development side. Many technical obstacles occurred during the development phase and this functionality is not really at the disposal yet for the users. As regards the third functionality, it is technically developed and could be used by different users; however, we here perceive a lack of interest in using this functionality. To put this functionality really into operational life, more promotional effort will be needed, especially among middle and high management.
The database of quality indicators currently contains about 570,000 values of the indicators, which are in fact quite unevenly distributed among surveys as well as among indicators. For illustration of this distribution, we provide a Table 2 where, for the reference year 2018 when we had about 180 active surveys, the number of surveys for which we succeeded to gather indicator value(s) is presented for each of the indicators from the list.
Number of surveys which have a quality indicator in the database for the reference year 2018
Number of surveys which have a quality indicator in the database for the reference year 2018
The large number of indicator values that are on disposal in the database can be largely attributed to the following facts:
For the majority of the indicators, values are (besides for the whole observed data set) provided also for certain population domains (e.g. regions in the case of social surveys or activity groups in the case of business surveys). When we started to fill the database of quality indicators, we tried to collect the historical values of the indicators as much as possible. So, at the moment, the database contains values for survey instances from 2008 on. Here we have to mention that the reliability of these “old historically values” is lower than of the more recent ones, since at that time the standardised and harmonised procedures that are currently in practice were not used yet.
As mentioned before, one of the main added values of the new application is that it enables quick and easy analyses of the quality indicators, making useful comparisons through time and across the surveys. Results of the analyses can be obtained quickly and in a user-friendly form and they are available in both tabular and graphical form. To illustrate this functionality, we provide two examples of the graphical outputs. The first one in Fig. 2 presents movement of the unit non-response rate in the EU-SILC in 2010–2019. The graph clearly shows the tendency of slight increase through years, which is a well-known tendency in household surveys. The unweighted as well as weighted rates are presented in the graph.
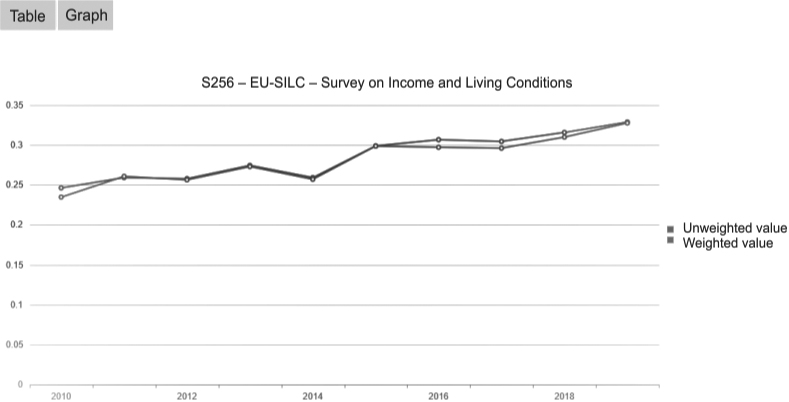
The unit non-response rate in the EU-SILC in 2010–2019.
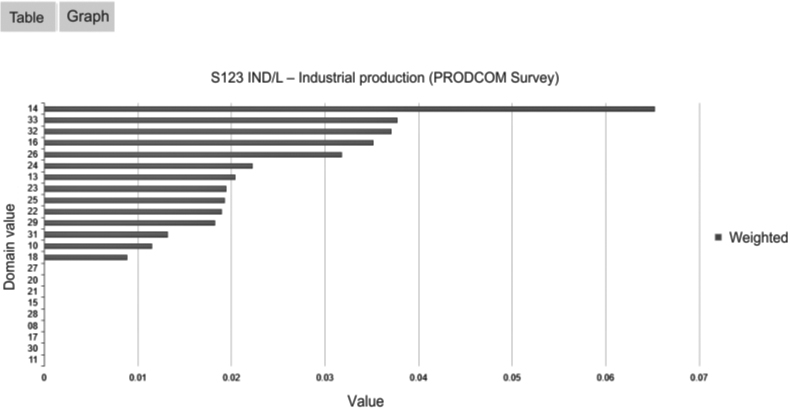
Over-coverage rate in the annual PRODCOM surveys, by domain (NACE code).
The second one in Fig. 3 presents the domain analysis for the over-coverage rate in the annual PRODCOM surveys. 2-digit NACE code is chosen as the domain for this particular case. We can clearly see the considerable heterogeneity of the indicator values across domain groups.
Another important feature of the application is the preparation and extraction of the methodological documents that are ready to be disseminated – see example for the methodological explanation [28] and for the quality report [29]. A standard template that used to be prepared and handled in Word is now incorporated in the application itself, so it is much easier to introduce any kind of changes to the template. In the application, there is an editor where the survey methodologist can prepare reference metadata for the survey. Detailed internal methodological guidelines have been prepared with recommendations for what to include in each of the standardized concepts, with illustrative examples (when needed) included. The short description of the guidelines is built in the application itself and presented next to the editor. To make the fulfilment of the reports easier, some of the concepts have one or more possible standard texts built in, so the methodologist can choose the one that suits the situation best. The editor is bilingual, so at the same time the national and English text can be stored in the application. The standard tables are prepared just once in the application, but they are automatically included in the national and English versions of the reports. The reference metadata that are stored in the application can be copied to the next year on demand, so that makes the basis for the updates of the documents. The reference metadata are versioned and thus the history is saved in the application.
All the standard concepts for the reference metadata and quality indicators are valid for all the surveys. There is no customisation for any kind of survey at the level of the standard concepts. They all have to fill them in and can not include additional information that is not in the application/standard template. The standard texts are prepared also in case some of the concepts or quality indicators are not relevant for specific type of survey. This approach means that at the initial stage there have been some more challenges, especially when the surveys have been migrating for the first time to the STATMIK, since they all had to fit the standard. The approach is harder to implement, but we estimate that it brings added value to the users, who get a standardized output and also any kind of internal comparisons are easier.
All methodological reports undergo the procedure of national and English proofreading. The missing step in the application and one of its drawbacks is that the editor used for the reference metadata does not support the track changes option. The proofreading and checking of the documents thus has to be done outside of the application.
Main benefits and detected drawbacks of the new system
Statistical metadata that can be described as the set of information that comprehensively describe and assess statistical processes and products are nowadays by a consensual understanding a very important building block of the modern statistical production system, especially when official statistics are in question. An efficient metadata management system is therefore almost as important as efficient data management itself. STATMIK, the new system for metadata management at SURS, is certainly a big step forward in our efforts to modernise our production system. Standardisation and centralisation are two cornerstones on which the whole conceptual architecture of the system is built. Such standardisation and centralisation certainly brings many benefits to the statistical process, but on the other hand (as usually in such development projects) also a certain number of drawbacks can be detected when we compare the new system to the old (predominantly stove-pipe oriented) metadata management system. We here present a short list of the most outstanding benefits and drawbacks that were (some of them) already discovered through the system development and (mostly) detected in the first phase of system implementation.
The most important benefits detected are:
The system of single entry for several purposes. Each piece of information should be gathered only once and inserted into the central database, from where it can then be extracted and used for different purposes. The central database of quality indicators gives this information a much larger analytical power. Indicators can now be easily compared through time and across domains. It is also much easier to detect weak/problematic points in the statistical system. By developing the general (metadata driven) software for calculating quality indicators, the actual harmonisation of the calculation methodology was reached. This development achievement is a direct continuation of the harmonisation of the theoretical methodology that was achieved by creating and (as a standard) accepting the SURS’s methodological manual Quality indicators [25].
Total standardisation of the output methodological documents (methodological explanations and quality reports) is an important step forward to the better communication with the users of the statistical products.
The main drawbacks detected so far are:
Generalisation of the creation of the methodological documents brings advantages in their harmonisation of content and design, but on other hand brings some losses, especially in design and more advanced presentation features. For instance, the document generator does not enable the creation of charts and other visualisation tools that were frequently included in previous (ad-hoc generated) quality reports. Developing and supporting such generic applications require experts capable of thinking and operating at a much more general level, considering the execution of a certain survey just as one of the realisations of the general statistical process. In the developing phase, such more pronounced general thinking is expected from IT and general methodology experts, while in the implementation phase, such approach is expected from the subject-matter experts. Especially in the latter case, there were and still are some obstacles to overcome, to successfully give the subject-matter experts a new role, not only being users and “reviewers” of the input metadata but also being active creators of them. In any case, this issue can be more than a drawback considered as a (long-term) challenge for the future.
Conclusion
Analysing and documenting the quality of statistical data is a complex and burdensome work, many times overlooked, hardly ever noticed, but on the other hand extremely important and appreciated when needed, for those who need it. Systematic monitoring of the quality of statistical processes and products is one of the advantages of official statistics that should be safeguarded in these changing circumstances when the value of official statistics is questioned, as so many times before in the past. The fake news and all sorts of data revolutions are competing with information provided by official statistics. But, to understand data, we need to have access and good insight into the background information, how was the data gathered, who is included and who is not, who participated and who was excluded. Only on this basis can we make relevant conclusions and informed decisions.
As many others, this area was also touched with all the happenings caused by the “COVID crisis”. Production of statistical data of key official statistics is usually stable and if there are no revisions, then there are no major differences or there should not be too many differences from year to year. Producing quality reports in a stable environment might be sometimes from year to year even a boring job – things are repeated, there are issues that are sometimes hard to work on, so the quality (or low quality) remains stable. With the “COVID crisis” rushing into the world, the official statistics has also been affected. There happen to be changes in the data collection process, frequently resulting in higher non-response rates – but if a system of quality assessment and quality reporting is well in place, official statistics already has a stable place to report upon about these things and there is no need to search for new formats. All the deficiencies of the statistical products can hence be promptly and transparently reported, so the users can be aware of (possible) lower reliability of the disseminated results caused by the “COVID circumstances”.
We are aware that quality reports and reference metadata might not be a popular reading and they will never become so, no matter how attractive we try to make them. However, we are also aware that they are important safeguards of official statistics transparency. Documenting the information about quality is a burdensome work that official statistics are working upon, but this hard work proves its value especially in exceptional circumstances such as those that we faced in most of 2020.
Technical as well as methodological work carried out so far at SURS resulted in a solution that provides standardized and centralized management of reference metadata, among which metadata related to quality have a special role. Our goal for the next development phase is to give this information a larger power by putting it more systematically into the assessment-improvement cycle. One of the important tasks is hence to raise awareness that all this information is not just “something to do”, but also “something to use”.
Looking at the Table 2, we can see that the amount of information is very diverse when different indicators are in question. There are indicators that are systematically measured and followed in almost all surveys and on the other hand indicators that are calculated in only few surveys. The latter group largely consists of indicators that are intended to be calculated in surveys with administrative data as a direct data source. We are quite aware of this deficiency and more regular usage of these indicators is one of the important goals in our future agenda.