
Abstract
Official price statistics in the Philippines are mainly sourced from the conduct of regular surveys and censuses which entail high costs. As businesses move into digital platforms, alternatives to these traditional data sources have become more available; one of which is web scraping, a process of collecting information from the web. As digital and online platforms become increasingly utilized for commerce, web scraping offers a way to increase the frequency of data collection while reducing its cost compared to price surveys. This paper provides a survey of experiences of various government statistical agencies in their conduct of web scraping for the Consumer Price Index (CPI). Moreover, it details the Philippines’ experience using web scraped data to estimate the food and alcoholic beverages CPI of the National Capital Region in the Philippines, and that is compared to the official CPI estimate of the Philippine Statistics Authority. Finally, this paper discusses the challenges encountered and the recommendations for enhancing the approach.
Introduction
Official price statistics are calculated from data taken from regularly conducted surveys that cover different areas across the Philippines. Although these surveys produce reliable data, their implementation is costly. With several businesses transitioning to a digital platform, prices of various goods are readily available on the web. This leads to the possibility of collecting and computing price statistics via web scraping.
Web scraping is the process of collecting information from the web. As digital and online platforms become an integral part of commerce, web scraping helps increase the frequency of data collection while reducing the overall collection cost. The utilization of “big data” from the web to aid official statistics is not something new as it is already implemented in other countries [1] and has already been used in economic research [2, 3]. Several countries have explored the calculation of price statistics using online data, such as the Netherlands [4], Austria [5], Germany [6], Norway [7], Latin American countries [8], United Kingdom [9], Ukraine [10] and Belgium [11], among others. These countries have found that web scraping is an efficient tool for collecting prices.
In the Philippines, price index generation is conducted by the Philippine Statistics Authority (PSA), and is mostly based on traditional data sources such as surveys and censuses. Similar to most official statistics offices around the world, PSA uses standard protocols to identify sources and collect data to ensure the credibility of official statistics. Deviations from the traditional data sources and methodology invite statistical and political criticisms. However, the traditional method entails high costs and low frequency of data collection due to time and resource constraints [1]. These issues may be addressed by introducing web scraping to produce official statistics since this method provides timely and reliable data and is cost-efficient [5].
This paper presents a survey of country experiences in utilizing web scraping for price statistics gathering, which are relevant in the context of countries with available and developing e-commerce infrastructure, such as the Philippines. The paper also presents the results of the estimated Consumer Price Index (CPI) for food and alcoholic beverages utilizing web scraped prices. Given that the Information and Communications Technology (ICT) landscape of the Philippines is still in the developing stage, the availability of price statistics online is limited as most businesses are yet to take advantage of digital platforms that facilitate online transactions. The scope of data collection was narrowed down to gathering online prices for the National Capital Region (NCR) rather than the entirety of the Philippines. Moreover, the common commodities available online are on food and alcoholic beverages, which were web scraped for prices.
Review of related literature
The consumer price index
According to the United Nations, the CPI is “a current social and economic indicator that is constructed to measure changes over time in the general level of prices of consumer goods and services that households acquire, use or pay for consumption”. The CPI is frequently computed using the aggregation of prices of a predetermined set of goods and services that consumers of the reference population purchase and utilize [12].
In the Philippines, the CPI is defined as “an indicator of the change in average retail prices of a fixed basket of goods and services commonly purchased by households relative to a base year” [13]. Aside from using it to estimate the country’s inflation rate and purchasing power, the CPI is also used as deflator for macroeconomic time series from nominal GDP to real GDP.
Using online prices in the production of official statistics
In this digital age, network developments and higher connectivity have transformed how we interact with data by reducing the costs related to the storage, updating, distribution, identification, and compilation of information [2]. Edelman [2] also explained how the internet had provided the researchers with the opportunity to gather data that caters to their specific needs or interests. Various countries are using online prices in the production of their official statistics. From 2012 onwards, Statistics Netherlands has attempted to collect online prices from web shops, mainly on clothing, to compute their country’s CPI. They developed a robot tool to assist in the online price collection of cinema tickets, driving lessons, and restaurant menu prices [4]. Statistics Austria also used online prices to cover about 10 percent of the Austrian CPI basket of goods. Their targeted segments were transportation (i.e., flight tickets, train tickets, holiday package tours), technical equipment, clothing, and hotels [5]. Argentina also ventured into building an online price index and compared it with the CPI series estimated and published by their national statistical agency [8].
However, online data are known to be unstructured and unfiltered since they are commonly extracted from digital platforms [1]. Statistical offices are expected to prepare their technology, capacity, and ecosystem for the proper adoption and implementation of these new forms of data. Statistical offices would need better ICT infrastructure to download, catalog, organize, and process big data sources efficiently and timely. In terms of capacity, the staff would also be required to acquire new skill sets for statistics production, which merges traditional and new forms of data, including but not limited to advanced programming and data collection and management. Statistical offices may also designate specialized divisions to help manage the challenges associated with the implementation and use of this new data source, similar to what Statistics Canada has done [17]. Lastly, the statistics ecosystem will need to be improved by developing new business models for statistical decision-making.
Aside from preparing for the technological advancement required by the usage of big data, statistical offices must also abide by the 5
Initiatives on web scraping online prices for the estimation of the CPI
Initiatives on web scraping online prices for the estimation of the CPI
Enumerated in Table 1 are the countries that have explored the calculation of online price statistics in the estimation of their CPI, and their data sources of online prices. The details on the other countries’ experiences and initiatives on web scraping online prices for official statistics, which have not been presented here, will be discussed in Section 2.4.
The automated process of accessing web documents, the retrieval of pre-determined information, and the transformation and storage of data gathered into a structured format is called web scraping [19]. Web scraping uses computer programs, usually called scrapers, to collect data from the internet without human intervention. These scrapers are typically controlled by IT experts and statisticians and are operated through a cloud or server [4].
The use of web scraping in collecting data is relatively new, and like any other innovation, it has its advantages and disadvantages. Some benefits of online data are as follows [20]:
low costs since it is relatively cheaper than hiring people to visit physical stores for data collection; remote collection of data, which allows users to perform a centralized data collection and to homogenize the characteristics of goods; high comparability across countries of the gathered online data since prices are collected through identical methods with matching categories of goods and time periods; and, online data are available in real-time, without delays to access and processing of information.
Comparison matrix of survey-based data collection and web scraping
Comparison matrix of survey-based data collection and web scraping
However, web scraping also has its disadvantages. One main disadvantage of web scraping is that the online availability of prices covers a significantly smaller set of retailers and product categories [20]. Also, the data that may be scraped online is neither structured nor filtered [1], often requiring tedious data cleaning and management. Moreover, the methodological framework for its usage in the production of official statistics has yet to be established [4]. The notable differences between the conduct of web scraping activity and survey-based data collection are presented in Table 2 in a matrix of comparison between the usage of these two types of data collection. Several countries have implemented the use of big data to aid in the production of their official statistics.
Argentina
Cavallo [8] conducted a study on online and offline official price indexes, which emphasized the ability of constructed daily price indexes from online prices to match official inflation estimates in five Latin American countries – Argentina, Brazil, Chile, Colombia, and Venezuela, with Argentina as its focus. Product-level price data were collected using software that scanned the websites of the largest supermarkets in each country from October 2007 to March 2011. Cavallo [8] gathered detailed information on each product, including prices, product IDs, and categories [8]. To create an “online price index,” a combination of online prices, standard CPI methodologies, and official category weights were utilized. Then, each online index generated was compared to an equivalent “official supermarket index,” formed as a weighted average of the official CPI components of food, beverages, and household products, which are the same categories available on the supermarket websites. The results showed that the online price indices in Brazil, Chile, Colombia, and Venezuela were approximately equal to the average level and reflected the main dynamics of official inflation. As explained by Cavallo [8], this degree of matching may be attributed to the representativeness of the supermarket (market share) and the importance of the location where the data for the online products were obtained. The results for Argentina, however, were significantly different, wherein large discrepancies between online and official price indices were consistently seen over time, although the dynamic behavior of online inflation seemed to match that of the officials. The study then mentioned that the results strongly suggest that the National Statistics and Census Institute of Argentina is manipulating the official inflation estimates and is apparently only reporting a fraction of the actual inflation rate, often just a third or half of the actual numbers [8]. Hence, when an official index was built using only a third of the inflation rate instead, the levels of the online index then matched that of the officials.
United states of America
Due to Argentina’s statistical debacle on the manipulation of inflation statistics from 2007, Cavallo [8] found that online prices had the potential for inflation measurement applications. With this, the Billion Prices Project (BPP) was launched at the Massachusetts Institute of Technology (MIT) in 2008 to collect a huge amount of prices online, hence the term billion [20].
By 2010, 5 million prices were collected every day from over 300 retailers in 50 countries by the BPP. However, grants were unable to sustain the funding of the project. Hence, in 2011, PriceStats was established to collect the data and “produce high-frequency indexes for central banks and financial-sector customers” [20]. PriceStats collects approximately 15 million products from over 900 retailers to construct daily inflation indexes in 20 countries. The company also possesses micro datasets with information collected from a larger number of retailers in over 60 countries, with varying degrees of coverage. Data and results of the project may be accessed through the BPP website.
One of the major findings released by this project was the evident difference in the distribution of price changes between online prices, prices collected for official consumer price indexes, and scanner prices. This difference between the online and official CPI could be attributed to the structural differences between the different sources of price data and may be observed more in developing countries [20].
In addition, according to Konny et al. [21], like other national statistics offices, the Bureau of Labor Statistics (BLS) of the United States of America (USA) generally relied on its traditional sample surveys to collect information on price and expenditure to produce their CPI. Nevertheless, due to the availability of alternative data sources, BLS has undertaken several pilot projects that use these alternatives, one of which is web scraping. BLS categorized web scraping data as either data collected automatically using software that collects prices and product characteristics from websites or data collected through Application Programming Interfaces, as some establishments provide access to these. However, their use of web scraping faced legal challenges as BLS could not proceed without the given permission of their identified establishments. With this, they have developed a policy on web scraped data stating that BLS shall provide a pledge of confidentiality to potential website owners and obtain their consent to web scrape. This includes an understanding that if a website has Terms of Service agreements, BLS must inform and explain to the data owners which terms they may not be able to abide by. Further, BLS web scraped motor fuel data on GasBuddy’s website, a tech company that crowdsources fuel price collection to almost 100,000 gas stations in the USA. They found that indexes based on these web scraped data closely follow that of the CPI’s gasoline indexes. However, these web scraped data did not capture information on factors that may cause possible price changes like the ethanol content and type of payment. Still, BLS shared that their results show that both the average prices and price indexes based on data scraped from GasBuddy’s website and CPI data behave correspondingly.
United Kingdom
In 2014, to acknowledge the drive towards innovation and the need to exploit existing sources of data, Breton et al. [22] set up the “Big Data Project” to investigate the benefits and challenges of using big data for official statistics. The Office for National Statistics (ONS) of the United Kingdom developed a prototype web scraper to pilot prices for three online supermarket chains: Tesco, Sainsbury, and Waitrose. The scrapers were scheduled to collect prices for 35 items in the CPI basket every 5 AM. The scrapers managed to retrieve approximately 6,500 price quotes per day, a much larger collection of prices than when using the traditional approach. However, despite the success of web scrapers in collecting large amounts of data, outstanding issues arose, which highlighted the technical difficulties when web scraping is used as a method for data collection. The first issue they encountered was that one of the sites used blocking technologies to prevent scraping; thus, prices were not collected from the supermarket’s site. Another problem they encountered was when one of the sites had an infinite scrolling system that needed users to scroll to load other items listed on the page. The scraper could not replicate such user action and was only able to collect the initial items listed on the page. Further, they developed a web scraped CPI for food and non-alcoholic beverages and alcoholic beverages to make comparisons with the CPI data, which followed the traditional CPI methodology to minimize differences due to the data collection method. The results for the food and non-alcoholic beverages division showed similar trends for both the published CPI and the web scraped CPI for the time period of June 2014 to September 2014 as both the published and web scraped CPIs exhibited downward movement. However, after the time period of June 2014 to September 2014, the price movements of the two CPIs no longer match. The web scraped CPI plunges or rises a month earlier than the published CPI. On the other hand, a larger difference between the web scraped and published CPI was observed for the alcoholic beverages division. However, at a later time, the indices for alcoholic beverages showed a similar price movement but with greater differences in the extent to which the price changes. In summary, despite the difference in the collection method, some strong similarities between the web scraped and the published CPI were observed; still, it was recommended that a long time series comparison is vital to improving the understanding of the relationship between both indices.
In an update a year later, new techniques have been deployed to address the issue of a ‘scraper break’ wherein the data collection process is disrupted by changes to website structure, and technical errors (i.e., internet outages, IT system failures) on the computer and servers used to scrape the data. One of which is the web scraping of sites from two ONS locations to bridge the data gap should one scraper fail to run on a specific schedule. The agreement of prices between the two locations has been checked before commencing this setup. Moreover, advanced machine learning techniques such as support vector machines and unsupervised cluster-based anomaly detection were integrated into the whole process to validate the collected items and ensure the accuracy and reliability of their prices. Rules on the imputation of missing prices have also been established upon a series of tests on the web scraped dataset. However, in this period, only the items included in the pilot run were included in their ‘special aggregate’ of published CPI. This was then compared to the CPI produced by web scraping. The results showed a similar long-term trend, particularly between October 2015 to February 2016 for alcoholic beverages, with some differences in price movements [22]
Ukraine
Faryna et al. [10] developed an online consumer price index for Ukraine using a rich dataset of online prices. They compared it to the official statistics the State Statistics Service of Ukraine reported. They utilized online prices of consumer goods web scraped by the National Bank of Ukraine. Their dataset contains about 3 million observations of online retail prices for consumer goods in the five largest cities in Ukraine, and it spans from the period of January 2016 to December 2017. The online data cover about 46 percent of the country’s CPI basket. They observed that the online and official CPIs are consistent, but their subcomponents exhibit some discrepancies as the performance of online prices varies across indexes. One example given is the difference they observed on the indexes for a loaf of bread, frozen fish, and sunflower oil as it was able to capture the official’s trend dynamic of the monthly inflation, but it differs on the short-term changes. On the other hand, online price indexes for eggs, apples, grapes, and kefir nearly resemble both the official trend dynamic and its short-term changes. They also observed that the online CPI approximates the official number when the number of goods available from the web increases. However, more goods in the analysis do not necessarily imply higher correlations as the noise will expectedly increase.
Colombia
As part of Colombia’s Innovation Plan for 2015–2018, the Departamento Administrativo Nacional de Estadistica conducted a web scraping project to measure variations of CPI prices. They included supermarket websites situated in Bogota, Colombia, and were able to identify 12 sites, with only six marked as functional due to limitations in the structure of the web pages. The program ran every 15 days and collected information on units, prices, and quantity. Throughout the course of the data collection, it was able to gather 6,741 articles, wherein 37 percent of them are included in the CPI. Upon further data cleaning, the method was found to be valid and can even complement obtaining prices and specifications of products in the CPI, with 28.1 percent as the representation rate [23].
Singapore
The Singapore Department of Statistics (DOS) has also initiated pilot projects on the usage of web extraction crawlers and web scraping tools to incorporate specific online prices in the compilation of their country’s CPI. They have created customized web crawlers to extract information from websites requiring user-editable selections on destination and dates of departure and return (i.e., airline websites). They have also devised “point-and-click” web crawlers to scrape data from websites that usually present a comprehensive list of products and updated prices (i.e., appliance or pharmaceutical websites). Among the key learning points of Singapore DOS’s project are the consistency in product type, expertise in web programming, and legal and design restrictions on websites. There is not only a need to map web scraped data with the monitored products in the CPI, but the web scraping project also requires extensive knowledge and skills in programming and maintenance of the programs. Furthermore, it is vital to review the terms of conditions of the use of websites that may potentially be sourced for online prices and check if any legal restrictions are imposed against web scraping data from these websites [24].
Australia
The Australian Bureau of Statistics (ABS) also used web scraped data in their CPI in 2017 by using the average price of a product over a given period, which is generated monthly. However, before introducing web scraped data, ABS first compared 12 months of web scraped prices with the manually collected prices to ensure their similarity and that it was suitable for computing price change. Once that was established, ABS used the web scraped data to replace the manually collected ones, and the manual collection of these products was discontinued. Some benefits of using web scraped data that they have noticed are as follows, (1) the average price from the collected web scraped data twice a week is more representative compared to the single price collected once a month or per quarter, and (2) it enables more products to be included in the CPI basket, and (3) it reduces the CPI collection cost. With this, ABS now mainly use web scraped data in the computation of CPI for alcohol, on a few clothing products, and car parts, accounting for around 5 percent of the CPI. ABS recognizes that not every product is available online. Thus, other data sources used in the computation of their CPI are scanner data (16 percent), administrative data (22 percent), and manually collected data (57 percent). In contrast to the benefits mentioned by ABS, they have also shared the challenges they have encountered with web scraping, including (1) the maintenance of the web scrapers whenever websites change, (2) the handling of the significant number of new and disappearing products, known as the product churn, (3) development of methods to process and analyze the large amount of data collected, and (4) the absence of expenditure data, which is used to identify the products that are most popularly purchased and are used for weighting purposes in the computation of CPI [25].
Romania
In 2019, the Romanian National Institute of Statistics compiled an experimental CPI based on internet data [26]. They sampled four websites for food, five sites for clothing, and five sites for footwear products from those that have a website for e-commerce. The project explored existing software based on several criteria: it should be freely available and open source, easy to maintain, have a soft learning curve for statisticians, and have active technical support from a dynamic community of users. They started their project using Robot Framework. However, it is currently no longer in active public development. Hence, they switched to RSelenium.
Due to the unstructured nature of the extracted data, decomposition at the core components of CPI classification is required first by developing a chain of R scripts that transform the data in a way that allows flexible processing. The CPI computation steps are sequentially deployed, the data input for each stage depending on the output of the previous stage, except for the first step, whose input depends on raw data. This project showed that careful planning should always consider the changing nature of the data source, the websites being in a continuous transformation requiring continuous monitoring. On the other hand, a large share of the total data collected could be of less value for the main purpose of the project.
Poland
With the emergence of COVID-19, lockdowns hindered the manual collection of price data in Europe. Poland saw an opportunity to improve the collection of food CPI concerning timeliness, frequency, coverage, and information on products and prices by conducting web scraping. The study utilized a database that is comprised of the price history of about 20,000 unique goods. This database was gathered by a web scraping tool that was designed to gather information from the website of a major supermarket chain in Poland However, not all prices were used in calculating the online food CPI; rather, a list of representative items for each product group in the food and non-alcoholic beverages category was included. Moreover, the products that were frequently available for the whole duration of the study were prioritized in the analysis.
Although the paper originally focused on measuring food inflation, it also showed that a laptop and internet connection would suffice in calculating food indices. It emphasized the possibility of estimating them in a timely manner since the program can calculate an initial index to the food CPI two weeks before the end of the reference period and a month earlier than the official release. It also considered the accuracy of online price trends since customers shopped more online during the COVID-19 pandemic [27].
Peru
A technical assistance mission of the International Monetary Fund (IMF) was carried out from June 2021 to March 2022 in response to the National Institute of Statistics and Information of Peru’s request to update the CPI weights and modernize its data collection by incorporating new data sources like web scraping and scanner data. They made use of information that had been web scraped on items including shirts, laptops, mobile phones, and televisions. On this mission, they also offered in-depth training on the methodology for creating indices using web scraped data and integration into the CPI, as well as on data cleaning and preparation for data processing. Since televisions were the first product for which online data was gathered, they served as the foundation upon which the entire technique for the mission was implemented. They recommended contacting website owners before proceeding with web scraping as they also took note of the possibility of some countries having a legal framework that prohibits the activity. Additionally, the study suggested that data gathering be done in both the physical stores and online ones if the prices or the varieties differ [28].
Methodological considerations in applying web scraping for price statistics in the Philippines
The calculation of CPI in the Philippines, and the process of web scraping, are discussed in the following sections.
CPI Computation in the Philippines
In the Philippines, the prices used to calculate the CPI are collected twice a month: the first phase occurs in the first five days, and the second phase is from the 15
The CPI computation factors in five key elements – Base Period, Market Basket, Weighting System, Geographic Coverage, Classification Standards.
The base period is defined as the reference year to which the CPI series can be related, enables price movement comparison over time, and is rebased to stay current and relevant. The PSA had recently rebased the CPI to 2018. The “market basket refers to a sample of goods and services meant to represent the totality of all the goods and services purchased by households relative to a base year” [15]. The weighting system assigns values to commodities based on their significance in the market basket, determined by the Family Income and Expenditure Survey (FIES) data [13]. The computation of the CPI is done at the national, regional, and provincial levels and for specific cities. A separate CPI for the NCR is also computed by PSA [14]. The classification standards determine how items are grouped in the market basket, following international Classification of Individual Consumption According to Purpose standards and Philippine geographic classification codes.
Web scraping process
A list of potential online sources (websites) for prices of food and alcoholic beverages was created; the food and alcoholic beverages are classified as Divisions 1 and 2, respectively, in the official methodology of the PSA. The websites on this list must have the option to deliver to areas within NCR. The list was narrowed down by assessing the feasibility of websites for web scraping. For example, some websites present prices as an image file, which is difficult to process without an image analyzing AI. Also, some websites require registration, which presents additional complications in web scraping. Websites with these characteristics were dropped from the list.
Web scraping algorithms were developed using the R software to conduct the automated data collection. These programs are designed to capture the listed prices from the websites, store the prices and other relevant information in a database, apply data cleaning and management, ensure comparability of prices by rescaling, and generate an estimate of the CPI.
Computation of the PSA and the web scraping CPI
Step-by-step computation of the PSA and the web scraping CPI
Step-by-step computation of the PSA and the web scraping CPI
Table 3 presents the step-by-step comparison of the computation used by the PSA for the generation of the official CPI and the steps utilized for the computation of the web scraping CPI. As this phase of the research only focused on Divisions 1 (Food and Non-alcoholic Beverages) and Division 2 (Alcoholic Beverages and Tobacco) of the Philippine Classification of Individual Consumption According to Purpose (PCOICOP), only until the index for the division level was computed for the online CPI. The 7
Food and non-alcoholic beverages division PSA index vs. web scraping index using the mean approach: March to December 2021.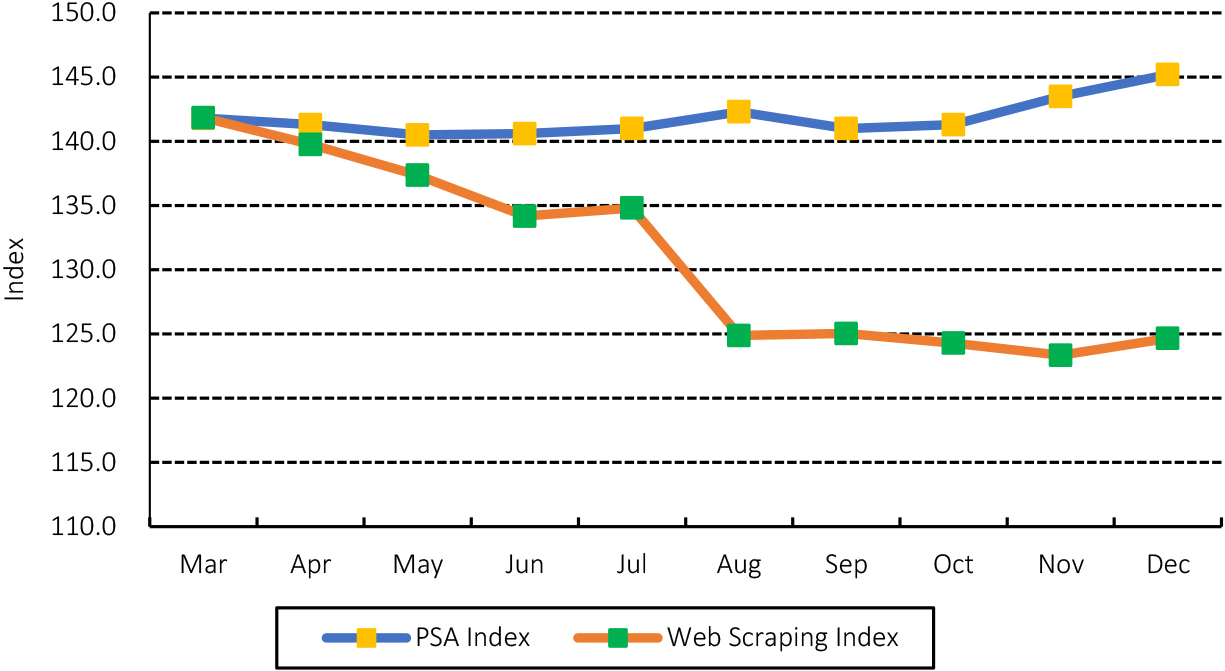
The indices produced using the online prices acquired from the web scraping activities were calculated using the mean and median while adhering to the general procedures used by PSA to calculate the official CPI. The comparison between the PSA official indices and the web scraping indices, and the possible reasons for the differences are explored in this study.
The PSA and web scraping indices in the Food and Non-Alcoholic Beverages Division move downwards from March 2021 to July 2021 when using the mean. A visible decline in the web scraping index from August 2021 was observed, while the movement of the PSA index remained level (Fig. 1). In the Alcoholic Beverages and Tobacco Division, both indices rise until June 2021, but web scraping index drops in July 2021, while PSA remains stable. The PSA indices for the groups of Alcoholic Beverages and Tobacco remained steady for the entire period from March 2021 to December 2021, but the web scraping index fluctuated a lot for the same period (Fig. 2).
When using the median, both the PSA and web scraping indices for Food and Non-Alcoholic Beverages (Fig. 3), and Alcoholic Beverages and Tobacco (Fig. 4) show a clear distinction of month-to-month price movement. In some months, prices change in different directions. The difference in the price movement in Fig. 3 can be clearly seen in October 2021 and November 2021.
The trends between the official and web scraped CPI are different, which can be attributed to the indices being mainly affected by the varied data sources, inconsistencies in web scraped data, and commodities being incorrectly captured.
Challenges encountered during the web scraping activity
Alcoholic beverages, tobacco, and other vegetable-based tobacco products division PSA index vs. web scraping index using the mean approach: March to December 2021.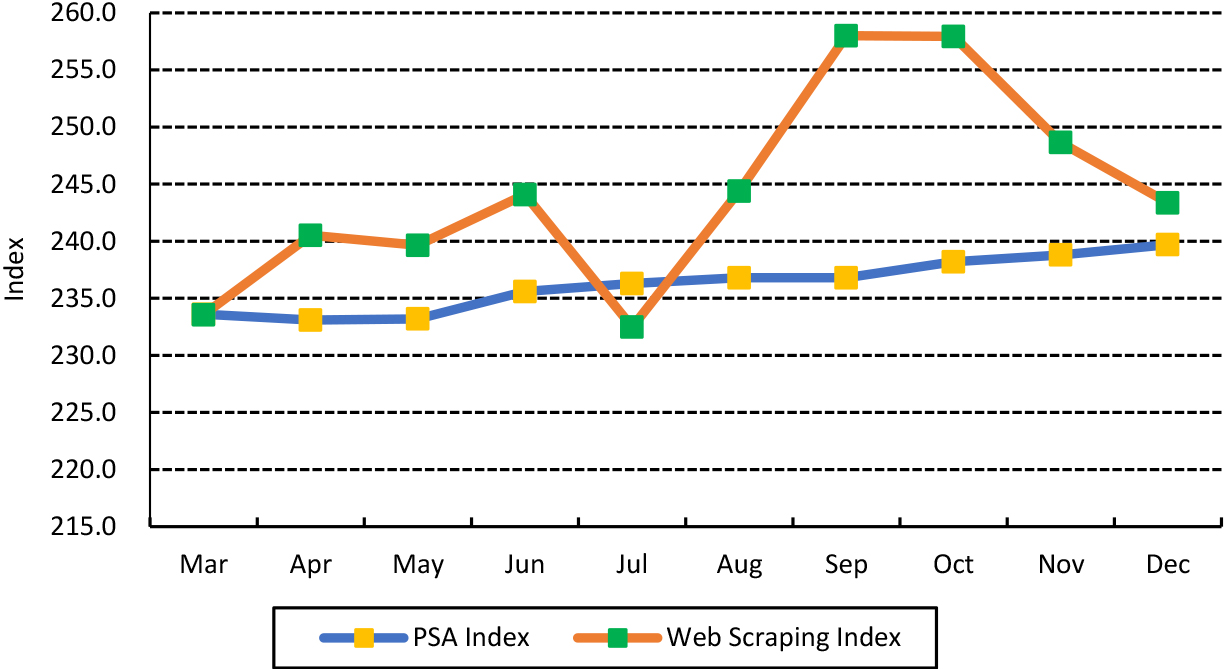
Food and non-alcoholic beverages division PSA index vs. web scraping index using the median approach: March to December 2021.
Alcoholic beverages, tobacco, and other vegetable-based tobacco products division PSA index vs. web scraping index using the median approach: March to December 2021.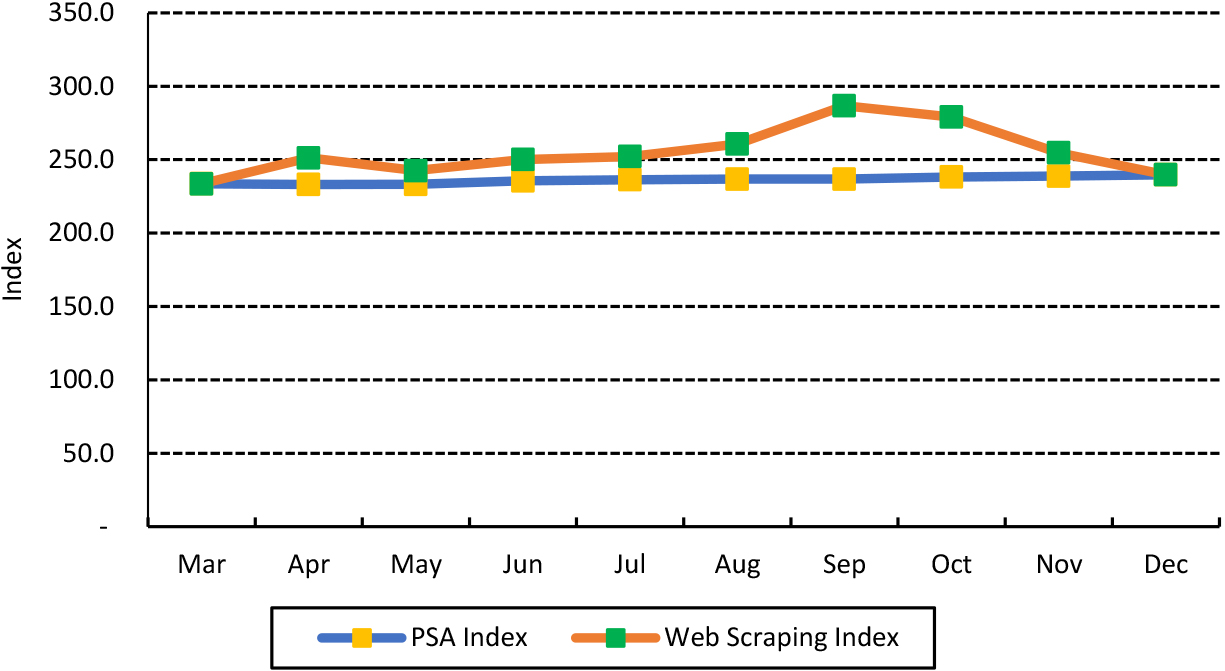
Various challenges were encountered by the researchers during the web scraping activity, each one posing a unique problem that required innovative solutions to navigate through successfully.
One of the main challenges of this web scraping activity is the inconsistencies in the web scraped data as it greatly affects the computed indices. This may be attributed to a couple of factors, including how the structure of the identified websites evolves, making some of them infeasible for web scraping activity over time. These problematic websites require users to manually input their addresses before they can access the website, preventing automated data collection. In addition, the infinite scrolling functionality of dynamic websites further complicates matters. This feature hindered the scraping of a consistent number of goods that caused the sample size to fluctuate, thereby affecting the computed indices. With this, the researchers had to adjust the programs to manage the complicated website structures for the activity.
Incorrectly captured commodities
The web scraping programs that were developed utilize keywords to filter out and scrape the information of commodities belonging to a specific subclass. However, this approach also contributed to the fluctuations in the web scraping indices, given that certain keywords might scrape goods outside of the intended subclass. These erroneous commodities had to be discarded during the data assessment and data cleaning stage, as their prices did not reflect the value of interest.
Varying data sources
The PSA gathers data from both supermarkets and wet markets, whereas most of the prices obtained from web scraping originate from supermarkets. Despite the identification of a website for wet markets, the prices in the said website do not mirror the pricing landscape in actual wet markets. This discrepancy affects the computed web scraping indices, given that the web scraped prices tend to skew higher in comparison to the prices collected by the PSA. Furthermore, the data collection methodology of the PSA is tailored to specific brands of commodities, in contrast to web scraping which gathers all available data from the identified online sources. The contrasting approaches of these two methods contribute to the differences in the computed indices, which underlines the importance of methodological considerations when analyzing the resulting economic indicators.
ICT capacity and programming skills
Given the highly technical nature of web scraping that calls for the utilization of various ICT equipment with relatively high specifications and reliable internet connectivity, conducting a full assessment of the ICT capacity becomes an essential prerequisite prior to undertaking web scraping projects. Alongside this, web scraping demands the involvement of programmers possessing the necessary technical skills for the development and maintenance of programs. These skills must be continuously enhanced and refined to effectively address the evolving demands associated with big data.
Conclusion and recommendations
The paper reviewed various pieces of literature on the use of web scraping to produce official statistics, and calculated the CPI for food and beverages for NCR using the web scraped prices. The calculated CPI was subsequently compared to the official CPI estimate of the PSA. Results showed that the lack of availability of items and prices, and the variation of data sources affect the volatility of estimates. The resulting indices using the web scraped prices, which originated from supermarkets, tend to be higher compared to the official CPI, which is from both the supermarkets and wet markets. Another key distinction between the two methods is the data capture, wherein, web scraping captures all brands that are accessible to the website, while PSA only collects certain brands of goods. Despite these differences, the findings of the study showed the benefits of using web scraping in collecting prices, including, (1) the large amounts of data that can be captured online, (2) the cost-effectiveness of the activity as it eliminates the need to hire people to visit physical stores to collect data, (3) remote data collection, and (4) the data’s real-time availability. With this, it is recommended to explore additional price sources on the web. Nonetheless, the PSA can consider establishing a standard procedure and index for the web scraping of prices in the Philippines for commodities that are available and accessible consistently on the internet.