



Abstract
In Hong Kong, merchandise trade statistics are compiled based on the commodity information given on the trade declarations submitted by traders. Due to the complexity of the standardised commodity classification system (i.e. Hong Kong Harmonized System, or HKHS in short), there are often reporting errors, especially in the commodity codes and quantities. With around 20 million declarations received annually, the availability of this big data source motivates us to adopt deep learning techniques to detect the reporting errors. This paper proposes a mechanism consisting of three deep learning models for checking the commodity code, quantity and value, which offers an end-to-end solution to data quality assurance for declarations. The results show that the proposed mechanism could enhance the accuracy of error detection, which is conducive to improving the quality of trade statistics. With the use of text analytics techniques, the mechanism could fully utilise free-text commodity descriptions declared by traders to check the accuracy of the declared information comprehensively. It also overcomes some limitations of the traditional rule-based models. The whole study demonstrates the potential of using deep learning approach in quality assurance of existing statistical systems for official statistics.
Keywords
Introduction
It is common for traders to make mistakes, whether unintentionally or intentionally, when filling in trade declarations, or commonly known as customs declarations. Customs administrations are most interested in identifying misclassification of commodities imported or exported and undervaluation of them as reported in trade declarations, as this will have impact on the tax and duty rates applied and revenue implications.
Hong Kong is a free port and pursues a free trade policy. No customs tariff is levied on the import or export of goods. Traders are only required to submit trade declarations to the Hong Kong Government within 14 days after shipment of commodities. The information declared in trade declarations are mainly used for compiling trade statistics of Hong Kong.
Like tariff-levied economies, the accuracy of declared commodity code, quantity and value are of crucial importance to Hong Kong to safeguard the quality of trade statistics. We have developed deep learning models as risk assessment tools for checking the accuracy of declared information based on the free-text commodity descriptions and other data fields provided by traders. Deep learning is nowadays preferred in classification and regression tasks for this kind of unstructured data. It often outperforms traditional modeling in terms of predictive performance.
Verification procedures in the data quality assurance mechanism.
The data quality assurance mechanism consists of three deep learning models for checking the commodity code, quantity and value. Results of our exploratory studies show that the deep learning models far outperform the traditional ways, which are mostly rule-based methods and manual efforts, used for decades in ascertaining the correctness of declared information.
In general, a rule-based model comprises a number of checking rules based on the declared data, such as whether the unit value of a particular commodity is within an acceptable range. One limitation of the rule-based model is that it is incapable of handling unstructured text. This means it cannot utilise the informative commodity descriptions.
The deep learning models can identify anomalies more effectively and more precisely, and are even able to detect anomalies that are overlooked by traditional and manual methods. Text analytics is the key to success as it fully utilises the textual commodity descriptions provided by traders in quality assurance.
The use of deep learning models is extensive. Apart from being an integral part of the quality assurance mechanism to safeguard the quality of trade statistics, the predictive models can help customs administrations to accurately determine a goods tariff classification and value, and identify revenue fraud or other illegal activities through intentional misclassification and undervaluation.
Figure 1 illustrates the verification procedures in the data quality assurance mechanism in checking trade declarations. The first step is to verify the declared commodity code. It is crucial to ascertain that the commodity code is corrected as it sets the foundation for subsequent verification of other declared data fields. For instance, the soundness of a unit value or a total value is judged on the basis of a correct commodity code. Errors in unit values may come from the erroneous codes as the unit of quantity may be different for different codes. Therefore, incorrect commodity codes should be rectified before proceeding to the following steps of verifying the quantity and value.
It is a common practice to check the validity of total value and quantity of a declared commodity using its unit value, which is derived from the total value divided by quantity [1]. If the unit value is anomalous, chances are that either the quantity, total value, or both are erroneous. Even if the unit value is not anomalous, there are still chances that the total value is anomalous, for example, the total value may be too extreme for a single trade. In addition, quantity is not required to be reported for some commodity codes, and therefore no unit value is available for verification. After the unit value has been verified, the total value of the commodity is checked, regardless of whether errors in unit value are detected.
Deep learning models are developed to perform verification of each of the above three declared data fields. In this paper, we will discuss the three deep learning models, namely commodity code model, unit value model and total value model.
For customs and statistical needs, it is necessary to use standardised commodity classifications to specify the commodities. The Harmonized System (HS) is a commodity classification system designed by the World Customs Organization (WCO) and it is widely used across the world. Hong Kong has adopted the HS in full under the HKHS since 1992.
Commodities in HKHS Chapter 71 covering metals, jewellery and coins and Chapter 8 covering fruits, nuts and peel will be used as illustration. The data are randomly partitioned by the ratio of 8:2 into the training data for model training and the testing data for model evaluation. Our data contain the verified commodity information of each declaration, which means there are both declared value and verified value for each data field.
Projected vectors of the 30 most frequent words in Chapter 71. These word vectors are learned from Hong Kong trade declarations, and they are projected into 2D space using t-SNE.
To ascertain that there are no anomalies at aggregate level of trade statistics after verification of individual declarations, another model is also developed to perform final quality assurance of the aggregate trade statistics before release. That model will not be discussed in this paper.
Declared commodity description is a data field that is crucial to the deep learning models. Text analytics techniques have been used to develop the models as they can handle the input of free-text (and potentially novel) descriptions. This allows the traders to provide a description as detailed as possible, and enables our models to better differentiate the commodities.
In Hong Kong, traders are allowed to input the commodity descriptions in free text format. From our experience, it is common to see a mix of Chinese and English texts, typos, or unrelated texts. Before any modeling work is done, several text preprocessing steps are developed to specifically address the particular text patterns usually observed in trade declarations. They include lowering English cases, converting simplified Chinese characters into traditional Chinese characters, segmenting Chinese words, etc.
Empirical distributions of logarithmic unit values for silver and gold coins.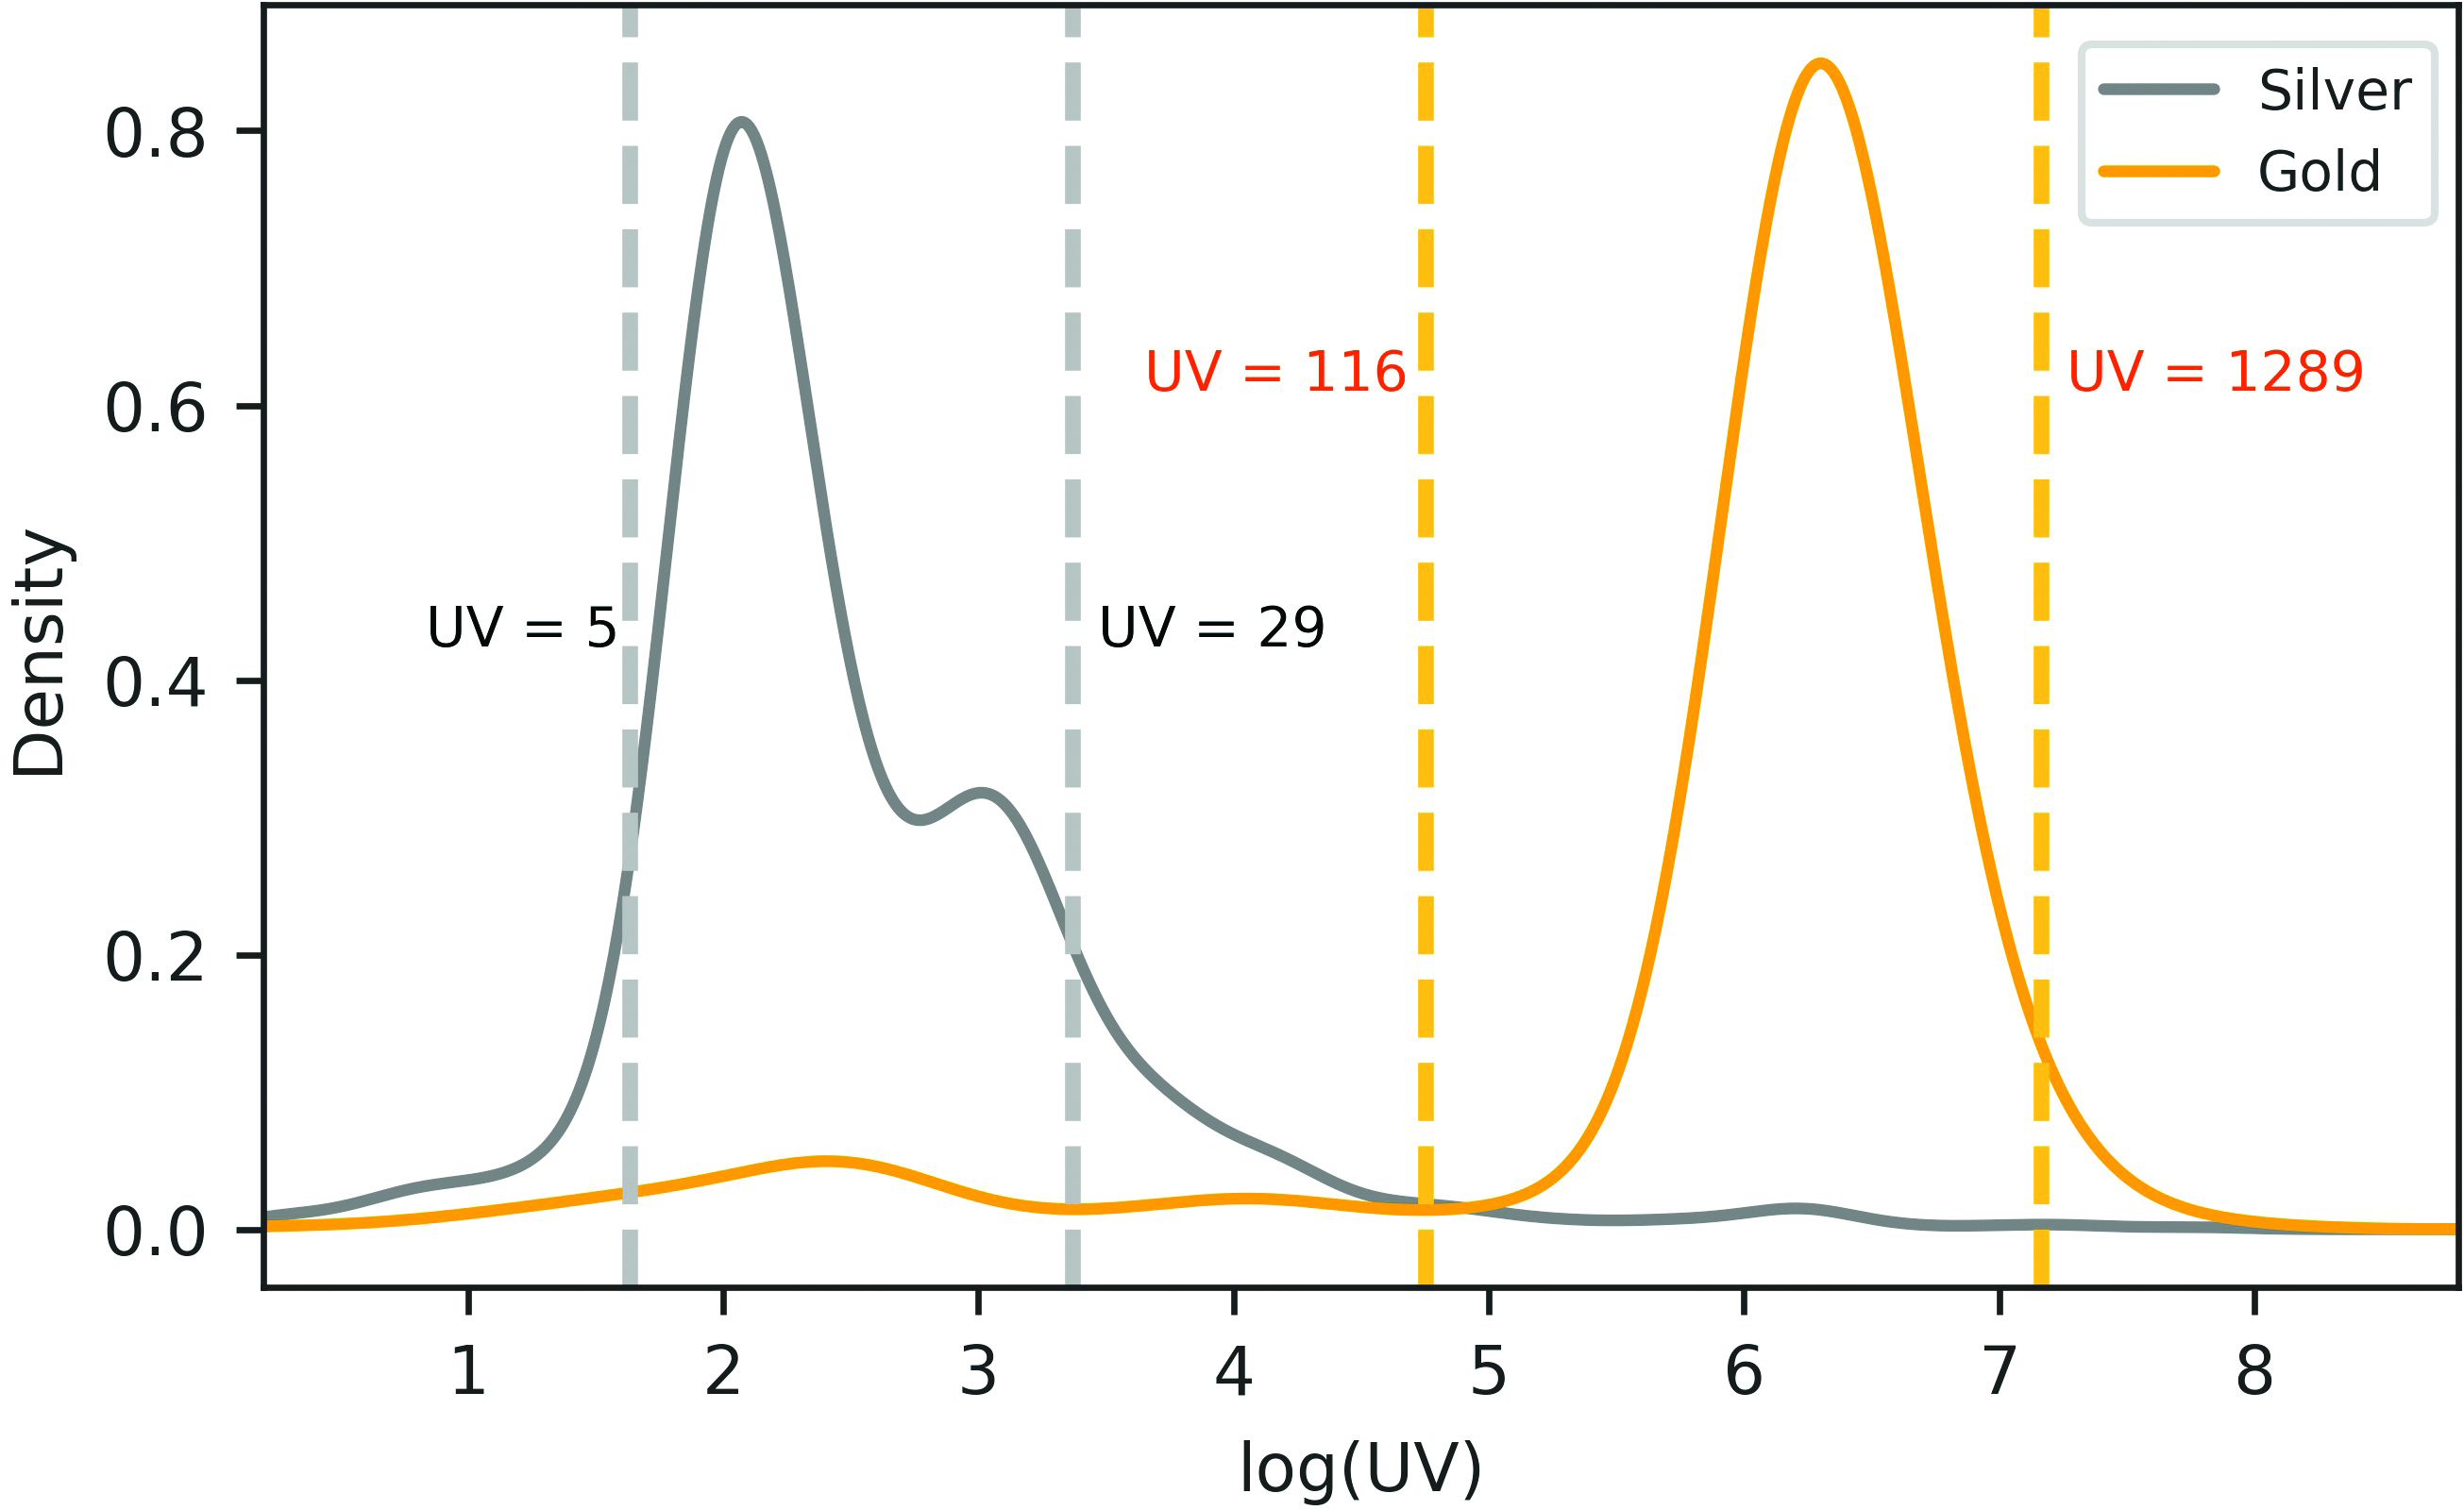
A description is then split into smaller units called words. Word embedding is carried out to transform words into numeric vectors that serve as model input. Word embedding can encode semantic relationships among words, meaning that word vectors carrying similar meaning are closer together.
Due to the unique nature of commodity descriptions found in Hong Kong trade declarations and the tailor-made preprocessing steps for handling them, direct use of pre-trained word vectors downloaded from the web is not effective. Instead, more than 10 million unique descriptions declared in trade declarations have been used for training the word vectors using the Word2vec algorithm [2].
By utilising our own corpus, our learned vectors can better reflect the language usage in Hong Kong trade declarations. For instance, Fig. 2 shows that the words “cut” and “polished” have similar projected vectors (after dimension reduction), and they are often used together to describe a processed diamond, i.e. they have a similar meaning of “processed”. However, this semantic relationship is only true for commodity descriptions in Hong Kong trade declarations. We should thus train our own word vectors.
Commodity code model is a deep learning model developed for verifying the declared commodity code as the first step of verification in the data quality assurance mechanism. The model architecture of the commodity code model is illustrated in Fig. 8. The input of a commodity description is handled by the Gated Convolutional Neural Network (GCNN) [3]. In deep learning, Convolutional Neural Network (CNN) is typically used to handle unstructured data, including text. The gating layer of GCNN is used to further select relevant features within the text.
After inputting the commodity description, country of origin and country of destination, which are not prone to errors based on past experience, into the commodity code model, the model will provide the prediction probability for each of all possible codes. The code having the highest probability is the prediction made by this classification model.
The well-known focal loss [4] is adopted as the loss function since it is suitable for skewed distribution, just like the case of commodity codes. It should be noted that rare commodities account for a much smaller proportion of trade declarations.
Implementation of commodity code model
The prediction confidence can be revealed by a prediction probability. If the highest probability reaches a level above 0.7, the model is considered to be confident on the prediction. For those predicted commodity codes with probability above 0.7, the predicted code is compared against the declared code. If the two codes are the same, the declared code is considered correct. Otherwise, the declared code is rectified by the predicted code. Some commodity descriptions may be too general or too simple, such as broad-brush descriptions in one or two words like “jewellery” and “polished diamonds”, that the model may not be able to make accurate predictions with probability above 0.7. For those cases, traditional methods are used for verification.
Performance of the commodity code model in the verified testing data
Performance of the commodity code model in the verified testing data
The accuracy of the commodity code model is evaluated by comparing predicted codes with verified codes in the verified testing data. Table 1 shows that the commodity code model achieves an overall accuracy of 89.4% for Chapter 71 and 96.5% for Chapter 8. There are 72.7% and 95.6% of predictions that have a highest probability of above 0.7, and the accuracy of these predictions achieves a promising level of 98.2% and 99.1%, respectively.
Improving model prediction by inputting more data fields
Apart from commodity description, two additional data fields, i.e. country of origin and country of destination, are input into the commodity code model, and are proved in our studies to be able to improve model prediction, in particular when dealing with too general or simple commodity descriptions declared. Taking Norway salmon as an example. If the declared description “Fresh Salmon” is input into the model, the model may not be able to make correct prediction between the codes 03021300 for Pacific salmon and 03021400 for Atlantic salmon without inputting the information on country of origin Norway.
Unit value model
After the commodity codes have been verified and corrected by the commodity code model, the accuracy of declared quantity will be checked by means of unit value. The unit value model is developed to verify the accuracy of the unit value of a commodity on the condition that the commodity code is correct. Its output is a predicted distribution of unit values of the commodity.
The issue of aleatoric uncertainty, also known as data uncertainty, has to be dealt with. It refers to the data’s inherent randomness that cannot be eliminated by a model [5]. In our case, the unit value of a commodity is uncertain since it involves a distribution for a specific code, commodity description, country of origin and country of destination. For example, fresh cherries imported from Chile have a wide range of possible unit values.
Knowing a distribution gives a number of benefits. This provides a mean that represents the expected value and a standard deviation that quantifies the uncertainty. A distribution is useful for data quality checking. If a declared unit value lies within a certain interval inside the distribution, the unit value will be accepted. Otherwise, the declared unit value is anomalous and will be rejected. An acceptance testing procedure can then be established.
The unit value model is a probabilistic deep learning model [6], and its model architecture is shown in Fig. 9. There are two output nodes to model the mean and the standard deviation of the conditional normal distribution of logarithmic unit values. The transition from classification to probabilistic regression is implemented in the output layer. After inputting the commodity description, rectified code, country of origin and country of destination into the unit value model, the model outputs a predicted distribution of unit values for that specific commodity.
Implementation of unit value model
The distribution of unit values predicted by the unit value model is used to check the declared unit value. The predicted distribution has two commodity-specific parameters, i.e., mean and standard deviation. The upper threshold (or lower threshold) is defined as the mean plus (or minus) a multiple of the standard deviation. Past experience suggests that the model performance is optimal when the multiplier ranges from three to five. Setting the multiplier is equivalent to controlling the rejection probability of the acceptance test.
If the declared unit value is below the lower threshold or above the upper threshold, it is considered anomalous. On the contrary, if the declared unit value is between the two thresholds, it is considered acceptable and no error in the quantity is detected.
Results of unit value model
In order to investigate whether the unit value model can identify the reporting errors, the model performance is evaluated by comparing the predicted unit values with the verified unit values. A mis-reporting classification problem is examined: whether a declared unit value is anomalous or not matches whether a verified unit value and a declared unit value are different or not.
Performance of the unit value model in the verified testing data
Performance of the unit value model in the verified testing data
Table 2 shows the classification performance in the verified testing data. Since there are far more correct unit values than mis-reported ones, F1 scores should be used for this kind of imbalanced data to focus on the mis-reporting cases. The F1 score is 70.5% for Chapter 71 and 80.8% for Chapter 8. The more homogeneous commodities within Chapter 8 attribute its better performance. Our study also shows that the unit value model outperformed a rule-based model that achieved an F1 score of around 50% only.
Unit value acceptable range generated by the rule-based model. First, the mean (
Logarithmic unit value acceptable ranges generated by the unit value model and the rule-based model. For each trade declaration, the unit value model generates a predicted mean (
Empirical distribution of logarithmic total values under the certain commodity code, country of origin and country of destination.
Procedures of checking a trade declaration using the deep learning models in the data quality assurance mechanism.
Model architecture of the commodity code model.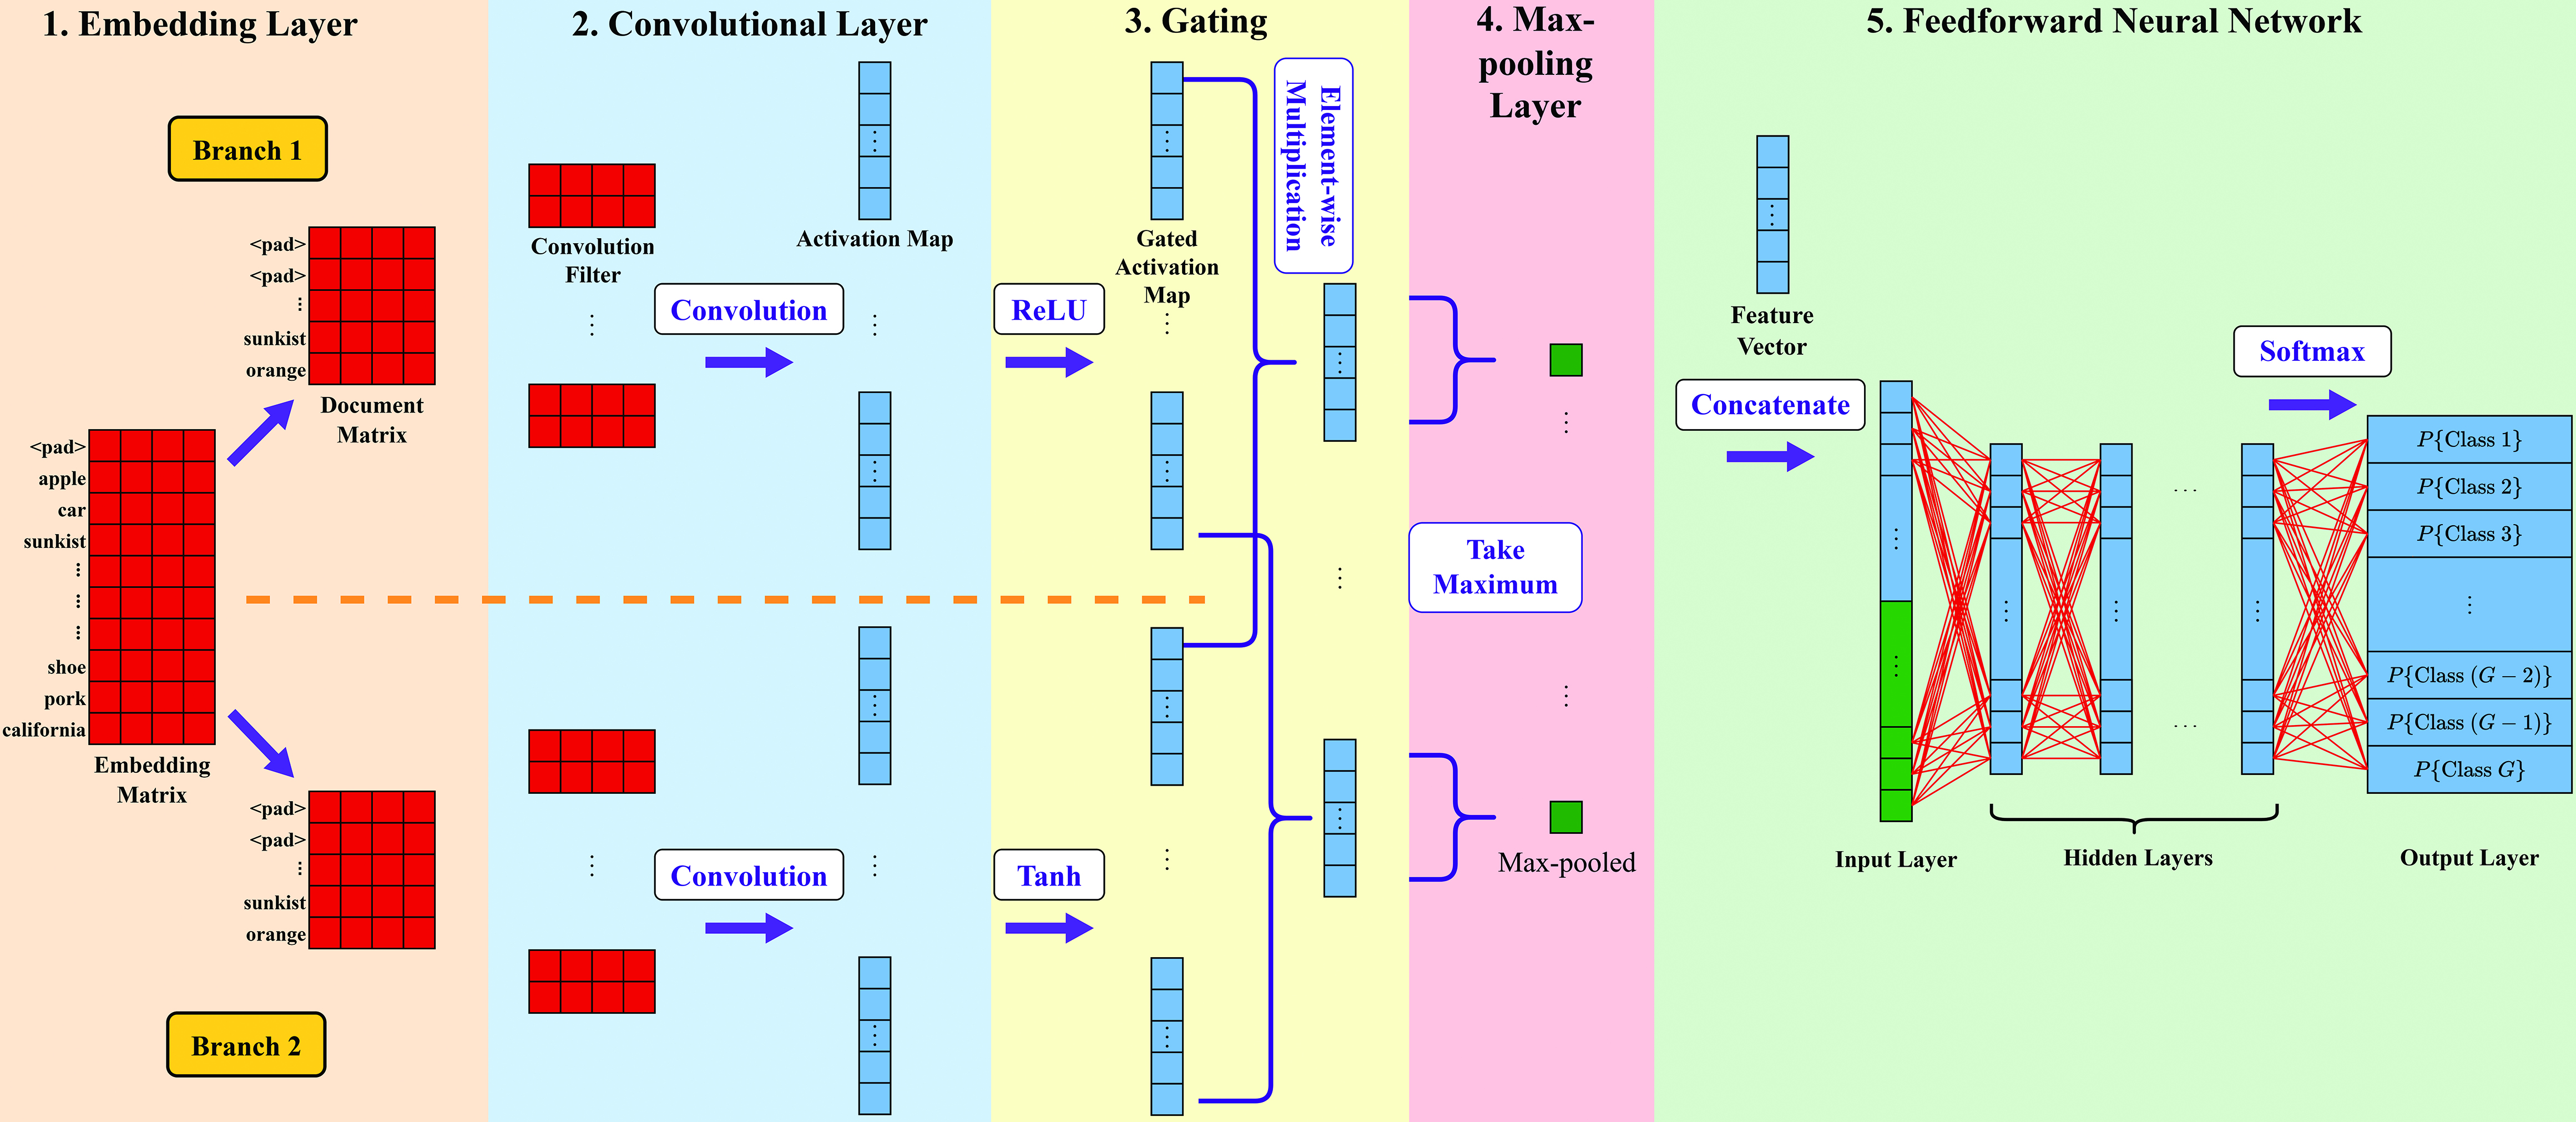
Model architecture of the unit value model and the total value model.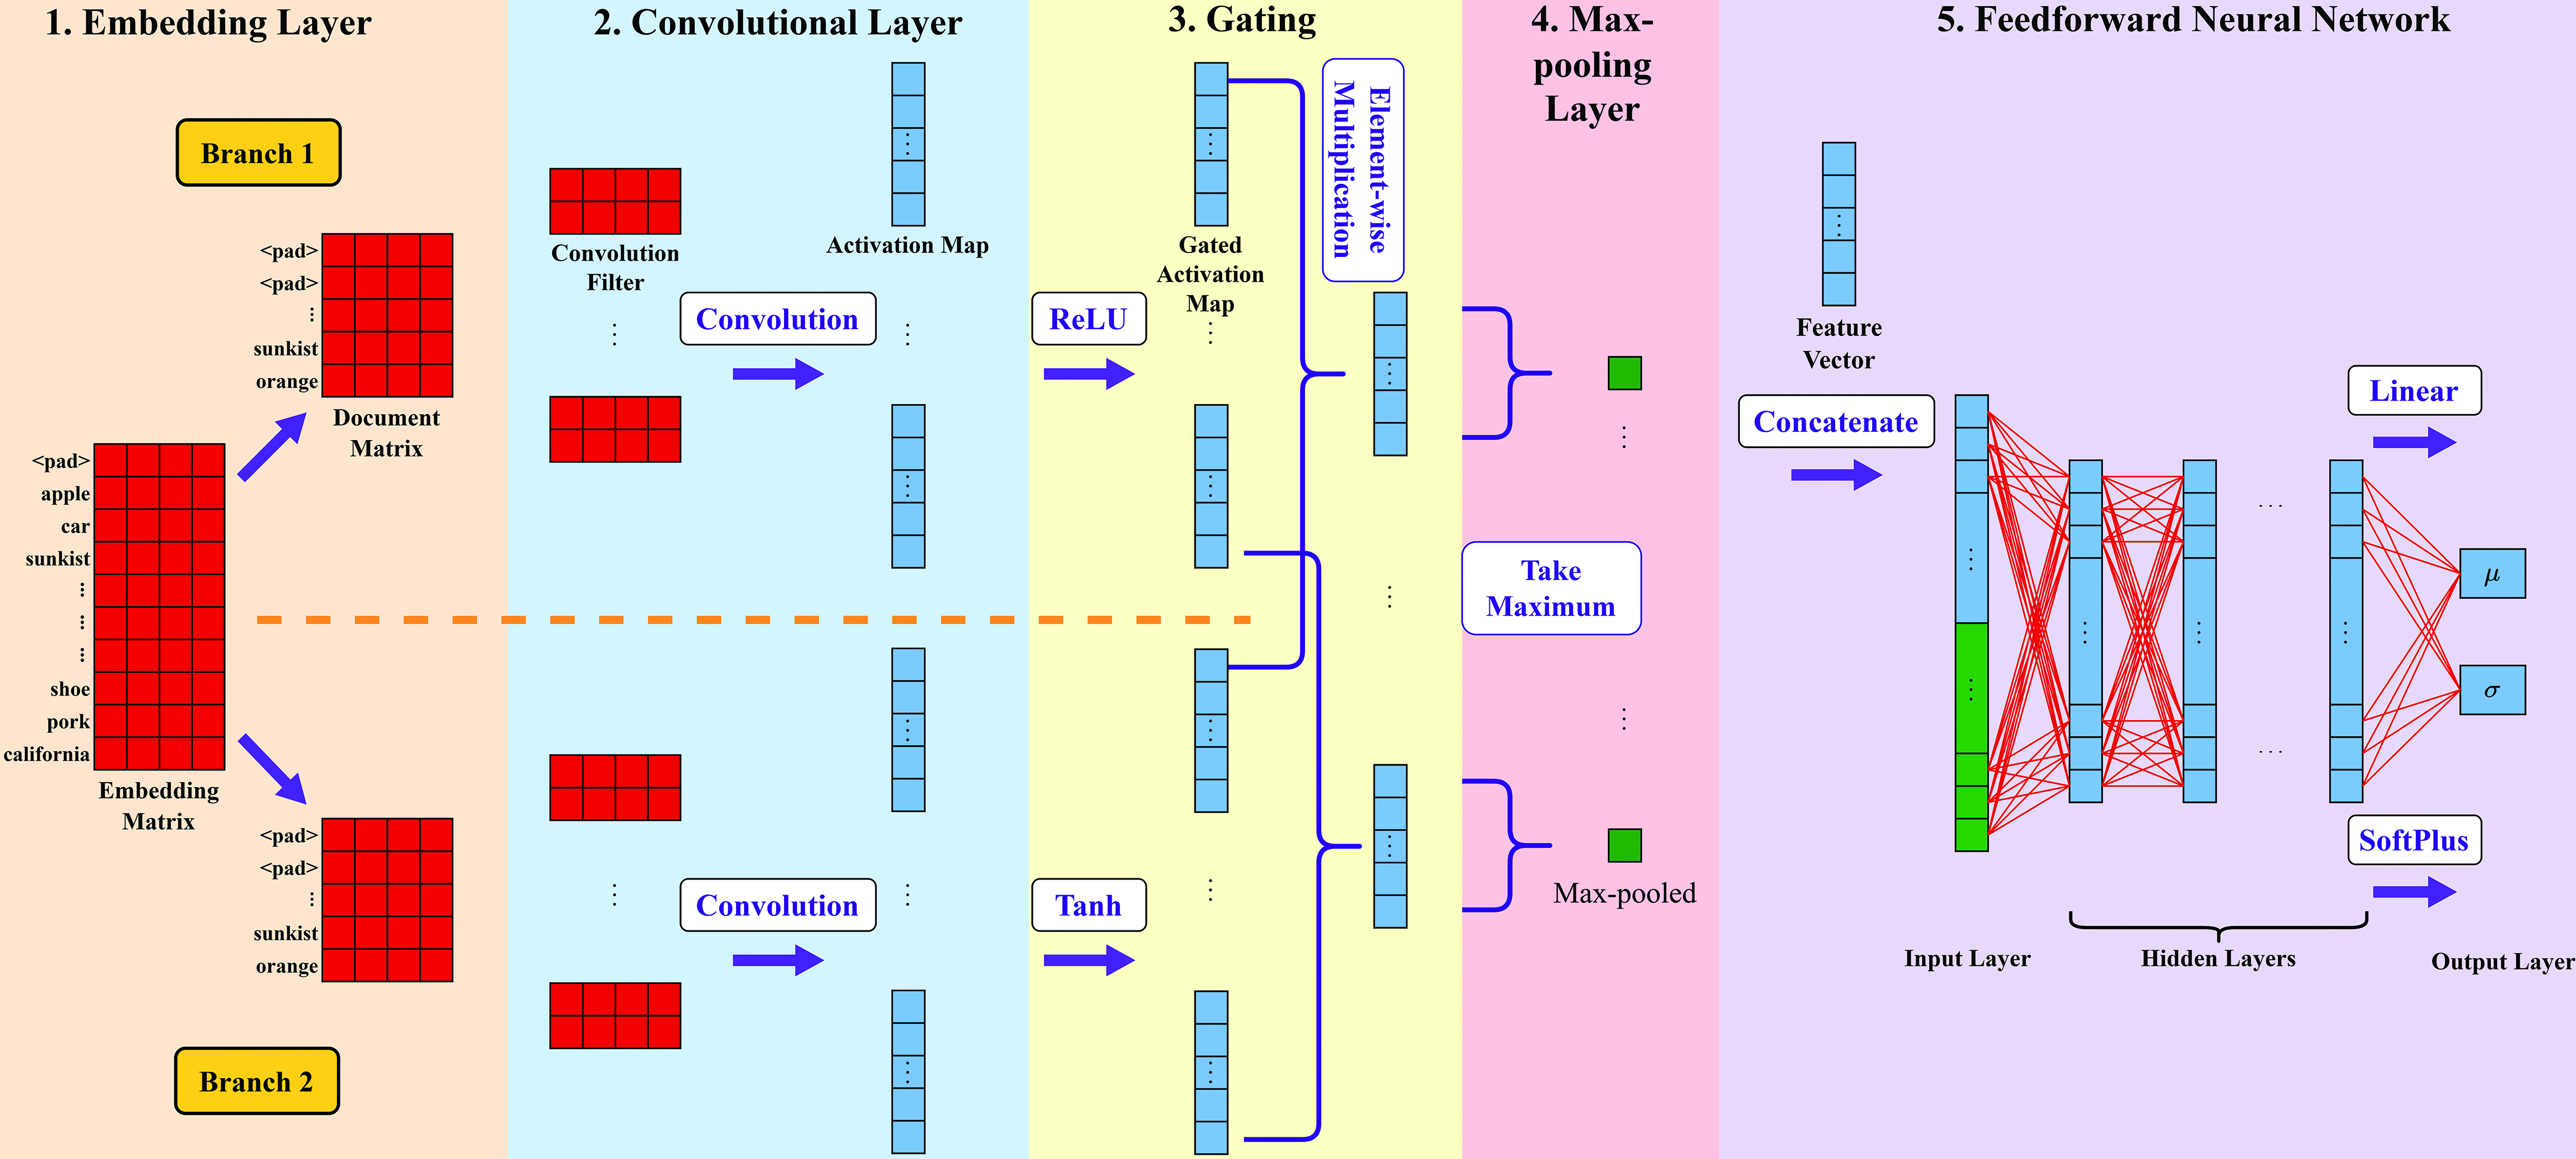
Our acceptable range comes from a predicted unit value distribution, which is determined by a specific commodity information and is more precise than the code-specific distribution in verifying a declared unit value. This approach is particularly suitable for commodities that fall in a commodity code containing heterogeneous commodities.
The commodity code 71189000 includes both gold coins and silver coins. This is an example of a code containing heterogeneous commodities. Figure 3 shows that the unit value of a gold coin is generally higher than that of a silver coin.
Considering two declarations, i.e., a commodity declared with the description “gold coin” and the unit value HK$9.6 per gram, and a commodity declared with the description “silver coin” and the unit value HK$740 per gram. They both had a correctly declared code 71189000. However, it is clear that HK$9.6 per gram is too low for a gold coin and HK$740 per gram is too high for a silver coin.
As shown in Fig. 4, the rule-based model generated a code-specific acceptable range of HK$0.2 per gram to HK$3,366 per gram. This code-specific acceptable range was applied to all commodities within the same commodity code, including gold coins and silver coins. The rule-based model could not detect the two errors since both declared unit values are within that range.
As shown in Fig. 5, the unit value model generated a precise acceptable range for each coin. The unit value model predicted a higher mean of logarithmic unit value for a gold coin, and it is in line with the fact that the unit value of a gold coin is generally higher than that of a silver coin. In addition, the commodity-specific ranges were narrower than the single one produced by the rule-based model.
More importantly, the unit value model could detect the two errors since the declared unit value of the gold coin (HK$9.6 per gram) is below the lower threshold of HK$110 per gram, and the declared unit value of the silver coin (HK$740 per gram) is above the upper threshold of HK$87 per gram.
Total value model
The total value model is very similar to the unit value model in terms of methodologies. The total value model outputs a predicted distribution of total values for a specific commodity.
International experience shows that the declared quantity is a more common source of error than the declared total value [7]. Similar observations are noted in Hong Kong trade declarations.
A simulation study was conducted to evaluate our anomaly detection in the total values. In this study, 5% of testing data were randomly sampled to create the anomalies. For each sample, we let the simulated declared total value be the verified total value plus or minus three standard deviations of verified total values under the same commodity code. For the remaining 95% of testing data, we let the simulated declared total value be the verified total value. For the simulated testing data of Chapter 71, the total value model achieved an F1-score of 81.6%, which is much higher than 60.1% achieved by a rule-based model.
Figure 6 shows an empirical distribution of logarithmic total values under certain criteria. The total value model has successfully identified an anomalous total value and an acceptable total value.
A demonstration of quality checking of trade declarations using models
Figure 7 demonstrates the procedures of checking a trade declaration using the deep learning models. First, the declared commodity code 71131919, which refers to gold jewellery, is verified based on the declared commodity description “925 SILVER EARRING”. The code predicted by the commodity code model is 71131190, which refers to silver jewellery, with a high probability of 0.864, meaning that the model is confident that the predicted code is correct. As the predicted code is different from the declared code, the declared code will be rectified by the predicted code.
After rectifying the incorrect commodity code, the next step is to verify the quantity and the total value. Based on the model prediction of the unit value model, the declared unit value of $0.06 per gram is found to be too small (a left-tail event) for silver jewellery. This indicates that either the declared quantity or the declared total value, or both are incorrect. After verification by the total value model, it shows that the declared total value of $202.2 is within the predicted acceptable range. Therefore, the unit value model and total value model together indicate that the source of error comes from the quantity.
Conclusion
The methodologies, implementation details and results of the three deep learning models in our data quality assurance mechanism for checking trade declarations are discussed in this paper. Results in our studies show that the deep learning models could detect anomalies in the commodity code, quantity and total value declared in trade declarations more effectively, efficiently, and accurately as compared with traditional methods. With the use of text analytics techniques, valuable information stored in the commodity descriptions, together with other data fields in declarations, could be incorporated to enhance the model performance. The application of deep learning models would bring potential benefits and improvements to trade statistics compilation as well as customs clearance in identifying misclassification of commodity code and undervaluation of declared trade value.
Many leading national statistical offices are pursuing application of big data analytics and machine learning in using new sources of data to develop new official statistics or to improve the existing ones. This paper illustrates that, from a wider perspective, the technology could also be applied in the validation and imputation of existing survey or administrative datasets for official statistics, extending the scope from the traditional rule-based approach using structured data to machine learning approach using both structured and unstructured data. This could bring about improvement not only in data quality, but also in efficiency and cost-effectiveness of statistical systems for official statistics.
Footnotes
Acknowledgments
We would like to express our deepest gratitude to all the colleagues who contributed to this paper. We are grateful for the support and guidance from the senior echelons and our supervisor in the Census and Statistics Department, Hong Kong, China, including Leo Yu, Kam-Tim Chau, Kwok-Shun Lau and Clora Chan. We would also like to thank the Selection Committee of 2023 IAOS Prize for Young Statisticians for their appreciation of our work.