
Abstract
Luxembourg, known for its immigration history, attracts immigrants to work. This study analyses different immigrant groups in the labour market from 2014 to 2022 by using Labor Force Survey (LFS) data, Symbolic Data Analysis (SDA), and the Monitoring the Evolution of Clusters (MEC) framework.
Based on the birthplace and length of residence in Luxembourg, in each year, microdata were aggregated into 21 symbolic objects. They were primarily described by 16 modal variables which are multi-valued variables with a frequency attached to each category. Moreover, clustering using complete linkage and the Chernoff’s distance was applied. The Heuristic Identification of Noisy Variables (HINoV) suggested that with just six variables, objects may be grouped homogeneously. The MEC framework traced temporal relations and transitions between the clusters, revealing some movements across the different years.
Results indicate that people from the European Union (EU) and Neighbouring countries have similar profiles while the Portuguese have opposite characteristics. The Luxembourgers are somewhere in between. Profiling people from non-EU countries was challenging.
The data and methodology used make it easy to replicate the work in other nations, enabling comparison of results and monitoring to continue in the future.
Introduction
Immigration to Luxembourg is not a recent phenomenon, it dates back to the late 19th century. Nowadays more than 50% of the population in the country was born abroad, work being the main reason for immigration [1]. These two factors lead Luxembourg to be the EU nation that relies the most on foreign labour to support its national economy [2].
Given this phenomenon, three objectives were defined for the present work. The first one was to understand what differentiates the most the different immigrant groups and the natives in the labour market. Is it age, or education, or the wages …? Based on those results, the main objective was to split the population into homogeneous groups and characterize their profiles in the labour market. The last goal was to portray the groups’ changes over time. By comparing labour market characteristics, it is possible to identify disparities or gaps in employment opportunities and earnings.
Four immigrant groups were considered: NC (people born in a Neighbouring Country – Belgium, France, and Germany), PT (people born in Portugal), EU (people born in a European Union country excluding the previously mentioned countries), and OUTEU (people born in a non-Eu country). This division was made considering the percentage of the population living in Luxembourg that falls into each group. This led to the case of the Portuguese being particularized. According to the 2021 census [3], they represented 30.8% of the foreign population and 14.5% of the total population, followed by the French (16.1%; 7.6%) and the Italians (7.9%; 3.7%).
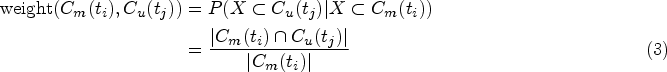
To develop the study, LFS [4] data were used. The data were analysed using Symbolic Data Analysis (SDA) [5] and the Monitoring the Evolution of Clusters (MEC) framework [6]. SDA was used as it is a methodology with multiple advantages in the field of Official Statistics, e.g. it allows for freely sharing results since it deals with aggregated data. While the MEC framework was used to analyse the evolution of clusters over time, enabling verification of changes in immigrant patterns.
Given the data and methodologies used, this study can be easily replicated in other EU and EFTA countries, allowing for a comparison of results and future monitoring. This is the first time that SDA and the MEC framework have been combined, marking a significant advancement in the production of official statistics. By integrating these two approaches, we can capture the dynamic and evolving nature of immigrant profiles with unprecedented detail. This innovation allows for a more comprehensive analysis of how demographic characteristics evolve over time and how they may impact the labour force. The ability to track these changes is essential for developing adaptive and forward-looking immigration, integration, and employment policies, ensuring that official statistics remain relevant and responsive to the complexities of modern migration trends.
This paper is organised as follows. In Section 2, relevant literature is presented. Section 3 introduces the data and software used. It follows Section 4 where the methodology is detailed. In Section 5, we describe the obtained results. Finally, Section 6 provides some concluding remarks and opens avenues for further developments.
Related work
The LFS was selected as the data source for this work. A distinction between the national LFSs and the EU-LFS is important. The former is the survey that is done in each country. The latter is the household sample survey, collated by Eurostat from the LFS data of the participating countries. The EU-LFS is a way of harmonising and comparing labour market data between various countries. There are several overlaps between the two, as the LFSs largely contribute to the EU-LFS. Information on the key elements of the survey, the EU-LFS’s historical development, its legal foundation, its methodology, its statistics, and its publications are detailed in [7].
Various studies on the Luxembourgish labour market, using data from the LFS [8, 9, 10] and other sources [11, 12], conclude that the working conditions are generally better than those in other EU countries, making it attractive for both native and immigrant workers. However, most of the works use the population as a whole; when immigrant groups are considered, generally only one year is taken into account which does not allow to have an idea of the evolution of the outcomes.
The data were analysed using mainly SDA. Its use in Official Statistics has been demonstrated in some works. In [13], SDA is applied to the European Social Survey and the Time Use Survey. In [14], applications of SDA are also discussed using the Portuguese Time Use Survey. In [15], SDA is used to analyse Census data of the Office for National Statistics from the United Kingdom and to analyse the Portuguese and the Basque Country LFS data. Applications of SDA to the Portuguese LFS can be found in [16] and in [17]. However, none of the mentioned works use immigrant population groups as the basis for the study. Through the development of SDA, two European projects were launched: the Symbolic Objects Data Analysis System (SODAS) project1 and the Analysis System of Symbolic Official data (ASSO) project2 [18]. As a result SODAS and SODAS2 Software, to analyse symbolic data, were developed.
Lastly, to the best of our knowledge, no work has been published combining the use of LFS, SDA and the MEC framework.
Data and software
Labour Force Survey
The EU-LFS is the largest sample survey of private households population in Europe and is the primary European source for information on the labour market [19]. It provides quarterly and yearly data on the labour market, which are used to monitor the employment situation in the EU and to develop, coordinate, and evaluate employment policies at both national and EU levels. It is important to note that the LFS only gathers data from people who have an official residence in the country, as this is one of the requirements for inclusion in the sample. As a consequence, this work doesn’t capture the country’s entire work force, but rather the work force made up of residents (immigrants and natives). In this work, the annual Luxembourgish LFS data from 2014 to 2022 were used. The cohort of working people under study were the employees since they make up around 90% of the Luxembourgish labour force every year. The majority of variables selected follow the EU-LFS guidelines, nevertheless, there are a couple that are specifically collected in Luxembourg. Furthermore, only the main job is analysed. To achieve the final results, and after preprocessing the data, six out of 16 variables were considered the most relevant for the analysis and are described below. Except for EARNINGDEC, their names match those in the Luxembourgish LFS data dictionary.
COUNTRYB – country of birth. It has the following categories: LU (people born in Luxembourg), NC (people born in a Neighbouring Country – Belgium, France, and Germany), PT (people born in Portugal), EU (people born in a European Union country excluding the previously mentioned countries), and OUTEU (people born in a non-Eu country). This division was made taking into account the percentage of the population living in Luxembourg that falls into each group. Until 2019, people born in the United Kingdom fell in the EU category, nevertheless since Brexit, they fall within the OUTEU category. For simplicity reasons, even though Portugal, Luxembourg, and the Neighbouring Countries belong to the EU, when EU countries are mentioned, these five countries are excluded. YEARESID – duration of stay in the country in completed years. It has the following categories: 1: 0 ISCO4D – occupation in the main job. It has the following categories: 1: White-collar high-skilled professions; 2: White-collar low-skilled professions; 3: Blue-collar high-skilled professions; 4: Blue-collar low-skilled professions. TELEARB – ability to do remote work. Variable specifically collected in Luxembourg. It has the following categories: 1: Yes; 2: No. HATLEVEL – highest level of education completed. It has the following categories: 1: Until High School (included); 2: Any level between High School and Bachelor (included); 3: Master or PhD. NACE3D – economic activity of the local unit for the main job. It has the following categories: 1: Agriculture; 2: Industry; 3: Construction; 4: Trade, transport and hospitality; 5: Information and communication; 6: Financial and insurance activities; 7: Real state activities; 8: Business services; 9: Public administration, defence, education, health and social work; 10: Arts, entertainment and recreation, and other service activities. DEGURBA – degree of urbanisation of the area where the person has his/her usual residence. It has the following categories: 1: Cities; 2: Towns and Suburbs; 3: Rural areas. EARNINGDEC – decile below which the monthly pay from the main job falls. It has the following categories: 1: Person earns a value corresponding to the first decile or less; 2: Person earns a value between the first and the second (included) deciles; …10: Person earns a value between the ninth and the tenth deciles.
The other 10 variables that were primarily used but were considered not to add any relevant information beyond the six key variables mentioned above were: SIZEFIRM (size of the local unit for the main job), FTPT (full-or part-time main job (self-defined)), EARNSATISF (satisfaction with the earnings – variable only collected by Statec), SUPVISOR (supervisory responsibilities in main job), WISHMORE (wish to work more than the current number of usual hours), AGE (age in completed years), YSTARTWK (year in which the person started working in the current main job), NUMJOB (number of jobs), LOOKOJ (looking for another job), and SEX.
The survey in Luxembourg has its specificities. In 2014, the sampling units were the households and they were selected by the procedure of random digit dialling. From 2015 onwards simple random sampling is used and people are sampled from the population register. Moreover, a rotational scheme has been applied since then and each individual stays in the sample for five quarters. Even though the sampling unit is the individual, all the individuals included in the sampling unit’s household have to answer some questions. Weights are computed so that the sample is representative of the population. In a simplified way, strata are defined based on sex, age class, household size, and nationality (national/foreign). To compute the weights, the total population in each stratum is divided by the number of interviewed people in the same stratum and all the people in each stratum have the same weight [20].
Software
R [21] was the software selected to do all the analysis. Although some changes in the source codes were required, the symbolicDA package [22] serves as a basis for a major part of the work. Other important packages include VIM [23] to handle the missing values, RSDA [24] used for the creation of a symbolic data table, and fpc [25] used for the clustering validity indices.
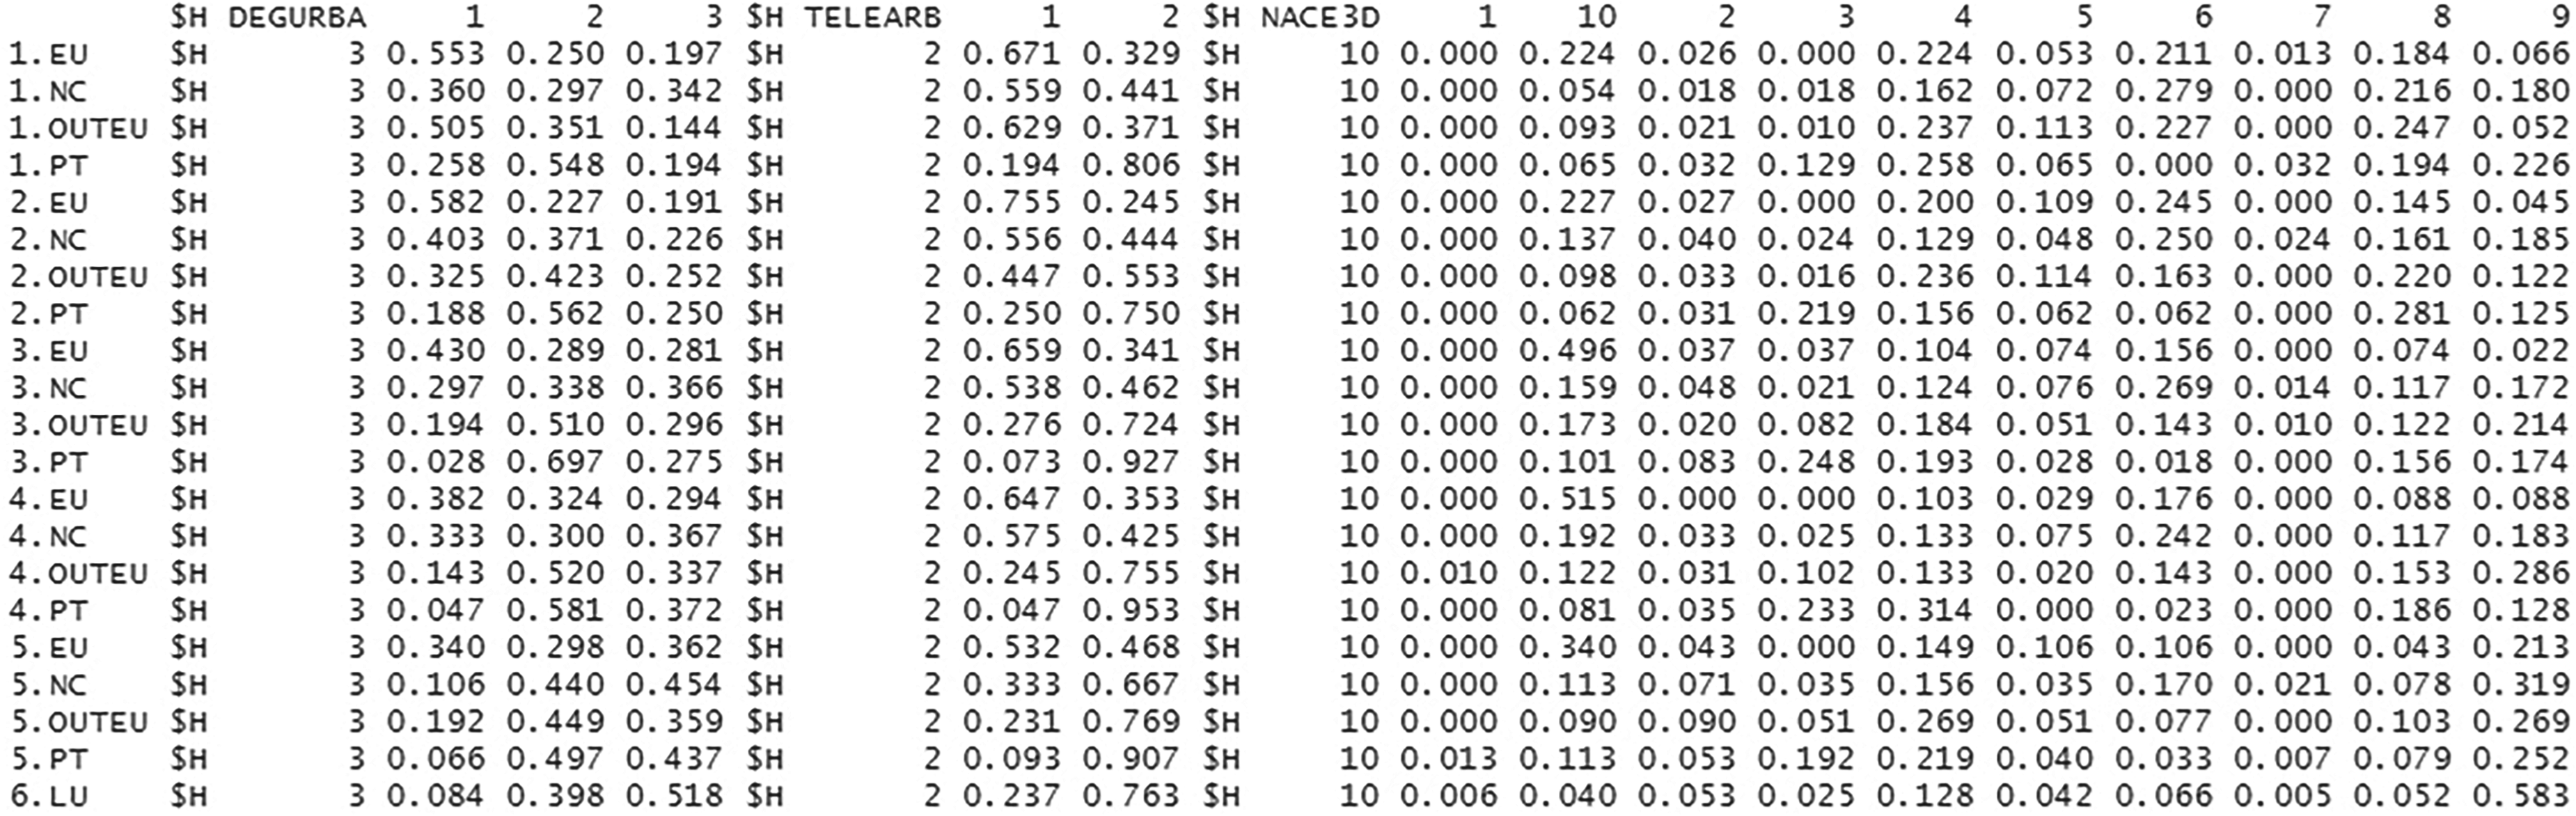
Extract from a symbolic data table of 2022 produced by the RSDA package.
Symbolic Data Analysis
The data were analysed using SDA [5], an approach that is concerned with the analysis of data that exhibit inherent variability. SDA provides a framework to represent and analyse groups (the symbolic objects) and not individuals, gathered based on some given criteria. Symbolic data are represented as an extension of the classical tabular model where each variable may take more than one single value for each unit; in particular, objects may be described by distributions [26]. Given this, new types of variables were introduced. There are still numerical and categorical variables. Within the numerical variables, we may consider: single-valued (real or integer) variables which take a single value of an underlying domain for each unit, multi-valued variables whose values are finite subsets of the domain, and interval-valued variables whose values are intervals of

SDA has advantages compared to the standard approach. The standard approach to analyse groups is to compute means, modes, or medians, ignoring much information and limiting comparison between different groups, while SDA accounts for intrinsic variability in data. SDA gets around the problem of dealing with enormous volumes of data by using data compression. Furthermore, it has particular advantages in the field of Official Statistics. The National Statistical Institutes are very limited in sharing individual respondent information (corresponding to micro-data of individual persons or businesses) due to privacy reasons and in accordance with each country’s regulations. Thus, analyzing aggregated data allows for freely sharing results. Lastly, it allows different independent surveys made on the same population to be combined, if the same variables are used to form groups.
To obtain the results, all micro-data were submitted to pre-processing tasks such as discretization and missing values imputation. Then, the variables YEARESID (to compare the profile of recent immigrants with the profile of the more established ones) and COUNTRYB (to compare the experiences of different groups) were selected for aggregation. The cartesian product of the categories of both variables led to 21 symbolic objects, in each year, that were primarily described by 16 modal variables. For each year the data were aggregated and a symbolic data table was created. In Figure 1 it is possible to observe an extract from the table of 2022. In the first column, the numbers 1 to 6 are the codes for the variable YEARESID, while the EU, NC, OUTEU, PT and LU are the categories of the variable COUNTRYB. The variables DEGURBA, TELEARB and NACE3D were aggregated into categorical modal variables. Picking up the first line as an example: 1.EU represent the people who were born in an EU country and have been living in Luxembourg for four years or less. One may say that in 2022, 55.3% of the people in this group lived in Cities, while 25.0% lived in Towns and Suburbs and 19.7% in Rural Areas. A similar analysis can be done for the other symbolic objects and the remaining variables.
The main objective of the work was to split the Luxembourgish population into homogeneous groups, considering labour market characteristics, and describing their profiles. For this purpose, cluster analysis was selected to explore the data. More concretely, the hierarchical clustering algorithm using complete linkage and the Chernoff’s distance of order
When applied to symbolic data it works in the same way as with classical data, one just needs to define an appropriate dissimilarity matrix between the units to be clustered.
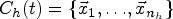
Given two discrete probability distributions

where
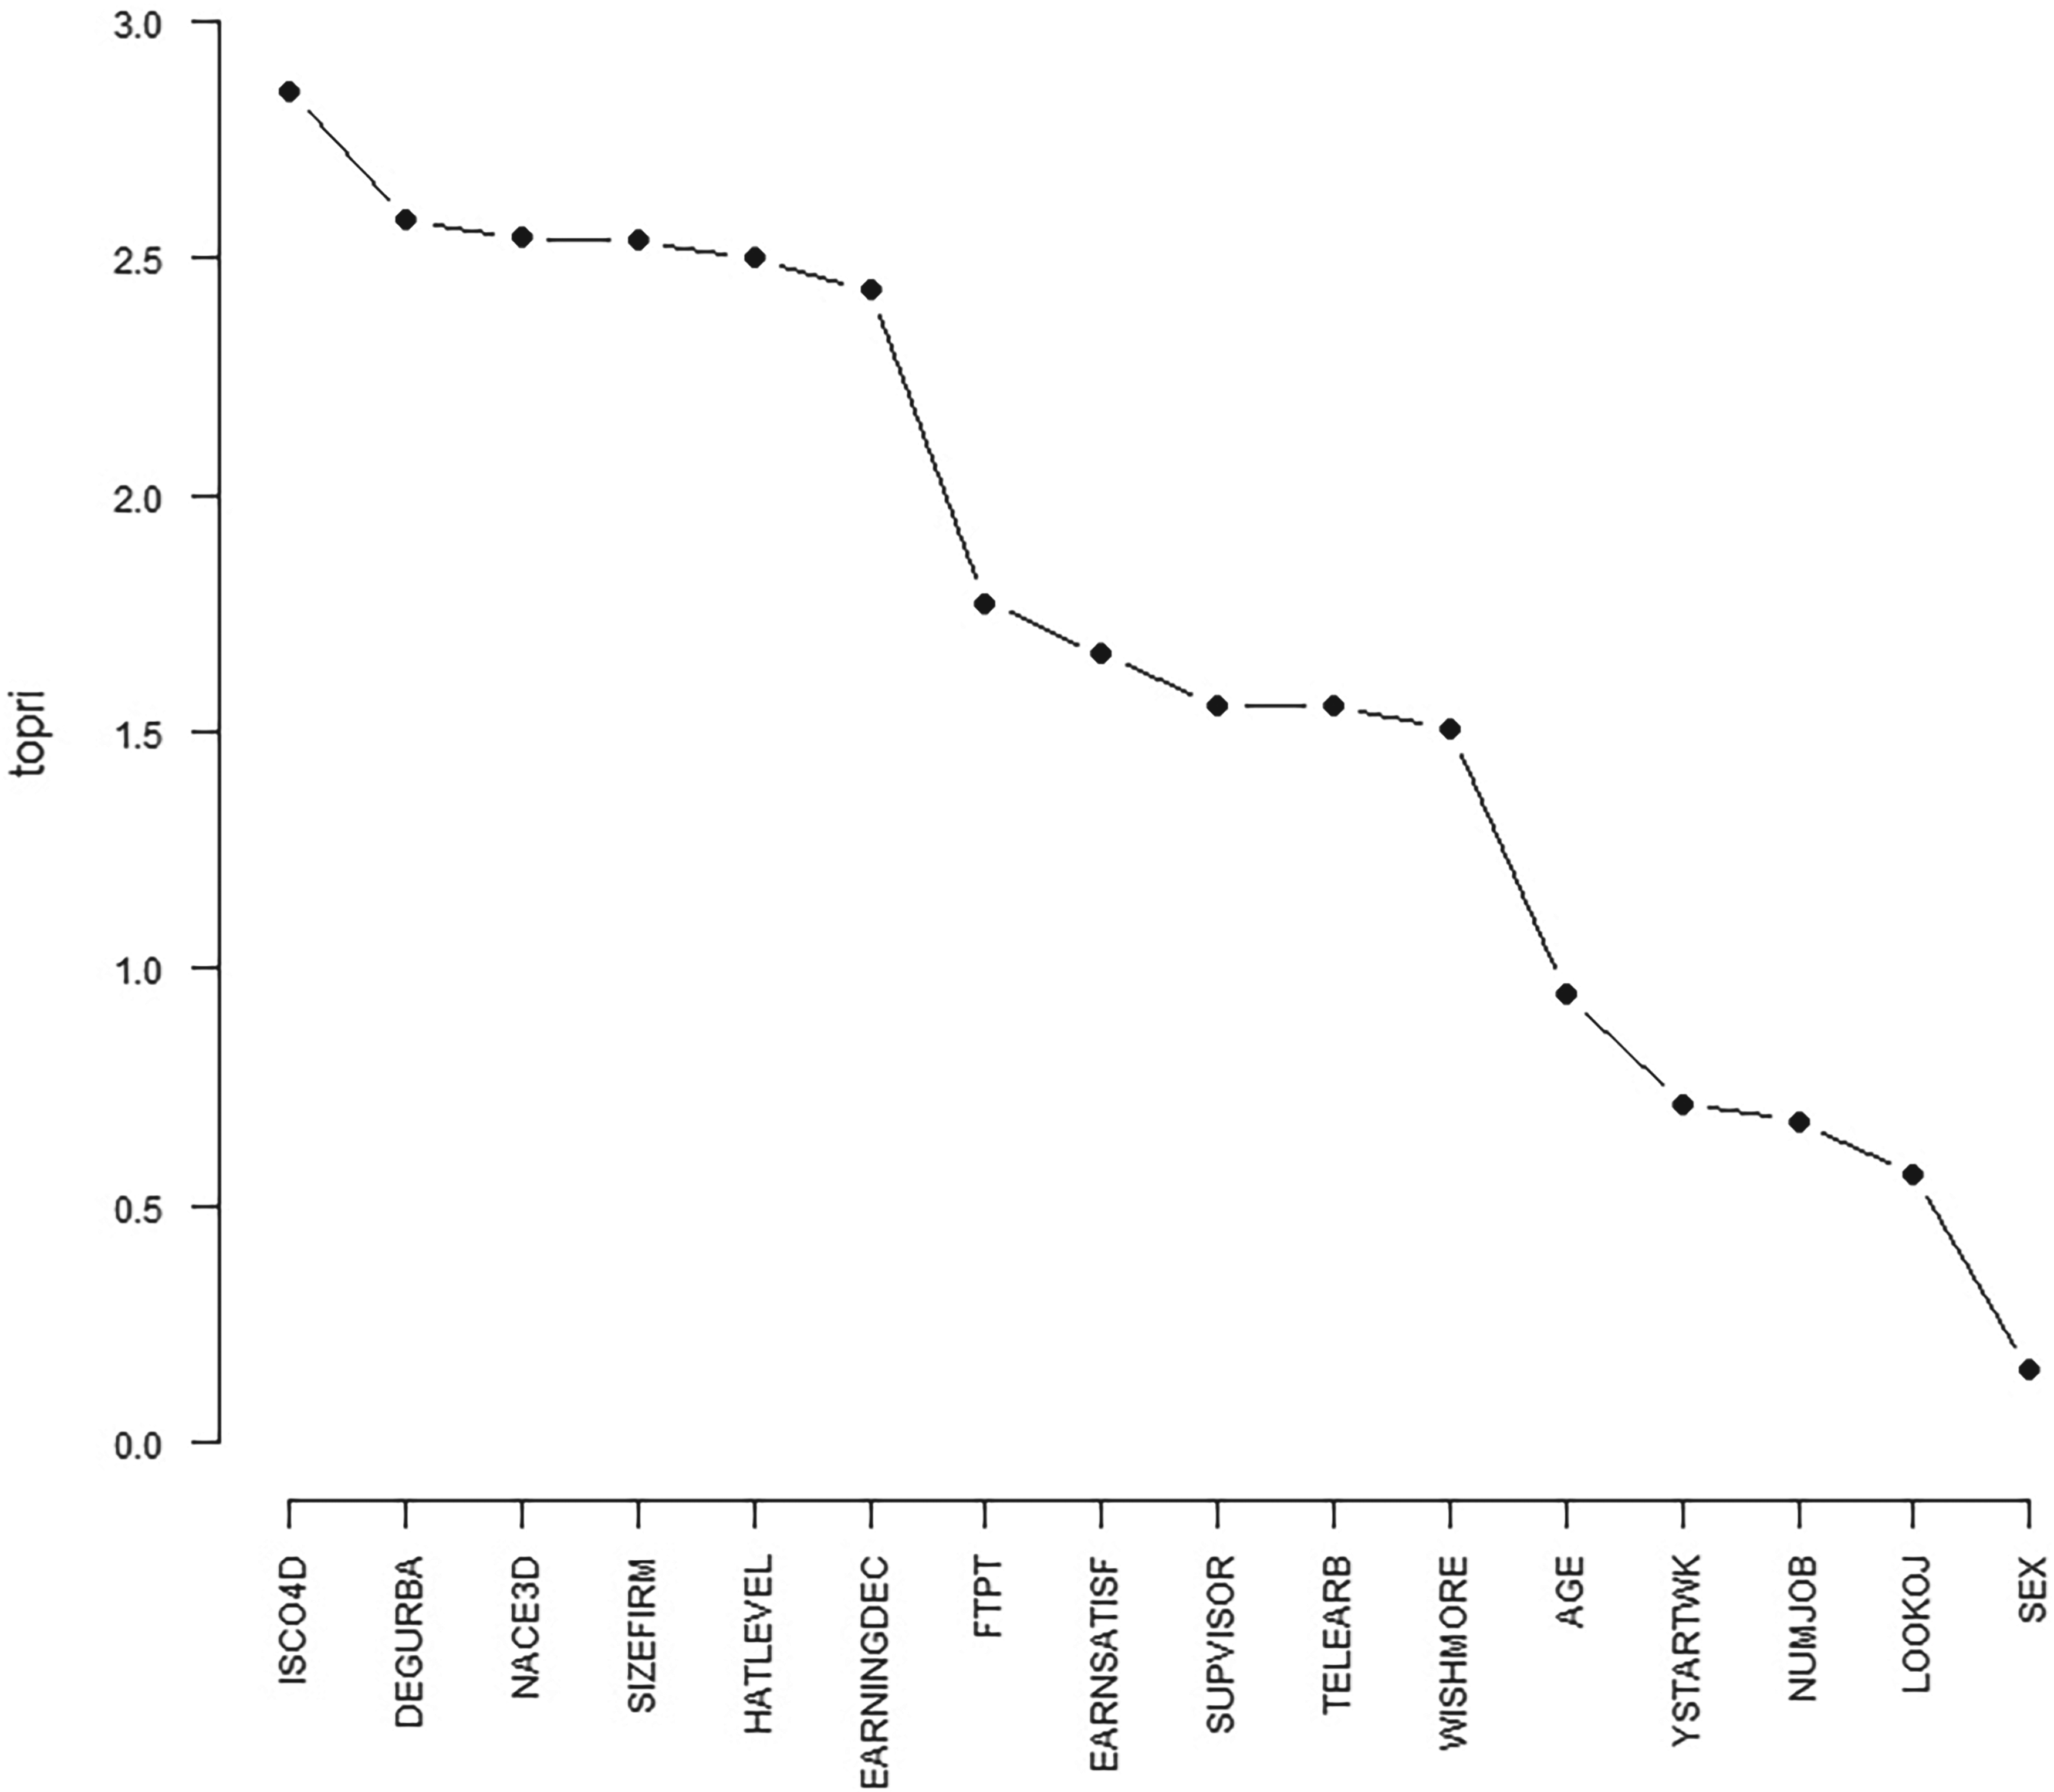
TOPRI plot for 2015 (all variables).
When the symbolic objects

where,
To avoid using variables with minimal cluster information, an extended version of the algorithm Heuristic Identification of Noisy Variables (HINoV) proposed in [32] was used. The Adjusted Rand Index (ARI) [33], an index of agreement between partitions, is the basis of this technique.
A plot like the one in Figure 2 was made for each year. The Total Pairwise Rand Index (TOPRI) values for noisy variables are significantly smaller than those for the non-noisy variables and the scree diagram allows for the identification of sharp changes in those values. The variables chosen were those that over the nine years under analysis were at the top seven times or more. This allowed reducing the set of 16 variables to just six – DEGURBA, TELEARB, NACE3D, ISCO4D, HATLEVEL, and EARNINGDEC.
To monitor the clusters’ transitions through time the MEC framework proposed in [34] was used. It aims at solving the problem of monitoring cluster transitions over time, through the identification of temporal relations between these structures. In the enumeration representation (the one used), a cluster is characterized by the observations that have been assigned to it by a given clustering algorithm. Formally, it is defined as follows:
Let
where
This representation is based on graphs and conditional probabilities. For this work, it is suggested that oriented edges are considered (see Figure 3). Formally, the MEC framework for clusters in enumeration representation is defined in the following way:
Given the partitions
This framework introduced a new taxonomic scheme for the classification of cluster transitions, including Birth, Death, Split, Merge, and Survival of clusters. All of them can be identified by using the conditional probabilities, the Survival threshold (
This methodology was key to study the evolution of the obtained clusters, as a way of understanding the changes in the work conditions through time.
First, as discussed in Subsection 3.1, in 2014 the LFS methodology was different when compared with the methodology that has been used since 2015. That is, in 2015 a rotational scheme started to be applied and the way the sample is selected also changed. The differences in methodology may influence the results.
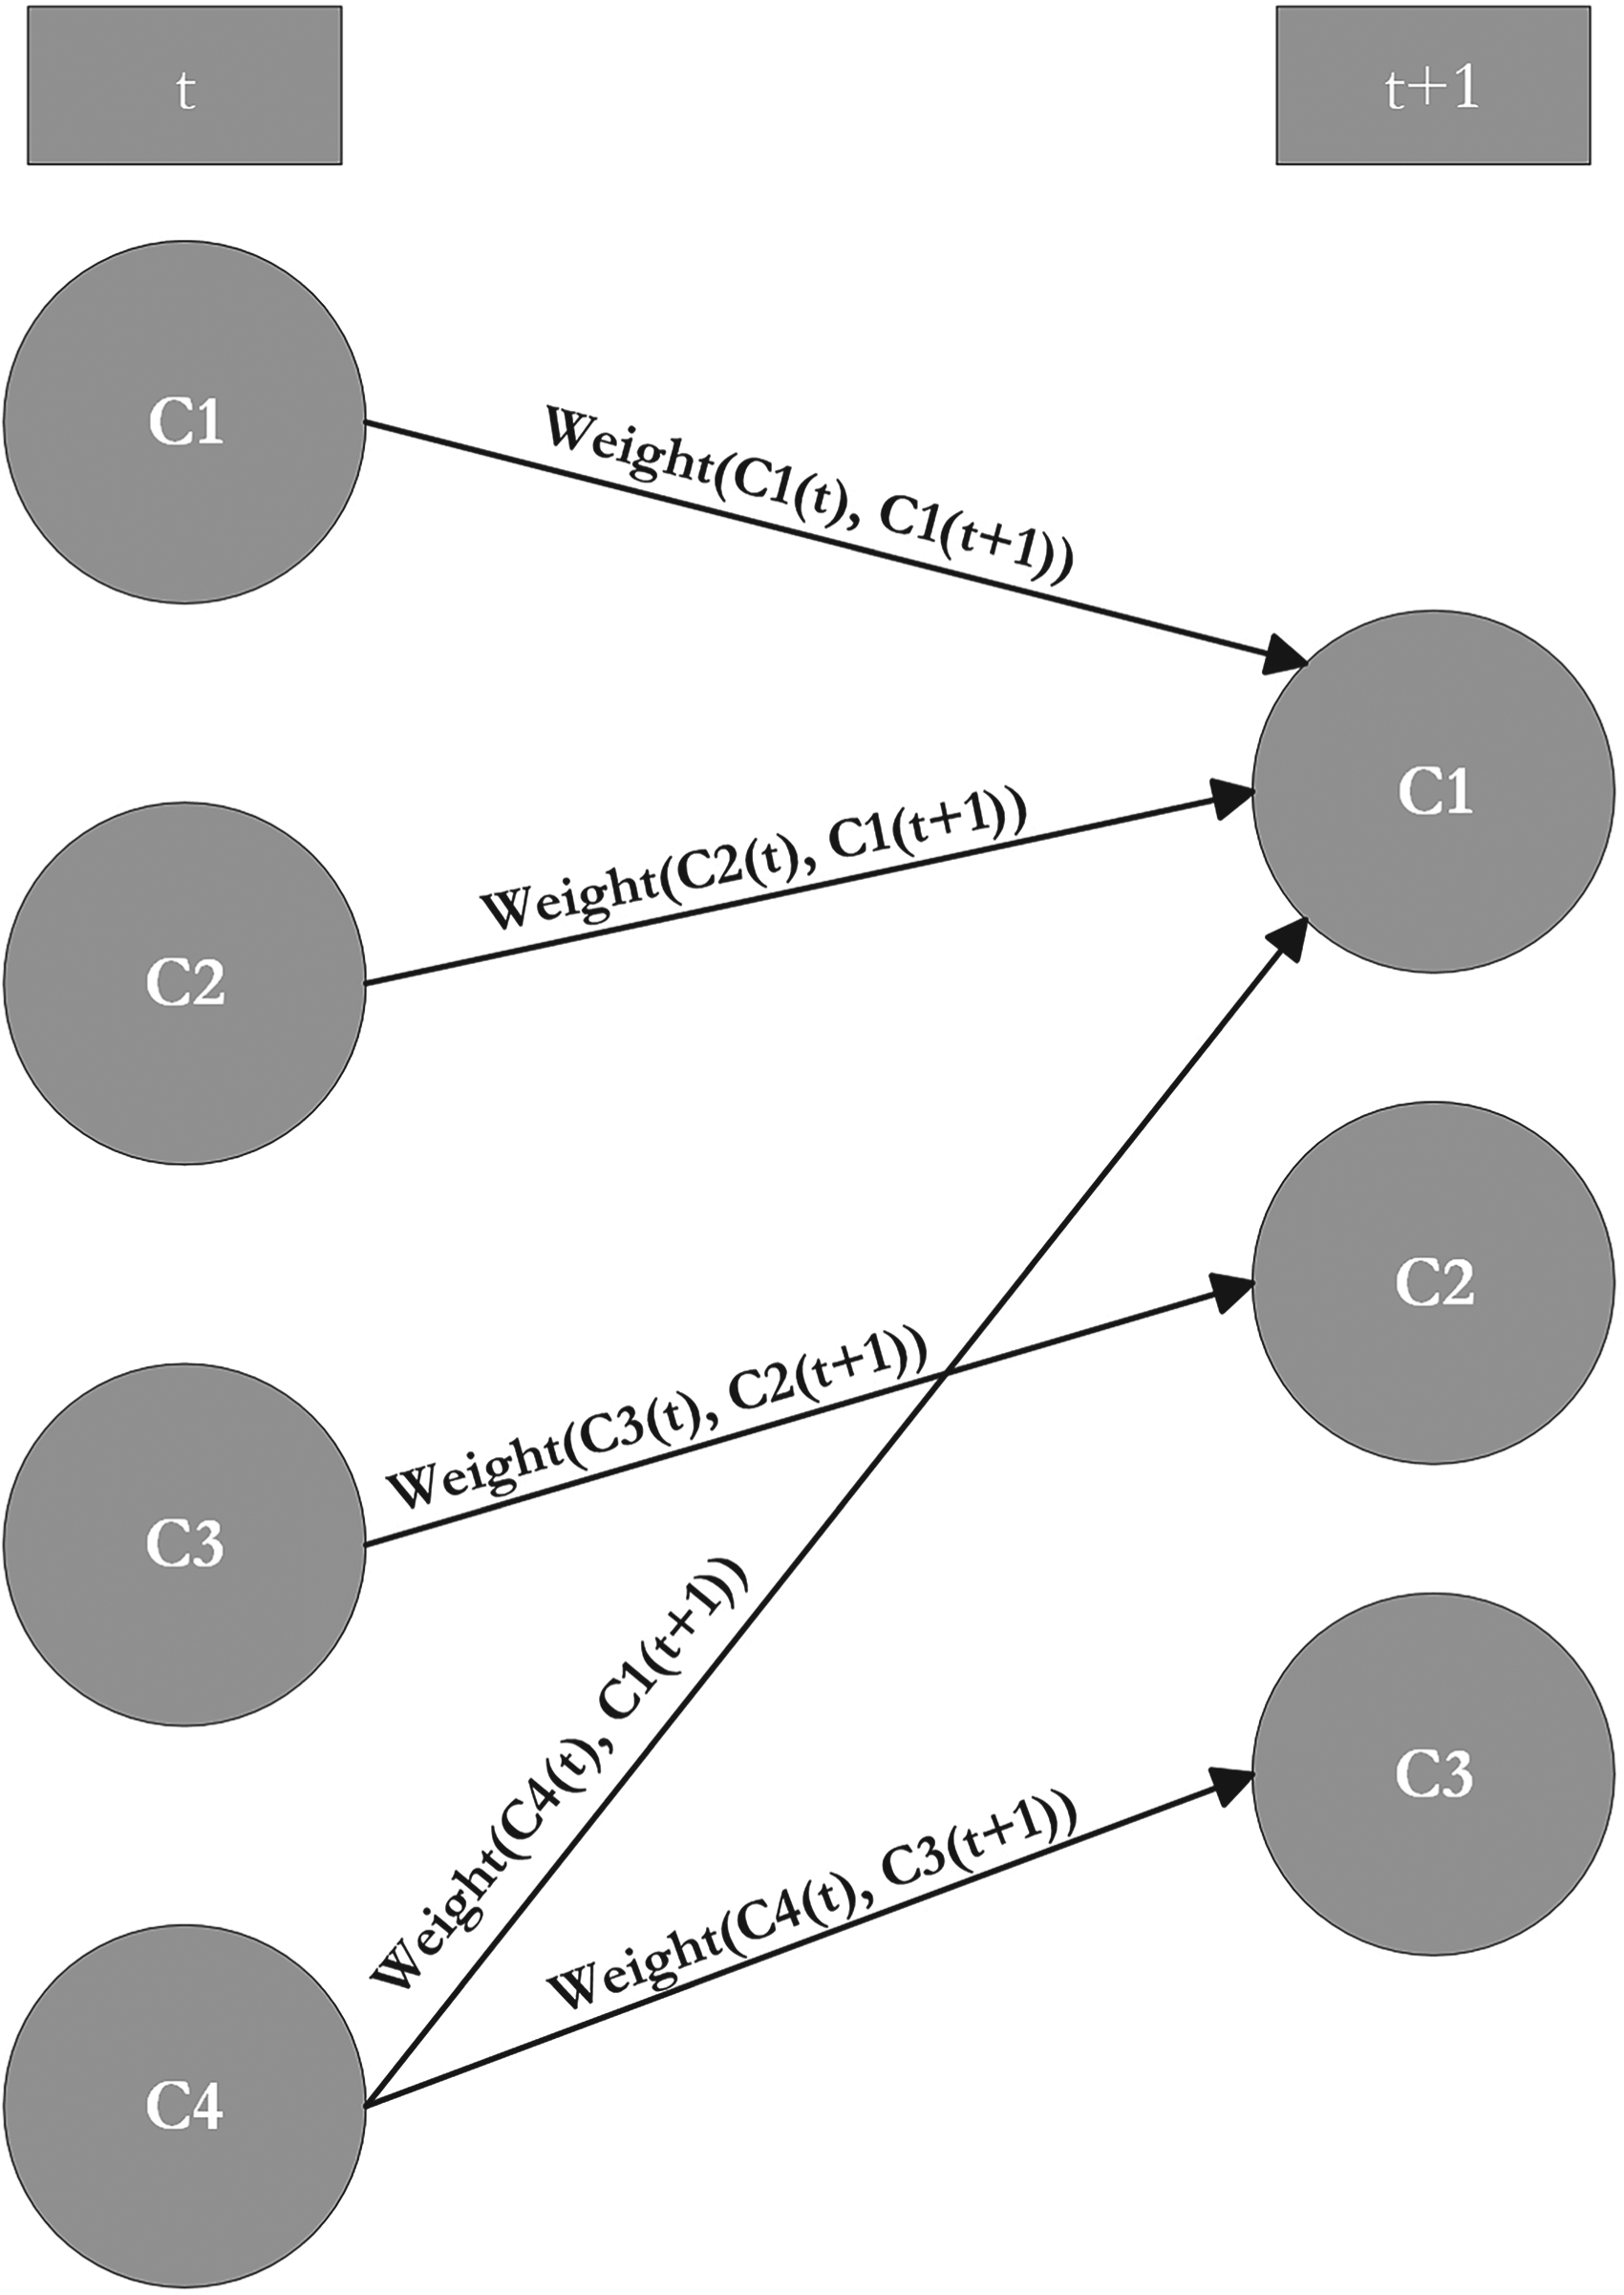
MEC Graph representation.
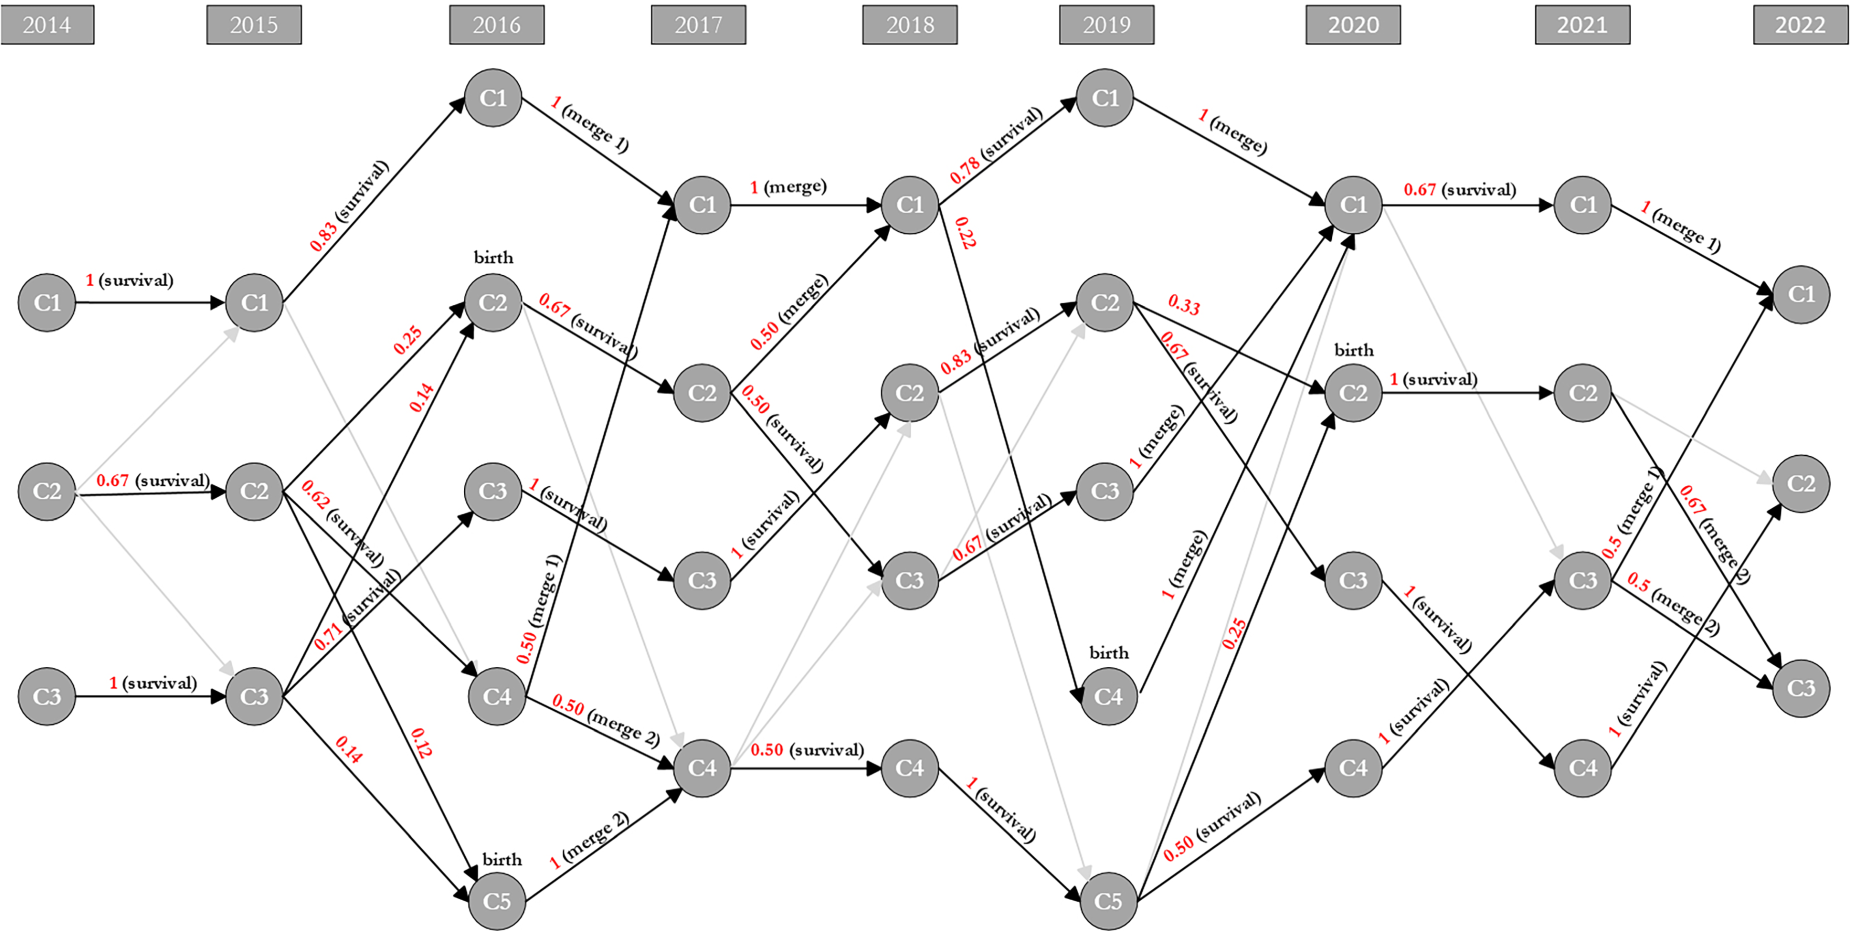
Transitions Identification – Cluster Monitoring Graph 2014–2022.
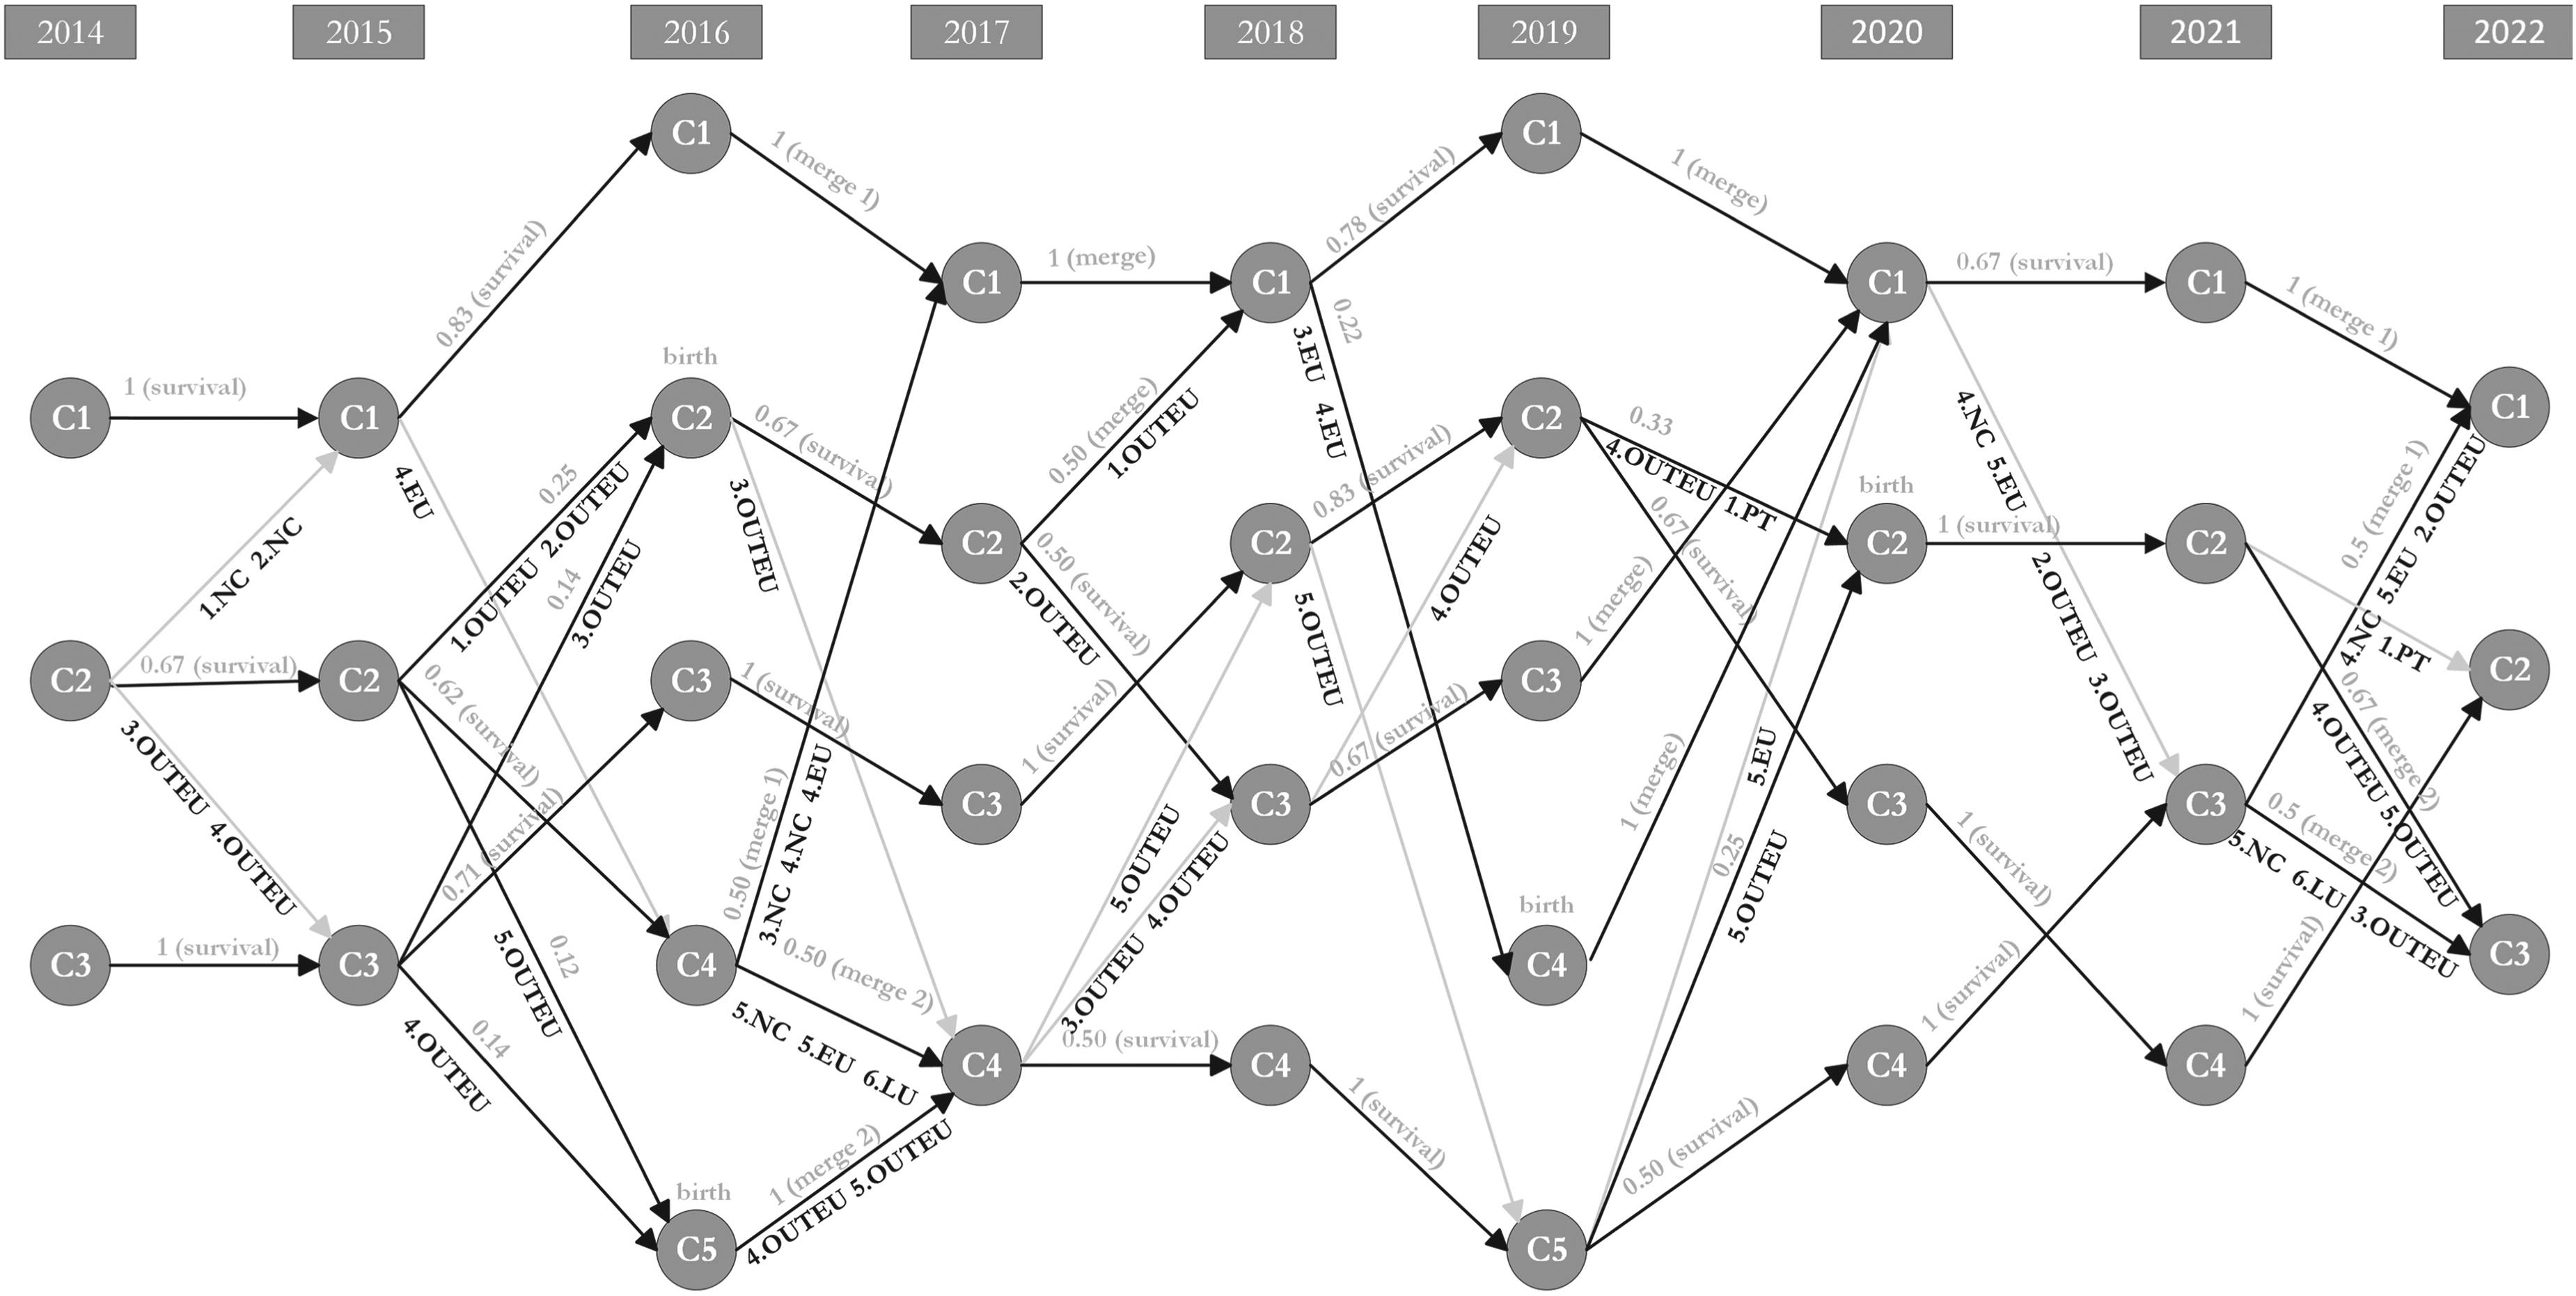
Objects’ Movements – Cluster Monitoring Graph 2014–2022.
To get the results, the following steps were considered. For each year, the hierarchical algorithm was applied to the set of 21 symbolic objects described by the distributions of six modal variables. Note that these 21 objects correspond to groups in the population and not to individuals; Based on the dendrograms and three validity indices – Silhouette [29], Index G2 [30] and Index G3 [31] – a partition into
The dendrograms’ (Figures S1 to S9 in the SM) maximum heights (3.26, 2.21, 2.11, 2.09, 1.71, 1.53, 1.95, 2.03, 2.31, from 2014 to 2022, respectively) revealed that the objects were getting closer until the Brexit and the start of the Pandemic. This could mean that the disparities between groups were decreasing but these two events helped to reverse what was happening.
The Portuguese groups are almost always together in a cluster (Table S11 in the SM), more concretely in seven out of the nine years. Sometimes they form a cluster on their own, other times they are together with some OUTEU groups. These clusters are usually characterized by work in blue-collar professions, low levels of education, low wages and work in construction, trade, transport, and hospitality. Results also indicate that there is a relation between being Portuguese and living in the suburbs. Lastly, it was possible to see that teleworking is not common among Portuguese groups. This may be explained by the fact that blue-collar professions are the most prevalent among them, making the implementation of telework challenging. However, things may be changing as the proportion of recently arrived immigrants (group 1.PT) that have a Master’s degree or a PhD is increasing. This may have an impact on the type of professions and wages. Monitoring needs to be done in the future to see if things are truly changing.
The 1.EU, 2.EU, 3.EU, 4.EU, 1.NC, 2.NC, 3.NC, 4.NC groups tend to be together in the same cluster (Table S11 in the SM). These clusters are usually characterized by work in white-collar high-skilled professions, more concretely, in Financial and insurance activities and in Arts, entertainment and recreation and other service activities, living in cities, having high wages and, since the pandemic, by the ability to do telework. Having a high education level (Bachelor’s or higher) is also a characteristic of these clusters, with a special emphasis on the percentage of people with a Master’s degree or a PhD compared to the other clusters.
The 5.NC and 6.LU groups are always together in a cluster with or without other groups (Table S11 in the SM). These clusters are mainly characterized by work in white-collar professions (high and low-skilled), medium education levels, no ability to do telework, working in Public administration, defence, education, health and social work activities and living in rural areas. The 5.EU group is also in the same cluster as these two groups in seven out of nine years. Although the majority of jobs in Public administration in Luxembourg are open to EU citizens [35], the fact that most positions require candidates to demonstrate adequate knowledge of the administrative languages [36] – French, Luxembourgish, and German – may help to explain why a sizable portion of those employed in this sector are natives.
The OUTEU groups are the ones that move more between clusters (Table S11 in the SM), consequently, it was not possible to find any kind of pattern as the OUTEU groups include people who were born in countries with very different levels of development. In some years there is a greater predominance of some nationalities, in other years, others predominate and this variation means that the characteristics of symbolic objects can vary considerably from year to year. For example, with Brexit, there was an increase in the number of people with British nationality in each of the groups and therefore also an increase in the education level.
Lastly, the variables’ distributions per object allow concluding that, regardless of the place of birth, the Business service sector is usually widespread among recently arrived people (YEARESID
In Figure 4, one may see the results of the MEC framework application. All the transitions that have been identified are labelled in the figure. One may see a lot of movements throughout the years. By analysing it, one may conclude that clusters
Luxembourg has a long history of immigration. In this work, with six variables, the Luxembourgish population was split and different labour market profiles were identified. Symbolic Data Analysis techniques, the MEC framework, and the Luxembourgish LFS data were crucial to obtain the results. Some of the conclusions are in line with existing research. For example, the fact that non-Luxembourg nationals are generally more likely to have a higher level of education than Luxembourgers which is not the case for Portuguese nationals, who have significantly fewer university degrees [8]. Other findings were new, like the importance of the degree of urbanisation to split the population into homogeneous groups.
The limitations of this work lie in the inherent constraints of the data and techniques used. One of the major constraints lies in the tools that are currently available to aggregate microdata and analyse symbolic data. Thus, it is suggested the exploration and use of other clustering algorithms that have already been described in the literature. Furthermore, to be part of the LFS sample, people must be officially resident in the country where the data are collected. Consequently, the present work does not capture all the work force of the country (it excludes the cross-border workers) but focuses on studying the working conditions of residents. To get a complete picture of the country’s workforce and to extend the present analysis, data from other surveys should be combined with the LFS data.
This analysis could be replicated in countries with high immigration rates where the EU-LFS is performed to compare patterns with those in Luxembourg. However, some variables used are not EU-harmonised, consequently, some changes must be made to make a fair comparison between countries, e.g., choosing only variables from the EU-LFS.
Finally, the major contribution of this work lies in the use of a methodology, SDA, that is not yet widely used in Official Statistics but has an important application in this field. This is the first time that SDA and the MEC framework have been combined, marking a significant advancement in the production of official statistics. By integrating these two approaches, we can capture the dynamic and evolving nature of immigrant profiles with unprecedented detail. This innovation allows for a more comprehensive analysis of how demographic characteristics evolve over time and how they may impact the labour force. Particularly, in this work, it was possible to verify that the profile of Portuguese immigrants arriving in Luxembourg nowadays may differ from the past, with a greater proportion of people with higher education levels. The ability to track these shifts is essential for developing adaptive and forward-looking immigration, integration, and employment policies, ensuring that official statistics remain relevant and responsive to the complexities of modern migration trends.
Supplementray Figs and Tables
Footnotes
Acknowledgments
This work was done through a partnership between the Faculty of Economics of the University of Porto and the National Institute of Statistics and Economic Studies of the Grand Duchy of Luxembourg under the European Master in Official Statistics Program. We would like to thank Statec for providing the data and giving support.
This work is financed by National Funds through the Portuguese funding agency, FCT – Fundação para a Ciência e a Tecnologia, within project LA/P/0063/2020, DOI 10.54499/LA/P/0063/2020.