
Abstract
Since the beginning of the release of open data by many countries, different methodologies for publishing linked data have been proposed. However, they seem not to be adopted by early studies exploring linked data for different reasons. In this work, we conducted a systematic mapping in the literature to synthesize the different approaches around the following topics: common steps, associated tools and practices, quality assessment validations, and evaluation of the methodology. The findings show a core set of activities, based on the linked data principles, but with additional critical steps for practical use in scale. Furthermore, although a fair amount of quality issues are reported in the literature, very few of these methodologies embed validation steps in their process. We describe an integrated overview of the different activities and how they can be executed with appropriate tools. We also present research challenges that need to be addressed in future works in this area.
Introduction
Open government data (OGD) has proliferated in the last decade in most of the countries, with an increase in the number of datasets available on the Web. It intends to transform democracy by leveraging the value of data for society through the principles of openness, participation, and collaboration [96]. Thus, open data serves as a mechanism to promote citizen engagement with governments [95]. However, these efforts still have some limitations. According to a report from the World Wide Web Foundation [97], only 7% of the data is fully open, only half of the datasets are machine-readable, and only one-fourth has an open license.
With this increase in the number of data available to the public, linking and combining datasets have become important research topics [46,63]. Although many data consumers can achieve their goals using only one dataset, more value can be obtained by exploring different, and related data sources [12,14].
The pioneering initiatives in the U.S. and U.K. to produce linked government data have shown that creating high quality linked data from raw data files requires considerable investment into reverse-engineering, documenting data elements, data clean-up, schema mapping, and instance matching [57,81]. In addition, a bulk of data files were converted using triplification tools, using minimal human efforts [56] without much curation, therefore limiting the practical value of the resulting RDF.
Alternatively, datasets that are curated and of high quality are limited to restricted subjects (e.g., life sciences, such as in
The production of linked data has been increasing since its conception, as can be seen from the number of datasets available in the Linked Open Data (LOD) Cloud [40], and compiled in Fig. 1. Government data has many vital applications [15,69,82,89,94], and it is one of the most popular categories of the LOD cloud, with almost 200 linked datasets to date. According to the Open Knowledge Foundation’s Open Data Index (
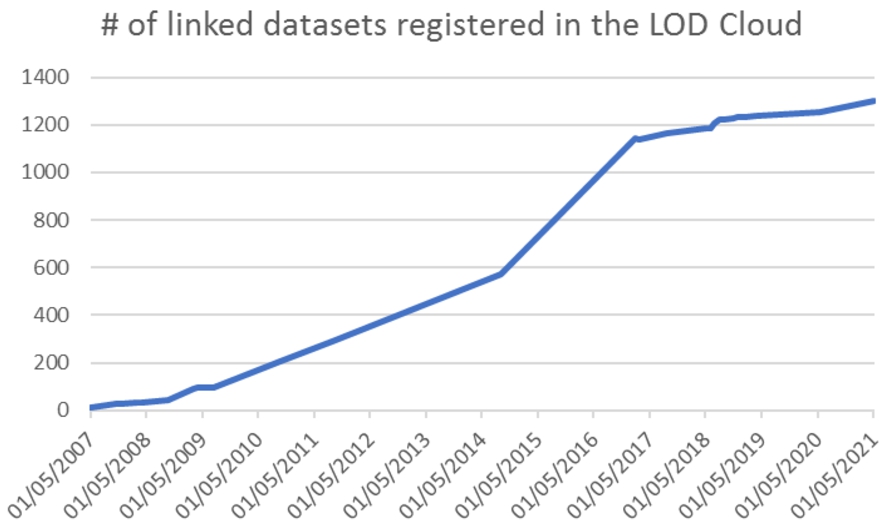
Number of datasets in the LOD cloud, since 2007 (numbers taken from
Even though Semantic Web technologies based on this idea have flourished, only a tiny portion of the information on the World Wide Web is presented in a machine-readable way (CSV, XLS, and XML files, in most cases). Notably, in open government data, this number is still low. For example, in [61], the authors elicited open datasets from federal, state, and municipality-level in Brazil and encountered no files with linked data and just one case in which RDF datasets were found. A similar picture in Colombia [76], Italy [14], and in Greece, [3], with 5%, 5%, and 2% of the datasets in the 4th or 5th level, respectively. A look into the data.gov portal (from the US, with different national levels) shows that there is around 2.5% of datasets in RDF format,1
Although RDF is not the only serialization format towards linked data, it is acknowledged that it is the most popular format and can be used here as a proxy for the use of linked open government data.
As will be outlined in the next section, some methodologies for publication of linked open government data were proposed, but the adopters claim that they are too generic for their purpose, without guidelines for software tools, templates, techniques, or other artifacts that could help in the adoption of this technology [14,45,55]. Although there are many guidelines for publishing linked data on the Web, many producers do not have sufficient knowledge of these practices. Few studies detail the whole process, leaving out the methods, tools, and procedures used [23], and proposing ad-hoc methods to produce linked open data, usually based only on the four principles with different interpretations on how to implement them. In [86] it is indicated, based on interaction with practitioners, that literature on publishing Linked Open Government Data (LOGD) has dealt with less complex, non-operational datasets and needs an engineering point of view, the identification of practical challenges, and consider the organizational limitations. In [14] the authors also argue on similar issues, such as linking quality to external datasets, the lack of domain-specific ontologies, and their proper alignment when they exist, and the expertise in SPARQL queries when consuming linked data.
Besides, several problems have been occurring regarding the quality of the linked data published on the Web. For instance, Hogan et al. [38] identified three recurrent problems by surveying LOD papers from the Semantic Web Journal: the existence of inadequate2
As described by the authors, inadequate means out-of-date or dead links, lacking connection to other datasets.
In this work, we aim to systematically map the literature regarding the processes and methodologies developed to publish linked open government data on the Web, targeting data publishers who seek to publish LOGD systematically correctly. Furthermore, we set out the research questions willing to discover the activities, tools, and quality control checks employed in LOGD publication and how they were evaluated. Finally, we integrate the findings into a unified model and discuss key challenges that remain to be explored.
Open government
Since the late 2000’s governments around the world started to move towards publishing increasing volumes of government data on the Web, perhaps most notably after the launch of national data portals in the United States (www.data.gov) and the United Kingdom (www.data.gov.uk). This opening has been happening according to the Open Data philosophy,3
Open data refers to data that “can be freely used, reused and redistributed by anyone”. Definition available at:
OGD provision presents some limitations that hamper data reuse. The organizational limitations originate mainly from the fact that in public administration, each agency manages data according to their norms since there is no central entity assigned with this role. Also, public agencies formulate hierarchical structures that contain several administrative levels. This organizational structure of the public sector suggests that in certain cases public agencies in different administration levels and different functional areas produce, maintain and possibly disseminate similar data, i.e. data about the same real-world object (e.g. a specific school) or the same real-world class (e.g. schools) [47]. The decentralization of open data publishing leads to data heterogeneity which makes the data hard to link, integrate and analyze, even when the domain and technical expertises constraints are satisfied.
Many studies [37,64,101] illustrate that the use of OGD is often hampered by the multitude of different data formats and the lack of machine-readable data, imposing restrictions on their consumption by end-users, in terms of discoverability, usability, understandability, access, and quality, among other aspects. Besides, even when the formats available are the same the information may be structured differently – with different labels or different granularities. Although publishing government information as open data is a necessary step to realize the mentioned benefits, it is not sufficient. In practice, gaining access to raw data, placing it into a meaningful context, and extracting valuable information is extremely difficult [48]. A possibility of reusing open government data is by linking them to other data so that relationships with other data can be explored [12].
In summary, Linked Data is about using the Web to create typed links between data from different sources – with diverse combinations of organizations, data formats, and exchange standards [13]. It refers to data published on the Web in such a way that it is machine-readable, its meaning is explicitly defined, and it is linked from/to other external data sets. Berners-Lee [12] outlined a set of design principles for publishing and connecting data on the Web, to become part of a single global data space, establishing the principles for linked data:
Use URIs as names for things; Use HTTP URIs so that people can look up those names; When someone looks up a URI, provide useful information, using the standards (RDF, SPARQL); Include links to other URIs, so that they can discover more things.
These were the initial principles to publish linked data on the Web. Berners-Lee [12] extends these principles to include the concept of open, by defining the 5-star scheme for linked open data, interested particularly in government data, but arguing that it could be also used for other types of sources:
Available on the Web (whatever format) but with an open license, to be Open Data;
Available as machine-readable structured data (e.g. Excel instead of image scan of a table);
as (2) plus non-proprietary format (e.g. CSV instead of Excel);
All the above, plus use open standards from W3C (RDF and SPARQL) to identify things so that people can point at your stuff;
All the above, plus: link your data to other people’s data to provide context.
Linked open data extends the concept of open data. Open data is data that is publicly accessible via the Internet, without any physical or virtual barriers to accessing them. Linked Open Data, in turn, is data that allows relationships to be expressed among these data, enriching the datasets with complementary information from elsewhere [53]. This extension carries complex issues such as different granularities, data alignment, transformation, and storage but also brings important benefits: contextualization of data and background information, by using additional information from other sources; automatic reasoning by software agents, among others. The emergence of the Linked Data principles has introduced new ways to integrate and consolidate data from various and distributed sources [13,34]. This ‘Web of data’ aims at replacing isolated data ‘silos’ with a giant distributed dataset built on top of the Web architecture, usable both by software agents and humans [32,33]. Thus, Linked Open Government Data enables the semantic interoperability of public administration information [14], enabling data consumers to create new services and applications by connecting different data sources, extracting maximum value and supporting reuse in unanticipated contexts [79]. In [11] it is argued that linked data is the best way to meet the three main requirements for which government data should be available on the Web: (i) to increase citizen awareness of government functions to enable greater accountability; (ii) to contribute valuable information about the world and (iii) to enable the government, the country, and the world to function more efficiently.
Related works
The production and publication of linked data are intensive engineering processes that demand high efforts to achieve high quality and existing general guidelines may not be sufficient to make the processes repeatable [75]. Since the conception of linked data, some principles and processes were proposed, with varying degrees of sophistication, practices, and tools.
The following studies presented some form of synthesis from previous methodologies. In [7] the authors also presented a systematic review of OGD initiatives (not linked data in particular) and presented a lifecycle deduced from the related papers, along with related challenges in different levels (organizational, economic and financial, policy, legal and cultural). In [87] the authors compiled the steps from 8 different linked open data methodologies but did not specify what were the criteria to select the primary studies. However, the proposed framework is also at a high level of abstraction. The LOD2 Project [1] also developed a lifecycle for linked data and provided software tools for the steps, although leaving out important steps – such as data modeling, alignment, and the publication of the data on the Web.
This study complements other systematic mappings or reviews, such as those of [26], which surveyed the adoption of best practices for publishing linked data, discussing which of the W3C best practices [91] are explicitly more present in the literature; and the systematic review on the use of software tools for linked data publishing, conducted by [8], which points out that most of the current state-of-the-art tools are concentrated in only a few of the steps of the publishing process, leaving important steps out. These systematic mappings did not provide information on the tasks involved during the process of linked data production. Moreover, in [23] the authors performed a systematic mapping of publishing and consuming data on the Web – a more generic approach than the one in the present study. One of their findings was that most of the papers surveyed did not mention publishing methodologies (28 out from 46) and most of the ones which did (12 from the remaining 18) just used the basic linked data principles as a guideline for the process. Other systematic mappings/reviews were carried out in different domains, such as enterprise linked data [73] and education [43,44], and applications such as linked data mashups [85], recommender systems [27], quality assessment [99].
To the best of our knowledge, there is no systematic mapping of linked open government data methodologies in the literature. Government data reflects the structural organization of the different bodies of the public administration. Even though they share the same top governance which provides the general guidelines, usually each public body has autonomy to collect, process and publish under their own norms. Thus, in this work, we sought to make a systematic mapping of methodologies proposed in the literature, to provide a synthetic comparison of the steps, tools, and validations proposed by these methodologies and how they were evaluated. Additionally, we propose a generic model, integrating these findings, and embedding some contemporary practices, such as those in the W3C’s Data on the Web Best Practices (DWBP) [92], that can be applied in different settings.
Methodology
In this paper, we use the systematic mapping method [72], aimed to identify research related to a specific topic to answer a broad question, essentially exploratory (e.g. What is known about X?), preserving the reproducibility of the study – since the objective of this paper is to present an overview of the literature to investigate the development of methodologies for publishing linked open government data. This is a complementary perspective with the systematic review [51] in which the effectiveness of treatments are aggregated and compared. The systematic mapping consists of 5 steps: definition of the research questions, search for primary studies, screening of papers for inclusion and exclusion, keywording of abstracts, and data extraction and mapping of studies. The complete results are available online:
Research questions
The research questions defined in this work aim to gather information about how to effectively publish linked open data in government settings, both for the steps involved and for the tools developed to accomplish it. We argue that this is an important contribution to the scientific community and practitioners alike, to describe what has been done and the gaps that should be addressed to systematically publish LOGD. Data quality plays a crucial role in the reuse of government data [9,66,101], so we sought to investigate what tasks were systematically embedded along the process to assure the quality of the published data. Data quality carries many different dimensions [99]. In this work we sought to find any kind of quality procedures, in particular verification and validation steps, involved in the methodologies to assure data quality. At last, we examined how the proposed methodologies were assessed to understand the rigor applied in their evaluation. This is important to understand what are the limitations of the proposals, given the constraints in which they were evaluated. Thus, we defined the following research questions:
RQ1. What are the common steps among the different methodologies proposed?
RQ2. What tools and vocabularies were used or recommended to support the steps?
RQ3. How were the methodologies evaluated empirically?
RQ4. What quality control tasks were specified to assure better data quality?
The answers to these questions provide a big picture of the relevant literature, with important steps to suggest a clear methodological framework for the publication of LOGD.
Search strategy
The following datasets were used for this systematic mapping since they are the most significant repositories in subjects that involve Computer Science: ACM Digital Library, IEEE Explore, Science Direct, Springer Link, ISI Web of Knowledge and Scopus. Google Scholar was also included since many studies are not indexed by these repositories, but only a fraction of its results were used, as discussed in the threats to validity subsection.
The keywords used to cover the research questions were methodology, publishing and linked open government data and their synonyms were considered to elaborate on the search string (Table 1).
Terms used for the search
Terms used for the search
The selection of the studies should reflect the primary works to identify different types of methods used to publish linked open government data. To that end, we elaborated the following criteria:
Inclusion criteria The study provides a process for publishing linked data in government settings as the main contribution; The study is from a peer-reviewed source; The language of the study is English; The text of the study is available;
Exclusion criteria
The study does not present a process for publishing LOGD;
The study is a previous version from another in the list;
The study focuses on the application of LD in a specific domain;
The study only investigates one step of the process;
The study does not investigate linked data, but open data more generally.
The procedure for selecting the primary studies for this mapping was carried out in late March 2020. There was institutional access using the university’s subscriptions to these databases.4
University of São Paulo Integrated Search:

Procedure to select the final studies.
Systematic mappings may present multiple threats to validity [100]. We composed the search string into three aspects: process, publishing, and linked open government data. The use of synonyms was based on textual analysis. These terms, particularly for linked open government data, were difficult to specify, because they had a different ordering of words and sometimes not used together. We acknowledge that some synonyms may be missing, which may cause some studies to be left out. To control the quality of the results, we used the studies described in the W3C Linked Data Best Practices [91] as a control to tune the query string, i.e., the papers cited in the recommendation were also returned by the search string. We also restricted ourselves to the execution of the query in the data repositories, not applying manual searches in other platforms. Some papers were not available, and for those, we searched on the Web for a copy and contacted the first author to try to obtain a copy of the work, but sometimes that was not possible. For Google Scholar, only the first one hundred results were considered, since it returned thousands of links and from that moment on, no other study was selected. At last, the synthesis of the papers were made based on the information provided by the papers’ full text. Any implicit information could not be assumed.
Results
The final selection resulted in 25 primary papers, with dates ranging from 2011 to 2020, which were used to extract information regarding the research questions. Table 2 presents the selected papers. We notice that important studies were made at the beginning of this decade and it has again been leveraged in the last few years. The reason for the creation of these methodologies in the period of 2011–13 is arguably the deployment of governmental open data portals, such as in the USA (2009) [35] and the UK (2010) [80] that released hundreds of datasets in their first years, glimpsing the opportunity for a “Web of data” [12]. However, none of the papers, since 2016, cited a different reason for not existing a large scale production of LOGD. One possible reason is the realization that publishing linked open data encompasses more than technological steps. In the last few years, the concept of a data ecosystem has evolved, trying to capture socio-technical aspects and their interrelations.
RQ1. What are the common steps among the different methodologies proposed?
Final set of primary papers selected
Final set of primary papers selected
This research question aimed to map what are the commonalities and differences among the different methodologies that have been proposed for publishing linked open government data. One first challenge was to find the correct granularity for this. Most of the studies divided the publication into phases and, in turn, in more atomic steps with clearer outputs. To analyze these data, we mapped out all the activities that were explicitly described as an important step in the papers, creating a matrix of steps x studies, as in Fig. 3.

Mapping of tasks and studies for the selected methodologies. The last column accounts for the total number of appearances.
Figure 3 lists all the explicit tasks identified and close to their ordering, as described in the papers.
The first step, sometimes implicit, concerns the selection of datasets to be published as linked data and leverages existing open datasets or new ones, the identification of their structure, and so on. In this step, it is important to consider relevant data, in the sense that they have a high demand in the society and reflect important aspects of public administration, and that present quality indicators such as completeness, accuracy, and timeliness [88].
Next, some studies consider cleaning up the data, to remove inconsistencies, typos, or problems with the structure of the data. In government scope, datasets are created by different agencies, using different formats, different levels of granularity for the data and the metadata. This stage is necessary to fix errors, remove duplicates, and get the data ready to prepare for transformations [57], usually in the form of tabular data.
One of the pillars of linked data is the unique and persistent identification of data resources. As such, the careful design of URIs must also be considered. Any kind of information represented by the data (digital document, person, company, organization, place, and so on) must be identified by a URI. By requesting this URI, the Webserver returns information about the thing identified by the URI (called dereferencing). In [93] the use of different protocols that can be used to provide this uniqueness of the resource is discussed. But, as pointed out by [12], the HTTP protocol should be chosen, since it provides a robust mechanism for lookup. As a recommendation [93], the URI should be (i) short and mnemonic, to be readable and remembered by humans, embedding certain information such as the source organization, the dataset name, their version, etc; (ii) stable, making the URIs last as long as possible, planning for decades; (iii) manageable, so that it does not break consumers’ code over time.
As different data sources may expose the same information in different representations, there is a need for a consensus on how to represent this data. A step is the definition of vocabularies,5
In most of the studies the following terms are used interchangeably: vocabularies, taxonomies and ontologies. In this work we use the same approach.
The specification of metadata – data describing the resources, both for the dataset and the data content – is also considered as a step to describe what is being published to the potential consumers, so that they can discover, understand and validate the data and encourage the reuse. The basic information varies according to the public administration guidelines, specifying if it is mandatory or optional when publishing new data. There are three common categories of metadata: descriptive, regarding the description of resources for purposes of discovery and identification (title, name, author, etc.); structural (schema and data dictionary); and administrative, to help manage the resource (when it as created, provenance, license, technical information, preservation, etc). A good practice is to publish these metadata both in human- and machine-readable formats, so that it can be processed by humans and computer agents [92].
Next, the careful mapping of the vocabularies to data is performed. This modeling step is needed to create the RDF structure to be represented from the original data. Simpler approaches adopt a field-to-field mapping (such as direct mapping6
The great advantage of linked data is to reuse data from external data sources, to discover additional information and create a Web of Data. To that end, the following tasks must be carried out: (i) identify and select the external sources with which one wants to link the data, such as Dbpedia7
Some studies use this linking to perform the enrichment of the dataset, importing data from the external sources, and extending the knowledge base schema. Two approaches are the most common [65]: (i) the evolutional enrichment, in which the ontological structure is not created upfront, but instead, the data is published in its simpler form and extended as more external data is linked, enabling a more agile development; (ii) ontology engineering methods, when existing data is analyzed to improve its schema, applying heuristics or machine learning techniques to find axioms, which can be added to an existing ontology. The enrichment can be performed before or after the conversion to RDF
Having the original data, metadata, and mappings to vocabularies, the step of converting ‘raw’ data into a Linked Data representation or serialization (RDF) is executed. There different formats of serialization, such as RDF/XML, Notation 3 (N3), Turtle, N-Triples, or HTML with semantic tags (RDFa). The chosen serialization format depends on what is the goal of the conversion process (file transfer, readability, visualization, upload to triplestore) impacts on the total length of the file with. Some actions performed in this phase may become provenance metadata that can also be added to the dataset, such as the tool used, steps taken to convert them, parameters used, and so on, so that third party users can trace how it was created.
A final task in data conversion is the RDF cleaning, sometimes regarded as a separate step. It is considered a good practice to have this sort of activity systematically in the process, since it can detect and enable the fixing before deploying the graph into production, turning it into a higher quality data graph.
Since datasets and their distributions change over time, a versioning mechanism for keeping track of changes is also needed. Common practices range from appending date or timestamp indicators in the name of the dataset or adopting more abstract numbering, such as major and minor modifications – common in software development – are assigned, incremented, and included in the metadata of every piece of data. W3C’s Data on the Web Best Practices [92] considers two guidelines for versioning: a unique indicator for the version of the dataset and the versioning history that explains the changes made in each version.
An important step for opening data is to provide a license to its use. According to the World Wide Web Foundation’s assessment framework,9
The point in opening government data is to make it available in creating data portals such as data catalogs, data APIs, or SPARQL endpoints. In this manner, one should plan which tools will be used, where it will be hosted, under which protocols the data can be accessed, or if it will be a centralized or distributed deployment, A common strategy is where each agency publishes their data, according to their processes and resources, and a national data portal hosts metadata and pointers to the actual data.
With these linked data and metadata resources, one needs to publish them on the Web, to be reused by third parties and made available in data portals or SPARQL endpoints.
The publication step can be leveraged by publicizing it and enabling the discovery by search engines or engaging with the community of users and consumers. The adoption of technological protocols facilitates the automatic indexing by search engines and the registration in different public catalogs may help to disseminate the new data. Additional metadata, such as the VoID vocabulary, contain information that can be used by software agents to discover and describe the datasets. The LOD Cloud10
Some studies point to the importance of building applications with the data, to help the community raise the awareness of it. Since the main goal of creating linked datasets is to promote the reuse of government information – to enable transparency, deliver public applications and encourage commercial reuse of data – public applications should be developed and made available, either being generic applications (such as semantic browsers, search engines or linked data interfaces) or domain-specific applications (e.g. exploitation or visualizations on education, health, etc.). Some national data catalogs provide specific sections where applications with the data can be downloaded or used online (e.g.
After the publication of the linked data, the government must receive feedback from the data consumers, engaging with a data community. This community is usually composed of a broad range of people and entities with different skills (researchers, citizens, infomediaries, other government agencies, etc.). The data community contributes to the process by [55]: (i) providing feedback on what data to release; (ii) contributing to the quality of the data; (iii) collaborating with other members to create solutions over the data. To that end, the government should assign an ‘owner’ to the datasets, so that this communication can be facilitated within the community.
With all set, it is important to have a plan to keep all this working overtime. To that end, the studies specify tasks to define non-functional requirements. Non functional requirements may be thought as quality criteria for evaluating how a system should perform (performance levels on serving data, uptime, security profiles to access the data, quality metrics, and so on).
As the publication of government data should be planned for decades, other maintenance tasks should be defined. Data preservation is an important aspect. Since data can be removed from the Web for many reasons, it should be handled properly so that data consumers can make decisions based on the result for the retrieval of the requested data. Proper HTTP codes can be used to automatically respond to certain situations – for instance, if data is no longer available anywhere or if it is currently available elsewhere. This way, the URI assigned to the data resource will respond for a long time about its state. W3C’s DWBP [92] also recommends that the coverage of a dataset should be assessed to guarantee that all vocabularies and pointers to other data are preserved along with the dataset and assuring its utility in the future. Since the Web of data relies on the assumption that the information is online, another good practice is to make sure that the data is constantly available. Some tools exist to monitor the availability, performance, interoperability, and discoverability of SPARQL endpoints, notifying the portal owners when something is not right.
Observing the last column (total occurances), we can see that some steps are much more present than others. In particular, the very basic steps are: select the data, convert to RDF and publish the data. Next, defining and mapping vocabularies. In fact, some studies are closely limited to these core steps [e.g. W9, W14, W17], reaching the 4th level of linked data. Next, the interlinking of different data sources, configuring the 5th level. A similar number of appearances for the metadata specification. There are more sparse activities, considering the publishing process in a broader sense, such as versioning and licensing of data, community feedback, and maintenance tasks.
RQ2. What tools and vocabularies were used/ recommended to support the steps?
Although the prescription of tools is not mandatory in a methodology, it surely offers a good starting point for practitioners, in making decisions like buy vs. build approaches. As argued in [53] and [34], working on simple datasets is a task that can be tackled manually, for small and static datasets. However, LOD projects, particularly in governments’ scope with large and diverse datasets, the use of tools is necessary to ease the publishing effort, in an automatic or at least semi-automatic approach. Thus, we consider that this is an important source of information. To that end, we used the same steps identified in RQ1 and mapped how each of the studies dealt with it in their respective papers.
Figure 4 shows the mapping of tools used in the selected studies. When a particular task (on the left) has an empty row (on the right), it means that no tool or concrete guideline was specified in any of the studies.
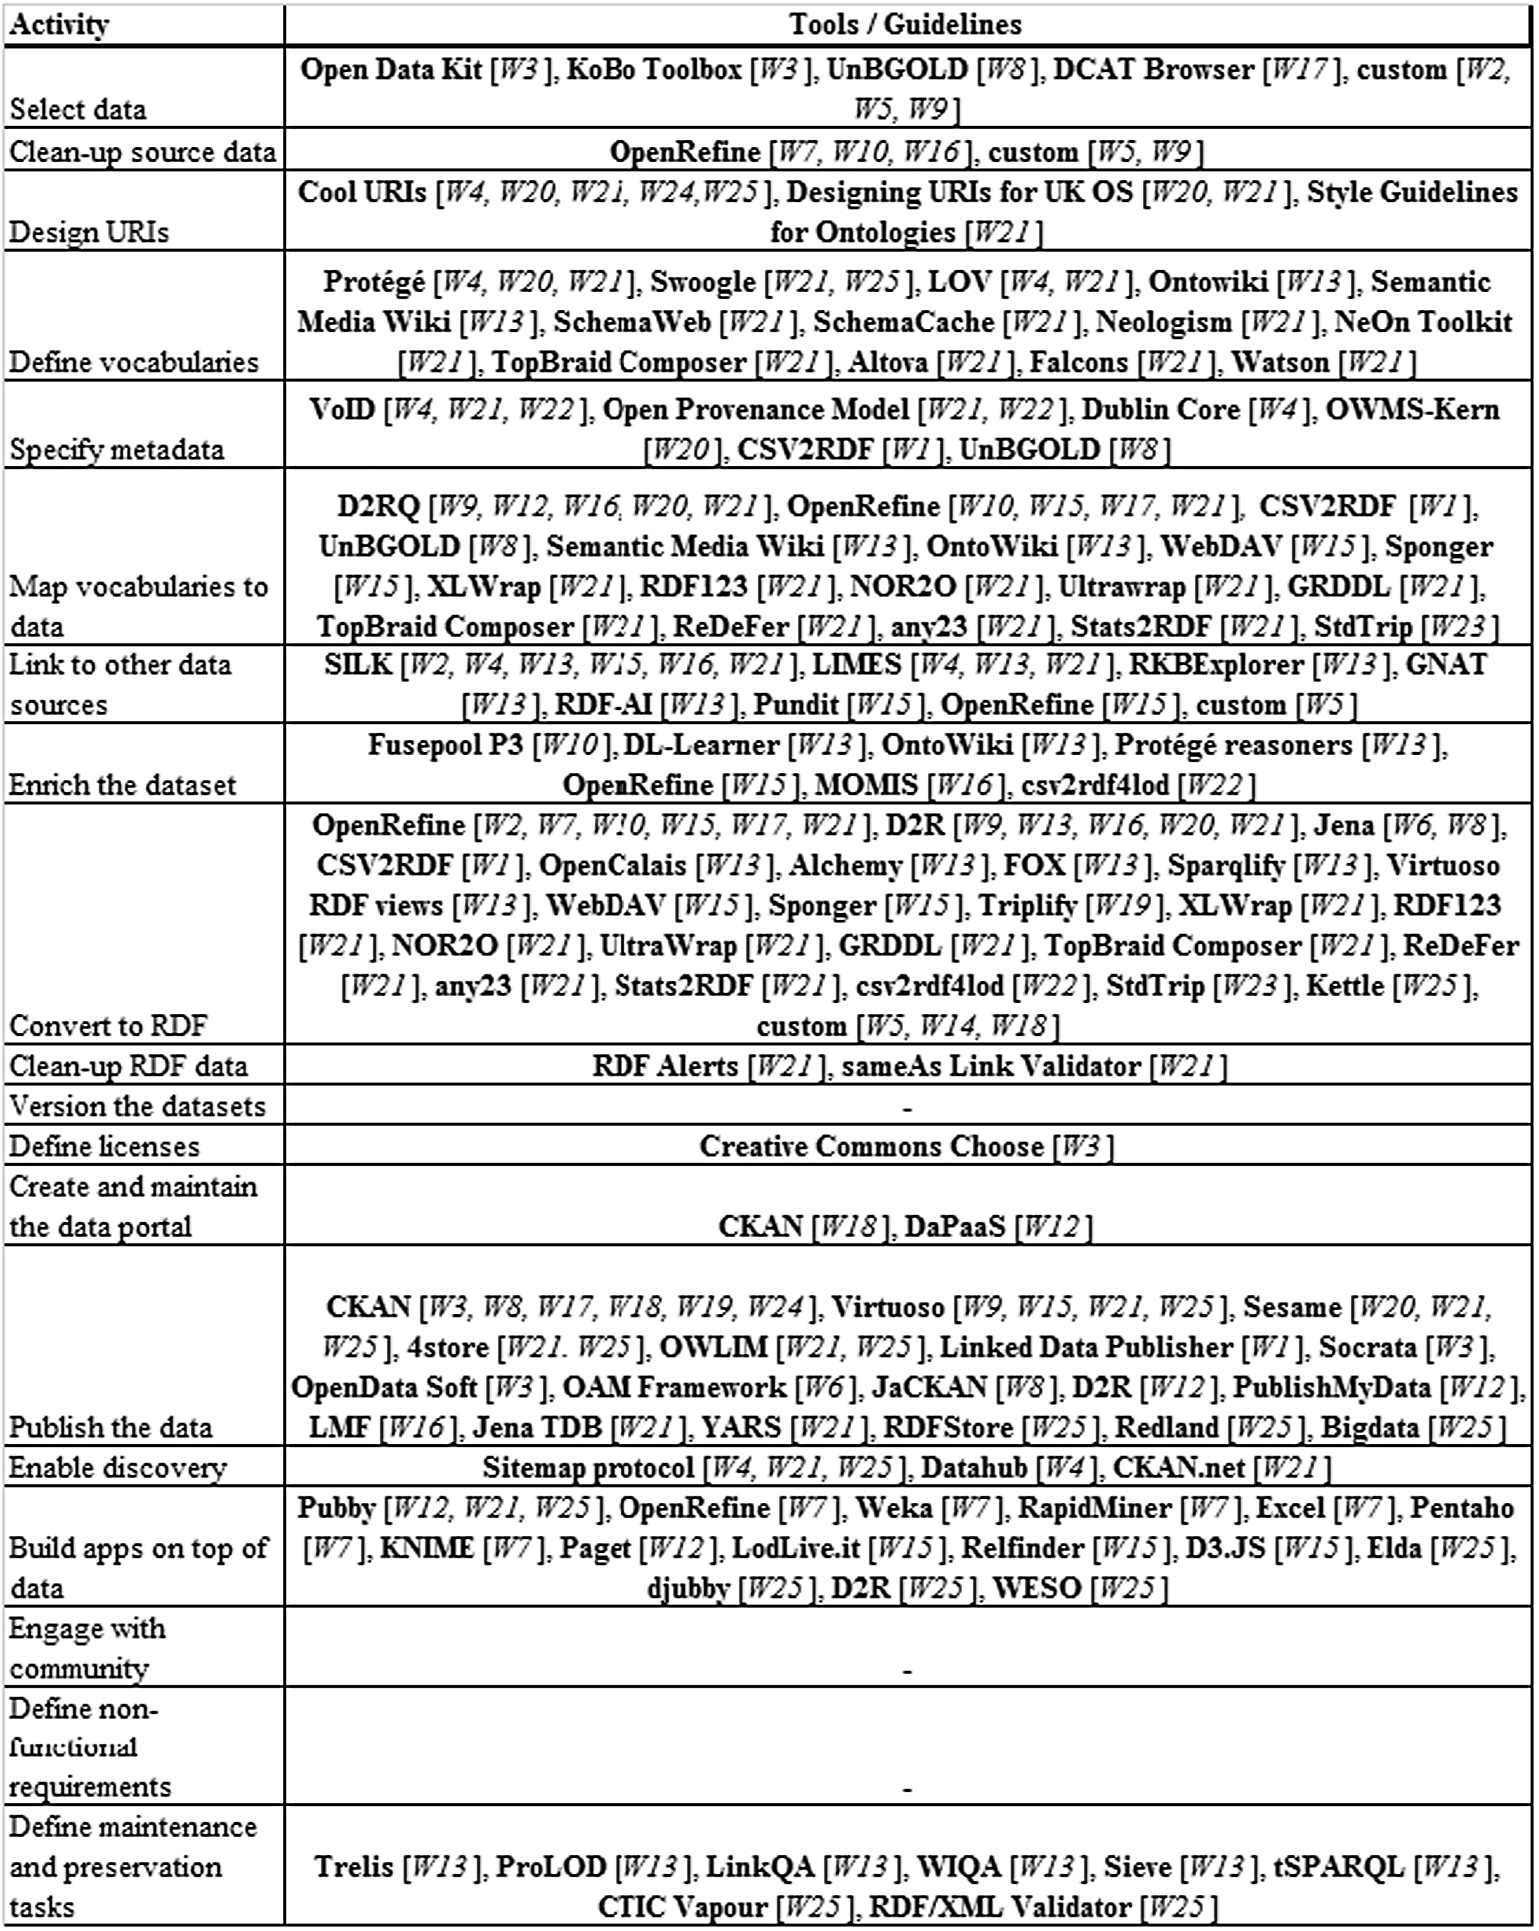
Artifacts used or suggested by the studies, according to the steps previously identified.11
Given the number of tools, the list of references can be found in the full report, available at:
Although a crucial step for any data project, where it can take up to 60% of total time,12
For the design of URIs no tools were used, but guidelines, especially the Cool URI guideline,13
For the definition of vocabularies two distinct approaches were identified: tools to search for existing vocabularies (such as LOV, Swoogle) [W4, W21, W25] and tools to create new vocabularies [W4, W13, W20, W21], like Protégé, OntoWiki, and TopBraid Composer. One of the core foundations of linked data is the reuse of existing vocabularies since it enables the sharing of conceptualizations among different databases on the Web. Thus, the use of search engines for existing vocabularies is of great use, in particular for cross-domain subjects, such as identification of people, digital resources, places, and so on, where stable vocabularies exist and are widely applied. On the other hand, application-specific data is not covered by these general vocabularies, and there is a need to create new vocabularies to describe the data being published. Hence, both approaches should be used when publishing linked open government data.
The specification of metadata was also underexplored concerning the tools applied to it. No tools were mentioned explicitly for this task, except for UnBGOLD (W8). Given the importance of metadata in linked data discovery, understanding, and sharing [102], this is a significant gap. Data catalogs, such as CKAN, provide features for creating metadata related to the datasets, although they are designed to be consumed by human users and not so easily by computer agents [70] since they are not available in semantic formats. On the other hand, some of the papers specify different vocabularies that can be used as guidelines or standards to model the metadata for linked open government data. Thus, there is a wide range of vocabularies that can be used to describe metainformation (Dublin Core, Provenance Model, etc.) or the data themselves (domain-specific vocabularies).
The tools for mapping of vocabularies to the data provide user-friendly or scripting interfaces where the publisher may craft the relations of the fields in the original data to the terms in the selected vocabularies. Some features include generating the mapping automatically from the data by direct mapping or by creating richer representations of the mapping, using hierarchies of attributes. The tools also enable the transformation of the original data to given patterns (for instance, by appending an identifier as a parameter to a URI pattern), assign constant values, or even apply simple conditions, among other actions. Some tools, such as OpenRefine, imports a given vocabulary to the project using its URI, and the publisher can use autocomplete features to do the mappings.
The biggest diversity in tools was found for the data conversion step, with many different tools proposed, used, or suggested. We believe that this is due to the limited conception of considering publishing linked data as only transforming different data formats to RDF. In the data conversion step, the choice of a particular tool depends on the nature of the data source. For instance, when the data is extracted directly from an online, relational database, the D2RQ platform was the most used. In other cases, where other static data formats are used, such as the common OGD formats of CSV, XML, and JSON, OpenRefine was most frequently used. Most of these tools also provide a feature that supports the mapping of vocabularies during the task of converting raw data into RDF – thus the overlapping of tools in both steps.
Some tools provide the feature of linking the data being published to other datasets. This is done by aligning the schema (using owl:equivalentClass or owl:equivalentProperty) or the instances (using the owl:sameAs property) of the original data. The linkage is made through the definition of rules used to match the source and the target databases, by comparing their values according to some metric – usually, string matching algorithms. As the matching is not perfect, the result is usually assessed by metrics such as precision and recall or accuracy. Some of the tools enable the linking before or after the conversion of data to RDF (e.g. OpenRefine and SILK, respectively). The results may have different levels of matching quality, depending on the proper definition of the comparisons and manual adjustments may be necessary.
For the enrichment of the dataset, the elicited tools offer the possibility of importing supplementary information of the matched instances to the data being published. When a link for instances of different databases are successfully established, one can retrieve additional fields from the remote database and add it as additional columns. Another approach is the use of semantic reasoners, that can evaluate the alignments made and create additional triples during the process of data conversion.
Once the data is linked, enriched, and converted to RDF, some works applied tools to evaluate the correctness of the RDF generated and enable the clean-up of the RDF data. Two approaches were found: firstly, the tool RDF Alert checks for syntactic and semantic errors (undefined classes and properties, inconsistencies, datatype errors, atypical use of vocabularies, etc.); and the second approach, the sameAs Link Validator tool checks for the relations discovered previously in the linkage step, detecting inconsistencies in the alignments. These tools do not correct automatically what is considered an issue; it only outputs to the publisher that there are inconsistencies that should be checked before proceeding to the next steps.
Regarding the versioning of the datasets, no tool was mentioned explicitly. Some data catalogs enable this by providing free text in the metadata, where the publisher may adopt different conventions for assigning the version, such as semantic versioning16
For the definition of licenses, the Creative Commons Choose tool was used to help the publisher on which license suits the best his dataset, by asking questions that drives the choice of Creative Commons license options. Usually, the assignment of the license to datasets and distributions is made by creating metadata triples linking the specific license to the dataset instance.
Concerning the storage of linked data, two tools were most used: CKAN and OpenLink Virtuoso, showing the possible division on how to make the data public, either by data catalogs, mostly used by humans or by triplestores, which can be easier queried by software agents. CKAN is currently the open data catalog most used by open government initiatives, hosting files, and serving them through the Web and their metadata by API interfaces. On the other hand, Virtuoso, an open-source platform used to host RDF knowledge graphs and making them available through a SPARQL interface. Although it provides more flexibility, it also carries problems of usability by end-users – who must be knowledgeable in SPARQL queries – and performance issues, because of the dynamicity of the query results.
The announcement of the datasets published on the Web is made by tools and practices that enable their discovery. Two approaches were found: the Sitemap protocol was applied in some works so that their datasets could be discovered by search engines, which implement this protocol to enable their crawling and to detail the data resources using their HTTP URIs. This is implemented by creating an XML file, using tools such as sitemap4rdf and hosting it along with the datasets. The second approach announces the published datasets to the community using data collections, such as DataHub and CKAN.net, so that consumers can be aware of their availability and consider their reuse.
To build applications on top of the data, two approaches were also found. In the first approach, linked data interfaces (such as Pubby, djubby, WESO and LodLive.it) are applied over the linked data published in triplestores. This enables consumers to explore the structure of the data resources, viewing their properties and their relations to other data resources. It also offers URI dereferenciability, by resolving the URIs and returning the data resource serialized, usually via content negotiation protocol. The second approach brings general-purpose libraries and tools that connect, processes, or help to visualize linked data (such as RelFinder and D3.JS JavaScript library).
For the engagement with the community, no tools or formalized practices were found in the selected papers. In W3, three ways were mapped to this end: (i) gather feedback from the community, (ii) gather contributions from the community to clean, annotate or enhance the data, and (iii) enable collaborations with the community, so that its members can create derivative works from the data. Data catalogs provide some rudimentary features and plugins towards these requirements, such as comment boxes, ratings, and complementary visualizations from data.
As for the definition of non-functional requirements, no guidelines or frameworks were mentioned. These non-functional requirements were diverse, comprising data quality aspects, compliance, accessibility, internationalization, caching management, security; however, none of the works described in detail how to deal with them using a systematic approach. In this work, we sought to describe one of these perspectives in detail – the data quality mechanisms adopted by these methodologies.
The maintenance tasks comprise tasks such as the update of the information in the graph, link preservation, and the check for the availability of the services. No tools were mentioned for these tasks in the selected works.
A possible categorization for the tools can be made by their generalizability across different tasks – most of the tools are specific to just one step of the process; however, other tools provide most of the steps of the whole process. In the latter category, we may find examples such as OpenRefine and the D2RQ stack.
Based on the coverage of the steps, both tools (Open Refine and D2RQ) can be considered as the most comprehensive ones. In fact, some works use them as the main instruments on the publication of linked open government data (e.g., for Open Refine: W6, W17, W15; for D2RQ: W9, W16). No formal comparisons were found in the literature between both tools, limited to the publishing patterns proposed by [34], based on the underlying data type and storage. However, some empirical works seem to suggest that OpenRefine is very user-friendly with its human-computer interface, but it does not scale well for large datasets.17
A drawback of this list is the discontinuity of the tools. A major part of the tools elicited in Fig. 4 can not be found any longer. Most of them were developed by universities as part of research projects, and, as they ended, so did the evolution of the tools’ features.
Some important gaps were found, such as the lack of tools for the proper management of metadata; an efficient mechanism to version the datasets, coupled to the other tools; features for the engagement with the community; and tools and guidelines for the definition of non-functional requirements.
RQ3. How were the methodologies evaluated empirically?
In this work, we consider the methodologies for publishing linked open government data as artifacts18
Here we adopt the notion of artifact as an artificial object created by humans to solve a relevant problem.
Evaluation methods adopted in the selected studies
As illustrated in Table 3, 52% of the studies (13 out of 25) did not provide an empirical evaluation in the paper, being restricted to make a list of steps and recommendations, mostly justified by the basic principles of linked data and the 5-stars schema. Most of the papers (12 out of 25) provided illustrative scenarios of the application of the methodology. The actual validations were varied, ranging from the visualization of weather statistics [W6] to cataloging a national library [W25], and also batches of government data [e.g. W9, W22]. According to this evaluation framework, illustrative scenarios differ from case studies because the latter involves analyzing the impact of the intervention in the natural environment with actual end-users. In the selected studies, no article provided this sort of evaluation, being restricted only to prove the concept. Also, three of the papers [W1, W8, and W23] focused on showing how a tool could support the process and detailed its features. We must emphasize that in this work we focus on the actual validation, as explicit in the papers. Some works build upon the authors’ previous experiences in open government data projects or perhaps on validations carried out in other stages of a research project and that could not be collected since they were not present in the text.
RQ4. What quality control tasks were specified to assure better data quality?
In software engineering, verification and validation (V&V) are the processes of checking whether a software product meets specifications and that it fulfills its intended purposes. Publishing open government data on the Web is a major effort, but their value is only as important as their quality [25]. As a complex process, verification and validation tasks could be used to better guarantee the quality of the data produced. Despite data quality in LOD being an essential concept, the autonomy, and openness of the information providers make the Web vulnerable to missing, inaccurate, incomplete, inconsistent, or outdated information [65]. And, as argued previously, even with all the effort made the final result may not reach a high quality. Thus, we sought to search which validation tasks were employed by the studies during the process.
Few studies proposed an explicit phase or mechanisms to make validations throughout the lifecycle of linked data production. W13 brings the most detailed tasks, with a phase dedicated to linked data quality and its respective validations. The authors considered the work of Zaveri et al. [99] and listed 18 quality dimensions and 68 metrics, divided into 4 groups: accessibility, intrinsic, contextual, and representational. However, the study did not apply it in a real case study, only with an illustrative example. W21 employed two validations in their methodology: in the data clean-up phase, to check for RDF, accessibility, vocabulary, and data types mistakes or errors; and in the final of the linking phase, in which domain experts should revise the automatic links created with tools like SILK or LIMES. W15 provides a validation phase, between the linking phase and the release of the data. In this phase, the authors claim that data should be checked for accuracy, accessibility, consistency, completeness, visibility, cataloging, promotion, compliance, and privacy. The study does not detail this phase nor apply it in a case study. W9 presents a step for validating tabular data, after the automatic collection from a digital catalog and before converting them to RDF. The authors presented their algorithm and applied it in datasets from Thailand open data portal, evaluating the precision and recall metrics of the algorithm for identifying structural problems.
Other studies mention the importance of validations during the process. However, they offered suggestions and did not contemplate dedicated tasks. W25 performed in their case study the validation of the RDF conversion for the correctness of format. W10 also did quality checks after the data transformation, and only did it in the case studies and without further detailing. W5 discusses the problem of data incompleteness but does not detail how their methodology and architectural components dealt with it. W6 states that, in their approach, only well-formed datasets could be processed but did not show how it could be checked in their methodology. W4 points to the importance of validating the links to external datasets, that should be performed by domain experts. W3 highlights the importance that potential users need to understand and validate the data, during the data collection phase, however, the authors do not detail how it could be carried out.
Based on the steps extracted from the papers, we built the following process model depicted in Fig. 5, with all the steps grouped by the most common phases present in the studies. In addition, there is a validation step at the end of each phase to ensure that the outputs are correct and valid. Thus, it can be used as a roadmap for LOGD initiatives and resource estimation, where managers may decide what level of formalism should be implemented according to their context.
As publishing linked data is a complex process, we argue that these are essential aspects that must be taken into account in the scenario of publishing open government data as linked data on the Web. In this work, we adopt W3C’s Data on the Web Best Practices [92] as a complementary framework, since it suggests multiple practices aimed to facilitate the interchange of data using Web standards, it is focused on data publishers. Moreover, it enables data consumption both by humans and machines – a desirable point for LOD initiatives. Also, we adopt verification and validation principles at the end of each phase to ensure that the data is being produced with high-quality standards.
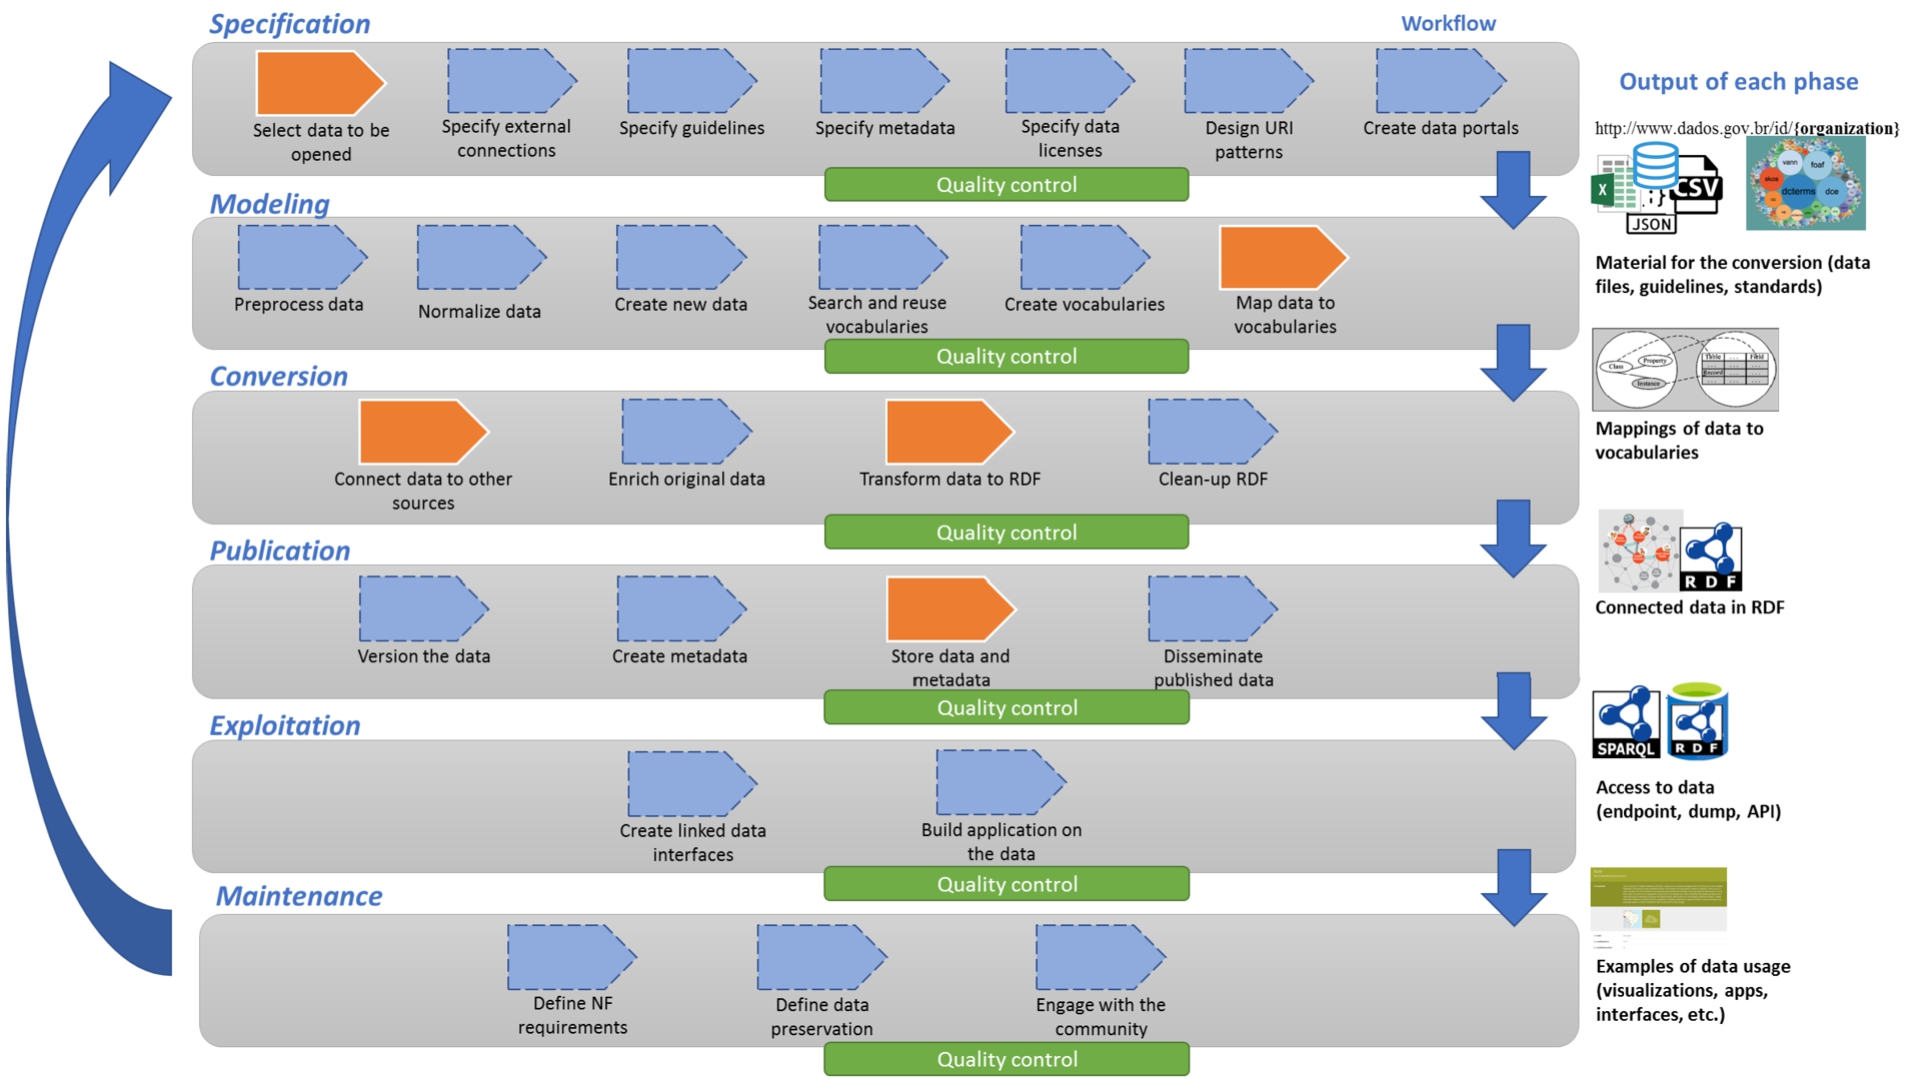
Unified process model proposed in this paper. The sequence of tasks flow from left to right, up to bottom. In orange, the mandatory tasks for having linked data, in blue, the optional tasks. Adapted from [70].
The first phase, named Specification, is when most of the planning occurs. The selection of the data to be published, according to government decision (active transparency) or by society’s request (passive transparency), is executed, and the data files are considered according to their number, formats, and connections to external datasets. As different agencies may have specific laws and standards, and some domains also must implement different specific guidelines, an additional step is the specification of guidelines that the data processor must adopted. Most government initiatives also specify metadata, both required and optional, that should be implemented with the datasets. Additionally, governments should specify the licenses that must be applied to the datasets, either by a default license or a one-by-one basis. Another critical step is the design of the URIs that each agency should apply to uniquely identify the data resources in the scope of the agency. The creation of data portal is another mandatory step since the published data must be somewhere on the Web. Most governments already deployed some data portals; however, most of them are not suited to linked data consumption. They may employ a central data portal or a data catalog, pointing to each agency’s source. Quality control here is concerned with the verification of a checklist with all materials being implemented as desired.
The second phase, the Modeling, encompasses the preprocessing of the data, required when the original data must be transformed, corrected, or normalized. Another possible step, as suggested by the W3C DWBP, is the normalization of data, by separating data values from their unities (such as dates, currencies, and measurements) to interpret their meaning accurately. After that, the data must be annotated semantically to be interoperable in the Web of data. To that end, the publisher must search for existing vocabularies that represent the data to be published as well as create new vocabularies and publish them on the Web, to represent all the relevant data being published. Lastly, the semantic mapping of data must occur to represent the data. The quality control tasks here may be the handling of missing values, the verification of common pitfalls in the design of ontologies, and the collaboration of domain experts to validate the structure of the preprocessed data and the modeling to semantic data.
In the third phase, the Conversion, the original data is transformed to its RDF representation and linked to external data sources. A first step is the connection to the external sources mapped in the first phase by joining common fields among them. Once they are connected, the enrichment of data can occur by retrieving data from these sources and combining locally with the data, making it easier to manipulate the data. Some tools require combining two RDF repositories while others enable the combination in design time, mapping the fields in the original data to external fields. With all the semantic and external mappings, one can convert the data to RDF, in the representation that better suits their needs. The quality control in this phase can validate the RDF, regarding the syntactic and semantic levels, with tools validating their structure and their axiomatic validity against the vocabularies used in their modeling.
The fourth phase, the Publication, groups different tasks related to the availability of data to the public. Once the data was modeled, linked, enriched, and transformed to RDF, one must version the data, provided with a unique indicator, to demonstrate how it relates to previous publications, making it clear if it is a new version or just a correction of a previous version of the data. Some recent approaches may help to cope with this, such as the use of Git-like versioning systems [6], named graphs in SPARQL datastores [31,62,84]. Also, to make available the versioning history so that data consumers can keep track of modifications on them. In the publication of metadata, they must also be modeled, semantically annotated, and stored along with the data, in different levels. This metadata should reflect descriptive (e.g., title, description, license, date of publication, coverage) and structural (schema) aspects of the data. In addition, some vocabularies – such as VoID or DCAT – may be adopted to enable the automatic discovery, parsing, and processing by software agents. With all the materials, one can store the data and metadata in the data portals or data catalogs, as specified in the first phase. Lastly, the data available publicly must now be communicated to the community. This communication can be made by implementing automatic protocols to enable search engines to find and index the data or get involved with communities, and infomediaries which can amplify the reach of possible users for the data. The quality control tasks can verify the availability of the data portal and the respective datasets, the correctness of the metadata, the existence of versioning mechanisms, the correct indexing of the datasets by search engines, and a communication plan for disseminating the published data.
In the fifth phase, the Exploitation, two different approaches are proposed. The first one is the creation of linked data interfaces since they provide generic visualizations that help data consumers to navigate and gain awareness on the extension of the data, their relationships, and semantic meanings. The other approach is to build applications with the data, mainly by providing complimentary presentations, as suggested by W3C’s DWBP, such as visualizations – enabling consumers to manipulate the data without advanced knowledge in data analytics. The quality control here is applied to verify that the linked data is available, is dereferenceable, and can be accessed via content negotiation, using the URIs and linked to other data sources, as specified previously. Also, to verify that the complementary presentations are in place and working as intended.
The final phase, the Maintenance, comprises activities that make it possible for the data to be available. The definition of non-functional requirements depends a lot on the context. More recurrent aspects are performance (e.g., how fast data can be accessed, resolved, or downloaded), security (e.g., only authenticated users may access some data), and usability (e.g., easiness of navigation, findability) aspects and can be implemented with the data platform being used. The data preservation step concerns tasks for the preservation of the data resources, their identifiers, and their links so that consumer applications are not broken over time. The Web has a very dynamic nature, so certain mechanisms should be placed to, at least, inform that data is no longer available and if it can be reached elsewhere. The same applies to the custom vocabularies developed for the specific context, which must also be preserved. Lastly, one needs to engage with the community of data users, so to gather feedback and propose refinements on future versions of the datasets. This engagement can be accomplished by collaboration tools, which can gather simple feedback for the availability or quality of the datasets up to crowdsourcing mechanisms to improve the quality of the data. The quality control tasks here may vary according to the requirements elicited – for example: verify that all requests to data return in less than x seconds, the links that were removed have redirection mechanisms with proper HTTP return code, the communication plan is implemented in the involvement with the community, by systematically gathering feedback and having automatic tools for communication, collaboration and feedback implemented in the data portal. Recent approaches may provide the tools [59], protocols [5,17] and architecture [5] to engage with the social semantic web, such as notification protocols, users contributions models and access control.
This process may also be seen as a lifecycle since the tasks from the exploitation and maintenance phases can lead to refinements of the specification or the collection of new data, making it more usable for the community in further iterations. It is an integrative model, and we acknowledge the lack of formal validation; however, we argue on the utility of this model as a reference for practitioners.
Although the open government data movement is still producing large amounts of data worldwide, the linked data still represents a tiny portion. This work sought to map methodologies developed to publish linked open government data on the Web and propose a unified model covering steps with established and modern practices. As the main contribution, our model raises awareness on multiple aspects that should be considered when publishing open government linked data. Thus, adopting specific steps depends on assessing the risks for not considering those steps and their impacts on the data community.
According to our search results, multiple studies in the last few years concerning applying a method to create linked data for a particular purpose, sometimes based on one of the studies listed here and, most of the time, by creating an ad-hoc approach for their problems.
The justification is that the existing methodologies are too generic and do not consider the particularities of their domain. Some domains were more prevalent than others in linked data applications: geographical data, e-procurement, agricultural and environmental data, smart cities, and legislative data. Also, a subset of the studies that were ruled out investigated just one or a few steps of the whole process – for example, techniques for data quality enhancement, automatic interlinking of datasets, vocabularies/ontologies development, the licensing resolution, semantic data extraction from HTML tables, among others.
Nonetheless, as pointed in [45], the existing Linked Data methodologies have a varying number of steps but still generally cover the same activities. The main difference between the methodologies is the grouping of actions within different steps and on different levels of granularity. However, apart from some apparent differences, which we will further examine, they cover the palette of actions involved in the process of generating and publishing a linked dataset and thus can be grouped into six general phases, as exemplified in Fig. 5. We argue that the model proposed in this work can be applied in different domains with varying strategies.
As this is a relatively mature area, we considered starting from established practices from the literature and analyzing the different aspects that are embedded in other methodologies. Therefore, we posed different research questions to discover and triangulate the steps and tools in each methodology and how they were empirically evaluated. Additionally, we also sought to investigate the specific tasks related to quality control in these processes – since this is also an important issue, as pointed in the literature.
Regarding our first research question, we showed the commonalities of the different methodologies. Most of the studies addressed the primary tasks of selecting data sources, converting them to RDF, linking them to other datasets, and publishing the resulting files. Although these are all essential tasks to publish linked data, some studies did not explicitly mention it. For example, W16 used as a starting point a particular dataset from the Italian government, thus not considering the step of selecting data sources and their particular issues. The only task explicitly described by all the methodologies was converting OGD data to RDF, rendering all other tasks as auxiliaries to this core activity. However, linked open data is not just about transforming tabular data into RDF and putting it on the Web. So, each methodology contributed sparsely with different, yet necessary, tasks that should be considered to achieve a final product with good quality, such as modeling the licenses of the data, the versioning of datasets, the engagement with the community, the definition of non-functional requirements (such as privacy and performance) and essential maintenance tasks. The basic strategy for implementing or not a specific tasks may vary according to the needs of the domain being modeled in the publication process. Some tasks require large efforts or human resources not available in real-world agencies and may be considered optional. However, we provide the tasks that should be considered in a formal initiative for linking open government data, enabling the customization for different scenarios according to the goal and level of formality required (e.g., [71]). The selected papers did not discuss how the specific needs of the government publication process (e.g., how different public bodies collect, process, publish, communicate, and share with other public bodies) are met by their methodologies. Given the socio-technical nature of this activity, this may be considered a gap for further studies.
The second research question assessed how these methodologies prescribed tools or practices to support their execution. The use of tools may be considered a systematic substantiation of the methodology since it provides a common ground that can be applied and compared in different situations. However, most studies suggested a small set of tools or just a single one to different steps. This oversimplification may also be a reason why they are perceived as too generic in later works. The major exception in this list was W13, which listed tools for every phase that encompasses their methodology in a 99-pages length report. As with the first question, the bulk of tools were concentrated in the core tasks: mapping vocabularies/ontologies to the raw data, converting data files to RDF, and the storage platform (triplestores or open data catalogs). A cross-reference with works such as LOD2 project [1] – developed to provide software stack aiming to support the production of linked data – or OpenGov Intelligence,19
Our third research question assessed how these methodologies were evaluated in their original proposal. The assessment framework we adopted here was based on the literature of information systems and design science research, which focuses on the design, development, and evaluation of artifacts to address real-world problems [36]. The artifact type here is a method, i.e., actionable instructions that are conceptual, not algorithmic. An essential phase of this framework is the evaluation process, with different degrees of formality. We found that some of the selected papers did not present any empirical evaluation of the methodology (logical arguments), primarily written to be used as a tutorial or a set of best practices rather than a formal inquiry. That is arguably another reason why they are perceived as too generic and not adopted in later works. Three studies (W1, W8, and W23) presented a prototype as the main contribution, embedding their methodology in software, demonstrating that it works as intended and it is helpful for its intended purpose. Thus, we noted a lack of more formal evaluations with the proposed methodologies in assessing how they modify their context. Although it may not be reasonable to design controlled experiments to evaluate the methodologies, other forms may be employed, such as case studies or action research. According to this framework, both evaluation types investigate how the artifact was used and address the real-world problem. On the other hand, the illustrative scenarios apply the artifact to demonstrate its suitability but do not consider how it affected the situation (for instance, the technological impacts or the consumption of the data).
Our fourth research question explored what quality control validations were employed during the process of linked data production. As pointed previously, data quality is still an essential issue for linked open data on the Web, so a validation model throughout the process could bring benefits to the availability of the final product. Our findings show that few studies presented explicit validation tasks during the process. Most of the studies either just recommended that some steps would be advisable or did not include it at all. The studies which did specify them either did not evaluate them with a real case study or did it for specific steps of the process – particularly, to validate the format of the input data (mostly, tabular data) or to validate the links to other datasets identified automatically. The exception was again W13, which provided a whole phase concerning data quality with many metrics and validations that could be performed in different aspects, but without an actual application. Two studies (W10 and W25) did not prescribe a specific task for validation during the presentation of the methodology, However, they did it in the illustrative scenario that they applied their methodologies, suggesting that validations are supposed to be implicit for the entire process. Thus, as answered by the first research question, the core steps and the additional tasks are essential in assuring a higher quality of the data and should also be considered for validation tasks throughout the process.22
We consider as core tasks the ones that are mandatory to provide linked data [12] and the auxiliary tasks as the ones that support these steps, augmenting their potential to be reused by external users.
We list in this section some possible research directions concerning improvements in methodologies to publish LOGD, in general. Other important aspects, such as data consumption, are out of the scope of this work.
Considering all the variabilities and commonalities from the different methodologies, we consider creating a process model for publishing LOGD. Since we have core activities that appear to be shared to all the contexts (RQ1), it should provide a map so that practitioners could understand the whole picture and make informed decisions on which steps should be used or discarded and their impacts in the final product.
Methodologically, illustrative scenarios provided are cross-sectional studies where the methodology was applied and evaluated for feasibility. It would be interesting to have longitudinal studies where the application of the method is evaluated over time. Furthermore, it should consider the usage of the linked data, how the methodology evolved in the context in which it was applied, and drive for the maintenance phase requirements. Although illustrative scenarios are helpful to demonstrate how it can be applied with actual data, the production of (linked) open data is a sociotechnical process [98,101] through which there is a continual interplay between technological (process, tasks, technology) and social aspects (relationships, reward systems, authority structures) which may result in additional requirements to be sustained over time. Besides, the papers did not seem to consider how their methodologies fit into the context of public organizations – their administrative structures, hierarchies, the need for communication and sharing of information, among other aspects, focusing on the technological aspects of publishing data.
The inclusion of explicit validation steps along the process may be helpful to ensure a higher quality product early on in the process. Some validations can be automated, particularly concerning structural aspects, and some may be considered prone to human analysis, especially in semantic modeling. Methodologies such as the V-model [29] for software development considers a validation point after the end of each phase and could be adapted to this end. Also, the application of acceptance criteria for user stories from agile methods could be applied. Quality frameworks such as the one provided by Zaveri et al. [99] and the Data on the Web Best Practices [92] could be used to support these steps.
Another research direction is the possibility to make large-scale deployment, reusing legacy open data. A large amount of structured and semi-structured data is already available in most countries and provides a valuable source to ‘cross the chasm’ and reach network effects on the already existing data. The task that requires the most effort is arguably modeling the data, either by carefully selecting existing and validated vocabularies or creating new ones for each of the datasets and their distributions over time. We argue that this could be achieved by deriving ontologies from the data files, from simple automatic mappings [10] to more elaborate approaches [30,74] as a starting point, leveraging the mature state of the data, applying a pragmatic perspective of linked data [67], which considers ontologies as a lightweight representation tool for an open and decentralized environment like the Web. The evolution of these vocabularies could be done collaboratively by data consumers and domain specialists inside or outside the government’s scope – thus, also decentralized. In addition, since the same information can be structured in many different forms, the standardization of both file format and information structure may be necessary, which involves the collaboration between public administration and certain communities (W3C, Open Government Partnership, Schema.org, etc.). A good starting point may be on the development of ontologies for the most common categories of government data currently published (government budget and national statistics, as shown in the Introduction), such as [21] or the Core Vocabularies from the ISA2 Initiative from the European Commission.23
As argued previously, the distributed nature of the Web makes it difficult to assure that all linked components are working or have high quality over time. Besides, the lifecycle of governmental datasets is very dynamic, reflecting administrative changes, domain refinement, new legislation or guidelines around the data, etc. Keeping track of these changes and making them transparently available is a big challenge. Thus, the maintenance phase is critical and should be developed further to monitor if what was once produced remains valid in this decentralized context.
We also point to the importance of success stories and pilots reports on the adoption of LOGD by public administrators. It may help promote and clarify this approach for adopting the practices and their challenges by detailing implementation steps and organizational contexts,. Initiatives such as the European Commission’s Semantic Interoperability Community (SEMIC) pilots24
Publishing LOGD is a complex social-technical task [98,101]. Although the release of OGD is still growing, the steps to transform it to linked data – with high quality – is an open issue. As discussed in this work, there are relatively few linked data on the Web, and they present quality problems. Although this is a complex multidimensional phenomenon, some technological and methodological approaches may support its development. Some methodologies were carefully designed, but it seems that they failed to base later works on publishing linked open government data. As argued in [90], there is no one-size-fits-all process and set of tools to publish linked data, given the different contexts, data sources, technologies, etc. However, the products of the process and most of the steps to achieve it are shared among different approaches. This paper followed this rationale by deducing what has been done in different contexts and deriving a unified methodology with practices adopted during the last decade.
Footnotes
Acknowledgements
This study was financed in part by the Coordenação de Aperfeiçoamento de Pessoal de Nível Superior – Brasil (CAPES) – Finance Code 001. The authors also would like to thank the reviewers for the thorough feedback on the manuscript.